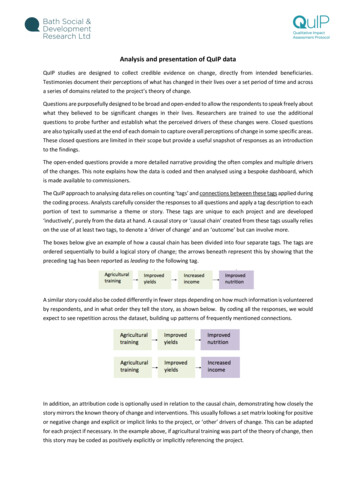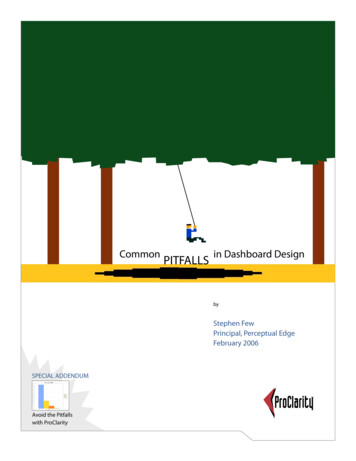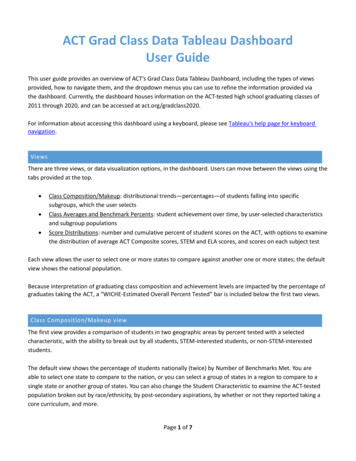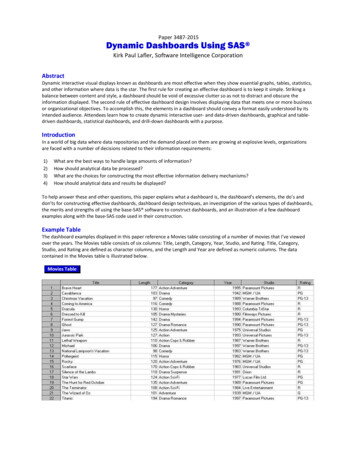
Transcription
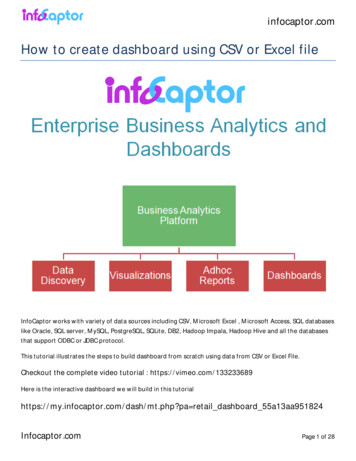
infocaptor.comHow to create dashboard using CSV or Excel fileInfoCaptor works with variety of data sources including CSV, Microsoft Excel , Microsoft Access, SQL databaseslike Oracle, SQL server, MySQL, PostgreSQL, SQLite, DB2, Hadoop Impala, Hadoop Hive and all the databasesthat support ODBC or JDBC protocol.This tutorial illustrates the steps to build dashboard from scratch using data from CSV or Excel File.Checkout the complete video tutorial : https://vimeo.com/133233689Here is the interactive dashboard we will build in this tutorialhttps://my.infocaptor.com/dash/mt.php?pa retail dashboard 55a13aa951824Infocaptor.comPage 1 of 28
infocaptor.comContentsDashboard Preparation - Pre-requisites . 41. Retail Dashboard preview . 42. Data set . 43.1 Download and Install InfoCaptor . 43.2 Create online account . 44. Preview Data . 5Dashboard Creation . 6Load Data . 61. Login Online Dashboard . 62. Click on Dashboard Editor icon . 73. Switch to the Data Tab . 74. Expand CSV file node . 85. Click on the CSV file button . 86. Select the file infocaptor1.csv . 97. Dimensions and measures. 98. Create date hierachy . 99. Change ord date year to string type. 11Build Chart 1 : Sales by year and product line . 111. Drag "Product Line" to Rows bucket. 122. Drag "ord date year" to Cols bucket . 123. Drag "Sales" to Values bucket . 124. Select "Vertical Bar [Stack]" from the Visualization Picker . 12Add Chart 1 to Dashboard . 121. Switch to Editor Tab . 122. Create new dashboard page . 133. Give a name to dashboard . 134. Switch to Visualizer Tab . 145. Save Data . 146. Add analysis to dashboard . 157. First chart on dashboard . 15Build Chart 2 : Sales by year and Customer Class. 16Infocaptor.comPage 2 of 28
infocaptor.com1. Switch to the Visualizer Tab . 162. Remove the product line dimension from Rows bucket. 163. Add Customer Class to Rows bucket . 174. Chart 2 complete. 185. Click on "Add analysis to dashboard button" . 18Build Chart 3 : Profit by affiliate and quarter . 181. Switch to the Visualizer Tab . 192. Reset the analysis . 193. Build new analysis . 194. Change legend position . 205. Change to Vertical group bar. 216. Change color palette . 227. Add analysis to dashboard . 22Build Chart 4 : Profit by Category and quarter . 231. Remove "affiliate" from Cols bucket. 232. Add "Category" to Cols bucket. 23Build Parameter 1 : Radio control for Warehouse . 241. Right click on Warehouse . 242. Select 'Create Parameter" . 243. Select "Radio" control . 254. Click on "Add as Parameter to Dashboard" . 25Build Parameter 2 : Checkbox control for Region . 261. Switch to the visualizer Tab . 262. Right click on Region Lookup . 263. Select "Create Parameter" . 264. click "Add as Parameter to Dashboard" . 27Save the Dashboard and Publish . 281. Click on the Save button to save the dashboard. 282. Click on "View Page" to view dashboard . 28Infocaptor.comPage 3 of 28
infocaptor.comDashboard Preparation - Pre-requisites1. Retail Dashboard previewThis tutorial will teach you to build the dashboard as illustrated in the following screenshot.2. Data setYou may download the CSV file available at this location 3.1 Download and Install InfoCaptorSkip this section if you already installed. Jump to step 3.2 if you want to build an online dashboard.Download link: http://infocaptor.s3.amazonaws.com/infocaptor enterprise setup.exeDownload and run the setup for InfoCaptor.3.2 Create online accountIf you choose to create dashboard online instead of on your desktop then please register and create an onlineaccount: https://my.infocaptor.com/dash/register.phpOnce you signup and login you can proceed with the following steps.Infocaptor.comPage 4 of 28
infocaptor.com4. Preview DataAs seen, the data needs to be organized in a tabular format as shown above. The first row is expected to be thecolumn header names.Infocaptor.comPage 5 of 28
infocaptor.comDashboard CreationLoad Data1. Login Online DashboardIn this tutorial we will use the online Dashboard Software-as-service to build and publish our dashboard. Login tothe service using your credentials[ If you don't have an account then create it here https://my.infocaptor.com/dash/register.php ]Infocaptor.comPage 6 of 28
infocaptor.com2. Click on Dashboard Editor icon3. Switch to the Data TabInfocaptor.comPage 7 of 28
infocaptor.com4. Expand CSV file node5. Click on the CSV file buttonInfocaptor.comPage 8 of 28
infocaptor.com6. Select the file infocaptor1.csv7. Dimensions and measures8. Create date hierachyRight click on the "ord date" field and select "Create Date Hierarchy"Infocaptor.comPage 9 of 28
infocaptor.comInfocaptor.comPage 10 of 28
infocaptor.comThe date hierarchy operation creates additional useful columns so that you can perform aggregate analysis by year,quarter, month, week and day of month9. Change ord date year to string typeData is now loaded and ready for analysisBuild Chart 1 : Sales by year and product lineInfocaptor.comPage 11 of 28
infocaptor.com1. Drag "Product Line" to Rows bucket2. Drag "ord date year" to Cols bucket3. Drag "Sales" to Values bucket4. Select "Vertical Bar [Stack]" from the Visualization PickerAdd Chart 1 to Dashboard1. Switch to Editor TabInfocaptor.comPage 12 of 28
infocaptor.com2. Create new dashboard page1. Click on "Actions" menu2. Select "New Page"3. Give a name to dashboardLet us call this "Retail Dashboard"Infocaptor.comPage 13 of 28
infocaptor.com4. Switch to Visualizer Tab5. Save DataConfirmation of data load completeInfocaptor.comPage 14 of 28
infocaptor.com6. Add analysis to dashboard7. First chart on dashboardInfocaptor.comPage 15 of 28
infocaptor.comBuild Chart 2 : Sales by year and Customer Class1. Switch to the Visualizer Tab2. Remove the product line dimension from Rows bucketInfocaptor.comPage 16 of 28
infocaptor.com3. Add Customer Class to Rows bucketInfocaptor.comPage 17 of 28
infocaptor.com4. Chart 2 complete5. Click on "Add analysis to dashboard button"Note: We do not need to save the data for adding new charts to the dashboard. All charts on the same dashboardwill be using the same data set that is already saved in prior step.This completes two charts on the dashboard. As you notice the subsequent addition operation stacks the incomingchart just below the prior chart.Build Chart 3 : Profit by affiliate and quarterInfocaptor.comPage 18 of 28
infocaptor.com1. Switch to the Visualizer Tab2. Reset the analysis3. Build new analysisAdd ord date qtr to the Rows bucketAdd affiliate to the Cols bucketAdd profit to the Values bucketInfocaptor.comPage 19 of 28
infocaptor.com4. Change legend positionInfocaptor.comPage 20 of 28
infocaptor.com5. Change to Vertical group barInfocaptor.comPage 21 of 28
infocaptor.com6. Change color palette7. Add analysis to dashboardInfocaptor.comPage 22 of 28
infocaptor.comBuild Chart 4 : Profit by Category and quarter1. Remove "affiliate" from Cols bucket2. Add "Category" to Cols bucket3. Add this chart to the dashboardInfocaptor.comPage 23 of 28
infocaptor.comBuild Parameter 1 : Radio control for Warehouse1. Right click on Warehouse2. Select 'Create Parameter"Infocaptor.comPage 24 of 28
infocaptor.com3. Select "Radio" control4. Click on "Add as Parameter to Dashboard"Infocaptor.comPage 25 of 28
infocaptor.comBuild Parameter 2 : Checkbox control for Region1. Switch to the visualizer Tab2. Right click on Region Lookup3. Select "Create Parameter"Infocaptor.comPage 26 of 28
infocaptor.com4. click "Add as Parameter to Dashboard"Infocaptor.comPage 27 of 28
infocaptor.comSave the Dashboard and Publish1. Click on the Save button to save the dashboard2. Click on "View Page" to view dashboardCheckout the complete video tutorial : https://vimeo.com/133233689Here is the interactive dashboard we just finished building in this tutorialhttps://my.infocaptor.com/dash/mt.php?pa retail dashboard 55a13aa951824Infocaptor.comPage 28 of 28
How to create dashboard using CSV or Excel file InfoCaptor works with variety of data sources including CSV, Microsoft Excel , Microsoft Access, SQL databases like Oracle, SQL server, MySQL, PostgreSQL, SQLite, DB2, Hadoop Impala, Hadoop Hive

