Transcription
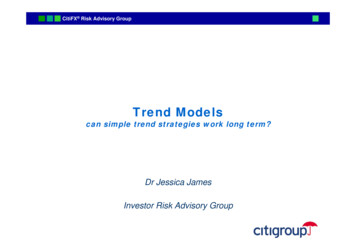
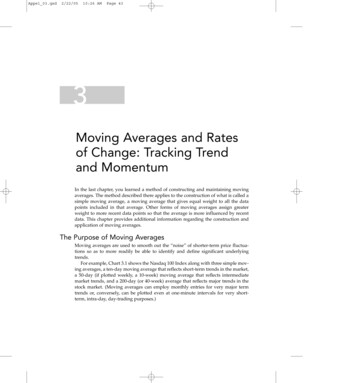
International Journal of Scientific & Engineering Research Volume 11, Issue 12, December-2020ISSN 2229-55181162COVID-19 Trend Analysis using MachineLearning TechniquesAbhishek JaglanB.Tech Student - CSEDr. Akhilesh Das Gupta Institute ofTechnology and ManagementNew Delhi, Indiajaglanabhishek08@gmail.comDaksh TrehanB.Tech Student - CSEDr. Akhilesh Das Gupta Institute ofTechnology and ManagementNew Delhi, Indiadaksh.trehan@hotmail.comPriyansh SinghalB.Tech Student - CSEDr. Akhilesh Das Gupta Institute ofTechnology and ManagementNew Delhi, Indiasinghalpriyansh58@gmail.comMs MeghaAssistant Professor - CSEDr. Akhilesh Das Gupta Institute ofTechnology and ManagementAbstract—With COVID-19 being the highlightof the decade and information related to it onthe rise in an unorganized manner, the need fora centralized platform to gather informationfrom on an international front doesn’t seem tobe far fetched. The data dashboard is formedwith help of data taken from reliable sources toportrait it in an interactive and easy to consumeformat with salient features like a chatbot, casesprediction with help of machine learning andprojection, of data in numerous formats updateddaily. The paper aims to provide a betterunderstanding to neophytes regarding thecurrent trend of coronavirus in the world alongwith imparting basic knowledge about thedeadly virus.chatbot the data was taken from cdc.gov.in to fetchquestions, and answer to faqs.At the front-end the files were processed intoconsumable material for website building purposesusing python based open-source frameworkDjango. The website was made presentable andinteractive using CSS and HTML.All these features combined formed a live datadashboard as a website updating itself daily,showing total number of cases for each countryseparately and in form of a world map for betterrelative understanding of the situation. It alsoportraits the recovering and infected cases for eachcountries in a graphical form for detailed view. Thedashboard gives you an option to put in yourqueries and get the answers to them in form of achatbot along with giving prediction of totalnumber of cases for each country in near future.The website also offers you a feature to downloadthe data in four different form (png, svg vectorimage and pdf, jpeg ).IJSERKeywords— COVID-19, Machine Learning,Prediction, Data Dashboard1. INTRODUCTIONThis project is one of the coronavirus related themeprojects. It is a machine learning based website fora data dashboard. A data dashboard is aninformation management tool that visually tracks,analyses and displays key performance indicators(KPI), metrics and key data points to monitor thespecific process. The dashboard consists of twofronts: front and back. The back end consists ofdata gathering, data preparation, data analysis, chatbot and machine learning, all of which isimplemented using Python. The front end consistsof making the website, converting the processedinformation at backend to a consumable form, anddeploying all these features online.Basic architecture of the COVID-19 data dashboardis shown in Fig 1. and MVC (Model ViewController) architecture for desired visual effects onthe dashboard is shown in Fig 2.At the back-end data for prediction and showcasingdata for different purposes was gathered from theofficial repository of John Hopkins University. ForFig 1. Data Dashboard ArchitectureIJSER 20201http://www.ijser.org
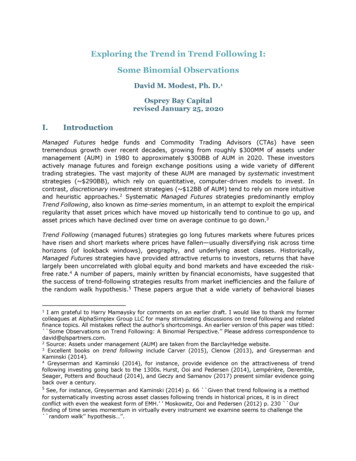
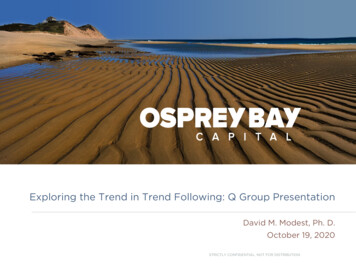
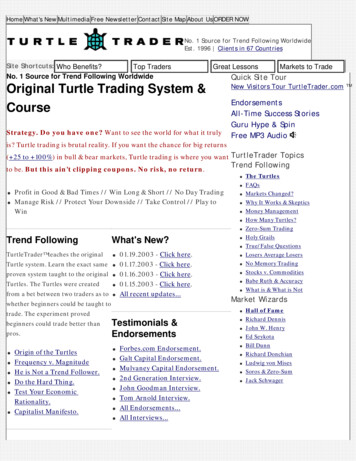
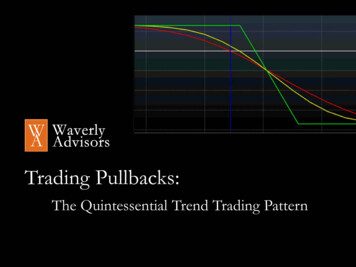
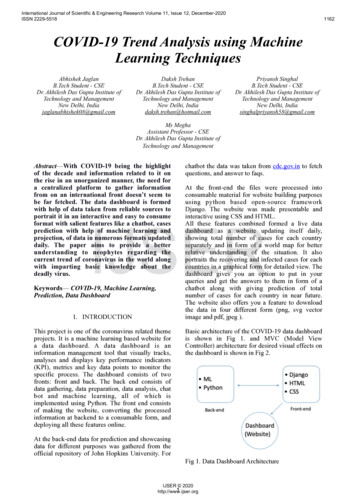
International Journal of Scientific & Engineering Research Volume 11, Issue 12, December-2020ISSN 2229-5518Combined key, Latitude count, Longitude count,FIPS. For further, easy processing we haveconverted the dates to date-time object usingstrptime().2.3 Regression AnalysisTo predict the future cases, causalities, recoverycases, we have employed Linear PolynomialRegression. Linear Regression is operated on twocontinuous variables to find relationship betweenthem. Linear Polynomial Regression that can beseen in Fig 3. can be regarded as extended versionof Linear Regression, it is implemented on relatedbut non-linear data. It is supervised in nature, andhandles non-linear data efficiently.Fig 2. MVC Architecture2. PREDICTION2.1 Data Procurement and PreparationThe dataset that has been utilized in prediction isfetched from data archive for “2019 NovelCoronaVirus Visual Dashboard” managed byCenter for Systems Science and Engineering(CSSE) at Johns Hopkins University, also,Supported by ESRI Living Atlas Team and theJohns Hopkins University Applied Physics Lab(JHU APL). The data fetched can be regarded asparameterized dataset having pertinent parametersincluding State, Country, Latitude count, Longitudecount and dates. To take in account the data forConfirmed, Death and Recovered cases, separatedataset has been used.IJSERThe dataset conscripted is continuous dataset andtherefore, is well suited for regression analysis as itneeds to predict from continuous dependentvariables from various independent ones. Therelation between dependent and independentvariables can be defined by coefficient of bothvariables in regression mathematical statement.Fig 3. Shows Simple and polynomial LinearRegression2.4 ImplementationThe data has been spitted in 4:1 for training andtesting respectively. On implying degree 3, themodel can show accuracy up to 71% for worldwidecases, 95.9% for worldwide recovery cases and93.33% for death cases worldwide. Fig 4. Showsthe split of data for training & testing, and theaccuracies obtained for different cases usingpolynomial linear regression.2.2 Feature SelectionIt involves tailoring our data for best results fromour model. Feature Engineering can influence theperformance of our model; thus, it is important tochoose it precisely. Including impeccable andsuccinct feature can help us to know better aboutthe framework of our data. The process includesdelving and aggregating or decomposing requiredfeatures to produce new characteristics or alter theprovided ones and destigmatizing irrelevantparameters.To cope up with our prediction model, we haveremoved squandered parameters such asFig 4. Shows the split of data for training & testing,and the accuracies obtained for different casesusing polynomial linear regression in PythonIJSER 20202http://www.ijser.org1163
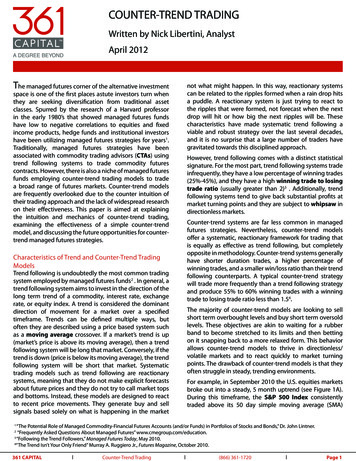
International Journal of Scientific & Engineering Research Volume 11, Issue 12, December-2020ISSN 2229-55181164Predicting Cases : The model trained and testedusing polynomial linear regression is used topredict the total number of cases on each day. Fig5. shows the predicted values, and Fig 6. shows thecomparison between test data and predicted values.Fig 8. Shows the comparison between test data andpredicted recovery valuesFig 5. Shows the predicted values for total cases oneach dayPredicting Deaths : The model trained and testedusing polynomial linear regression is used topredict the total number of death cases on each day.Fig 9. shows the predicted death values, and Fig 10.shows the comparison between test data andpredicted death values.IJSERFig 6. Shows the comparison between test andpredicted total valuesFig 9. Shows the predicted values for death caseson each dayPredicting Recoveries : The model trained andtested using polynomial linear regression is used topredict the total number of recovered cases on eachday. Fig 7. shows the predicted recovery values foreach day, and Fig 8. shows the comparison betweentest data and predicted recovery values.Fig 10. Shows the comparison between test dataand predicted death values3. CHATBOTFig7. Shows the predicted recovery values forrecovery cases on each day3.1 Data Procurement and PreparationThe data is fetched from Frequently AskedQuestions section of official website of Center forDisease Control and Prevention using requests andBeautifulSoup library. The dataset includes 70different questions regarding general awareness ofIJSER 20203http://www.ijser.org
International Journal of Scientific & Engineering Research Volume 11, Issue 12, December-2020ISSN 2229-5518public towards Novel 2019 Coronavirus. Thequeries and their solutions are collected separatelyand dumped in json files, which are thenaggregated to create a useful data frame.3.2 TF-IDF VectorizationTo follow-up with our chatbot, we have employedBag-of-word model using TF-IDF Vectorization,that converts text to feature vectors, thus makingestimation a cinch.Textual data can’t be employed on our modeldirectly, instead to make them work, we need toconvert them to numerical vectors. The model isn’tintricate, all it focuses is on occurrence of words inthe document. It can be achieved by assigning aunique number to each word, and the given datacan be encoded with the length of vocabulary ofknown words. The Bag-of-word model is all aboutthe words present in the document and their degreeregardless of the order of occurrence.To calculate word frequencies, TF-IDF Vector ismost popular method. It stands for “TermFrequency-Inverse Document Frequency” thatstores component of resulting scores assigned toeach word. Some words like, “the”, “is” mightappear a lot often in our document, but thatcertainly isn’t going to help our encoded vector.The goal of TF-IDF vector is to calculate the wordfrequency scores for highlighted text that are moreinteresting. “Term Frequency (TF)” calculates thefrequency for each word, whereas, “InverseDocument Frequency (IDF)” downscales the scoreof much frequently occurring word.Fig 11. Shows TF-IDF Vectorizer automaticallyrunning tokenization4. DASHBOARD FORMATIONAs we know Django is python based open-sourceframework which follows MVC(Model ViewController) architectural pattern used in the rapiddevelopment of the website with clean designwithout worrying too much about setting up anenvironment to start.IJSERFig 11. shows TF-IDF Vectorizer automaticallyrunning tokenization followed by learningvocabulary and calculating the inverse documentfrequency weights to calculate score for each word.There is a very high possibility that the user willnot enter same questions as in our corpus, althoughwe can expect the meaning and insight to be samebut we can never expect the words to be same too.The next challenge we face is to create similaritiesbetween the question corpus that we have fetchedand the queries asked by user. To match thequestion asked by user to the question corpusdeployed in our data, we use cosine similarity.For Covid-19 Dashboard data fetched online serveris analyzed and used many approaches to serializesthe data which is used in views.py files in django tofurther process the data and represent it to the user.Data fetched is sent to html(front-end) file forrepresentation in the form of maps, texts as well ascharts and to display these chart special LibraryChart.js is used . It also involves the part of Chatbotwhich compare the text entered by user and similarresults present to user's questions in file datafetched from online server.All the data fetched from backend is displayed infront end with the help of styling using CSS andJavaScript . Main goal of the project to make siteuser attractive and solving queries using Chatbot .Django worked as an intermediate between dataanalyzed using Machine learning andRepresentation of data to User.Cosine Similarity is a metric that is used todetermine similarity between texts regardless oftheir size. It tends to determine the cosine anglebetween two vectors that are projected in multidimensional space.Fig 12. COVID-19 Data DashboardIJSER 20204http://www.ijser.org1165
International Journal of Scientific & Engineering Research Volume 11, Issue 12, December-2020ISSN 2229-5518[4]P. Ghosh, R. Ghosh and B. Chakraborty,"COVID-19 in India: State-wise Analysisand Prediction", medRxiv, May 2020,[online] Available: https://doi.org/10.1101/2020.04.24.20077792[5]S. F. Ardabili, A. Mosavi, P. Ghamisi, F.Ferdinand, A. R. VarkonyiKoczy, U.Reuter, et al., COVID-19 OutbreakPrediction with Machine Learning, April2020, [online] Available: https://ssrn.com/abstract 3580188[6]F. Petropoulos and S. Makridakis,Forecasting the novel coronavirusCOVID-19, March 2020, [online]Available: https://doi.org/10.1371/journal.pone.0231236[7]M. K Arti and K. Bhatnagar, Modeling andPredictions for COVID 19 Spread in India,April 2020[8]H. Shekhar, "Prediction of Spreads ofCOVID-19 in India from Current Trend",medRxiv, May 2020, [online] Available:10.1101/2020.05.01.200874605. CONCLUSION AND FUTURE SCOPEThe research paper successfully shows the analysisof the gathered covid-19 data of world. Predictingfurther transmission of Covid-19 or coronaviruscould be useful in stopping its 6further spread. Thepaper purposefully displays the comprehensivesteps taken to implement the data dashboard forbetter understanding of the data and interactiveinformation exchange which will be helpful infurther taking necessary steps to manage theresources for its containment. Furthermore,different features such as Chatbot and Prediction oftotal cases, recoveries and deaths for the same areexecuted. These features were executed using TFIDF vectorization and Machine Learning modelbased on polynomial regression analysis but infuture with further availability of data morecomplex technology and algorithms can be put towork for better prediction and understanding of thevirus’ spread. The paper clarifies that polynomialregression analysis gives good accuracy rate andanswers questions about its near future impact interms of human life. This project highly depends onrealtime data and its availability is dependent onexternal factors but as time goes on the models willbe able to learn more and more due to heavy flowof data through them giving more accurate andreliable results. For further advancement in theaccuracy rate of the model different attributes canbe included during the process. Hope this articlecontributes to the world’s response to this epidemicand puts forward some references for furtherresearch in future.IJSER6. REFERENCES[1 ]Ekta Gambhir, Ritika Jain, Alankrit Gupta,Uma Tomar, “Regression Analysis ofCOVID-19 using Machine LearningAlgorithms” - ences#references[2]Features Evaluation and TreatmentCoronavirus (COVID-19), May 2020,[online] Available: https://www.ncbi.nlm.nih.gov/books/NBK554776/[3]N. S Punn, S. K. Sonbhadra and S.Agarwal, "COVID-19 Epidemic Analysisusing Machine Learning and DeepLearning Algorithms", medRxiv, June2020, [online] Available: https://doi.org/10.1101/2020.04.08.20057679[9]L. Yan, H. Zhang, J. Goncalves et al., "Aninterpretable mortality prediction model forCOVID-19 patients", Nature MachineIntelligence 2, pp. 283-288, May 2020,[online] Available: https://doi.org/10.1038/s42256-020-0180-7[10]L. Li, Z. Yang, Z. Dang, C. Meng, J.Huang, H. Meng, et al., "Propagationanalysis and prediction of the COVID-19",Infectious Disease Modelling, vol. 5, pp.282-292, 2020, [online] Available: https://doi.org/10.1016/j.idm.2020.03.002[11]S. Zhao and H. Chen, "Modeling theepidemic dynamics and cont rol ofCOVID-19 outbreak in China",Quantitative Biology, vol. 8, no. 1, pp.11-19, March 2020, [online] 0[12]J. Xie, Z. Tong, X. Guan et al., "Criticalcare crisis and some recommendat ionsduring the COVID-19 epidemic in China",Intensive Care Med, vol. 6, no. 6, pp.837-840, June 2020, [online] -7[13]W. C. Roda, M. B. Varughese, D. Han andM. Y. Lia, "Why is it difficult to accuratelypredict the COVID-19 epidemic?",Infectious Disease Modelling, vol. 5, pp.271-281, 2020, [online] Available: https://doi.org/10.1016/j.idm.2020.03.001IJSER 20205http://www.ijser.org1166
International Journal of Scientific & Engineering Research Volume 11, Issue 12, December-2020ISSN 2229-5518[14]W. Naudé, Artificial intelligence vsCOVID-19: limitations constraints andpitfalls, pp. 1-5, Apr 2020.[15]R. Gupta, S.K. Pal and G. Pandey, AComprehensive Analysis of COVID-19Outbreak Situation in India, April 2020[16]V. Bindhu, "Biomedical Image AnalysisUsing Semantic Segmentation", Journal ofInnovative Image Processing (JIIP), vol. 1,no. 02, pp. 91-101, 2019[17]A. Chandy, "A Review On Iot BasedMedical Imaging Technology ForHealthcare Applications", Journal ofInnovative Image Processing (JIIP), vol. 1,no. 01, pp. 51-60, 2019IJSERIJSER 20206http://www.ijser.org1167
COVID-19, Machine Learning, Prediction, Data Dashboard. 1. INTRODUCTION . This project is one of the coronavirus related theme projects. It is a machine learning based website for a data dashboard. A data dashboard is an information management tool that visually