Transcription
R E S E A R CH R E P O RTDepartment of Civil, Environmental and Natural Resources EngineeringDivision of Structural and Construction EngineeringISSN 1402-1528ISBN 978-91-7439-840-3 (pdf)Value Stream MappingLuleå University of Technology 2014-a case study of an inner wall manufacturerJarkko Erikshammar, Louise Bildsten, Martin Haller
ISSN 1402-1528ISBN 978-91-7439-840-3 (pdf)Luleå 2014www.ltu.se
Value Stream Mapping- a case study of an inner wall manufacturerJarkko Erikshammar, Louise Bildsten and Martin HallerInstitutionen för Samhällsbyggnad och NaturresurserLuleå tekniska universitet971 87 LuleåHEMSIDA/WEBSITE: www.ltu.se
Value Stream Mapping– Erikshammar, Bildsten & HallerABSTRACTValue stream mapping has become a frequent used tool in implementing lean thinkingat manufacturing companies. It is also an important tool for continuous improvement.The successfulness as a tool is associated with the creation of a large-scale visual mapof selected processes and interactions between these processes. In the process ofmaking the value stream mapping, a more profound knowledge about the company’sprocess is obtained by the employees, as its creation is carried out in collaborationwith people performing the activities in the processes.This case study was carried out at Moelven Eurowand, a manufacturer of interior wallsystems for offices. The purpose of this study was to investigate the possibilities ofshortening the lead-time of glass walls. The company was visited twice, the first visitwas a value stream mapping workshop and the second a follow-up meeting. Theimprovement team members at Moelven Eurowand found the value stream mappingtool very useful.4/26
Value Stream Mapping– Erikshammar, Bildsten & HallerSAMMANFATTNINGKartläggning av värdeflöden har blivit ett av de mer använda verktygen inom Leansammanhang. Dessutom är det ett viktigt verktyg för ständiga förbättringar.Dess framgång är kopplat till skapandet av en stor visuell karta över hela företagetsprocesser och samspelet mellan dessa processer. I arbetet med att göra kartan, fås endjupare kunskap om företaget genom att de som utför arbetet i processerna deltar iarbetet att rita upp värdeflödeskartan.Denna rapport är en fallstudie av Moelven Eurowand, en tillverkare avinnerväggssystem för kontor. Syftet med studien var att undersöka möjligheterna attförkorta ledtiden för glasväggar. Företaget besöktes två gånger. Vid det första besöketgenomfördes kartläggning av värdeflödet och vid det andra besöket skeddeuppföljningen av kartläggningen. Företagets representanter uttryckte attvärdeflödesanalysen var givande.5/26
Value Stream Mapping– Erikshammar, Bildsten & HallerACKNOWLEDGEMENTWriting this report has been a long process with company visits at MoelvenEurowand, discussion with our supervisor Anders Björnfot and searching forunderstanding.We would like to thank Peter Lindberg, Kristina Nordvall and the rest of the processmapping team at Moelven Eurowand. We would also like to thank Anders Björnfotwho has been supporting us during this process.Finally we would also like to thank the "TräIn" (Träinnovationsnätverket) researchprogram which is an EU financed collaboration project between IUC Norrbotten andLuleå University of Technology, which has made this research possible.Jarkko, Louise and MartinLuleå, January 20146/26
Value Stream Mapping– Erikshammar, Bildsten & HallerABSTRACT . 4SAMMANFATTNING . 5ACKNOWLEDGEMENT . 61INTRODUCTION . 81.11.21.32BACKGROUND . 8PURPOSE . 8DELIMITATIONS . 8METHOD. 92.12.22.32.4SINGLE-CASE STUDY APPROACH AND DESIGN . 9RESEARCH PROCESS . 9DATA COLLECTION METHODS . 9VALIDITY AND RELIABILITY . 93VALUE STREAM MAPPING. 104RESEARCH FINDINGS . 134.1 THE WORKSHOP . 144.1.1 The first step in workshop - mapping the current state . 144.1.2 The second step in the workshop – finding the future state . 174.1.3 The third step of the workshop . 184.1.4 The fourth step of the workshop- evaluation. 195ANALYSIS. 206DISCUSSION AND CONCLUSIONS . 226.1 MANAGERIAL IMPLICATIONS . 226.1.1 Planning value stream mapping . 226.1.2 Starting the workshop at the company site . 226.1.3 The mapping. 236.1.4 Remodeling the process . 246.1.5 Follow up: PDCA (Plan-Do-Check-Act) . 247FURTHER RESEARCH . 25REFERENCES . 267/26
Value Stream Mapping– Erikshammar, Bildsten & Haller1INTRODUCTION1.1 BackgroundThis report was part of the PhD-course “Värdeflöde från kartläggning till analys 7,5hp”. A case study was carried out in order to increase the understanding of theconcept of value stream mapping (VSM) and its application at a manufacturer of innerwall systems. The data collection for the case study was performed within twoworkshops in November and December 2009 at Moelven Eurowand, a manufacturerof interior wall systems for offices, located in Hulån in Central Sweden.Value stream mapping is a tool often applied in organizations working with Lean inorder to model and analyze production processes. A study made by Erikshammar etal. (2010), in the same field, indicate that value stream mapping is a useful tool forvisualizing the value stream.Moelven Eurowand strived to double their production volume during the followingfive years by keeping the production without larger investments. One of the missionswith this study was therefore to find managerial implications relevant for the companyobjective.1.2 PurposeThe purpose of this work was to develop an understanding of the concept of valuestream mapping and its application in the context of a manufacturer of inner wallsystems. Moreover, the purpose was to demonstrate the possibilities of shortening thelead-time of glass walls with the value stream mapping application.1.3 DelimitationsThe study does not intend to be a fully developed extended approach of the valuestream mapping tool nor does it give a formulism about how to deal with VSM inlevels of machinery equipment.8/26
Value Stream Mapping– Erikshammar, Bildsten & Haller2METHOD2.1 Single-case study approach and designThe case study approach was a suitable research strategy for the research in thisreport, since the objective was to develop an understanding of the concept of valuestream mapping and its application. The case company was selected based on theirexplicit statement and willingness to develop their production process. Thecompany’s and its CEO's willingness to adopt a lean production perspective andsystems building made this case also a good choice for the study.2.2 Research ProcessThe research process began with literature studies in order to guide the case studydesign (Yin, 2003). The initial theoretical framework was used as a starting point toget an accurate picture of the theory before validation in practice. Thereafter planningand execution of company visits were conducted, including preparation of workshopsand interviews.2.3 Data Collection MethodsValue stream mapping was used as a method to structure the two workshops. Thevalue stream mapping process was designed according to the method described byRother and Shook (2003). The teams participating in the workshops consisted of theproduction plant manager, three operators from production, the purchasing managerand the CEO. The team members were selected by the company. The workshops werecarried out at the case company’s production site.The workshop started with finding out the company’s purpose of the value streammapping sessions. The purpose became the aggressive goal to diminish the lead-timewith 50 %. Thereafter the workshop began with an introduction of the lean conceptand the value stream mapping approach. When the whole process was mapped, theprocess was analyzed and the future state map and the PDCA (Plan-Do-Check-Act)plan were created. The second workshop was a follow-up of the first one. Thisworkshop began with a summary of the first workshop, then the PDCA was followedup and discussed for adjustments.All interviews were unstructured interviews, where the respondents afterward had theopportunity to verify a summary made by the interviewer. The team members werealso given the opportunity to evaluate the process and the results. Participantobservations were made at the work-shops.2.4 Validity and ReliabilityIn order to strengthen the validity of the case study, the respondents were given theopportunity to verify the correctness of the interviews and workshops. In additioninterviews were triangulated with archival documents and home pages. Participantobservations gave the researchers a possibility to compare interviews with documentsand action in the workshop.9/26
Value Stream Mapping– Erikshammar, Bildsten & Haller3VALUE STREAM MAPPINGRother and Shook (2003) describe a method, “Learning to see”, for mapping valuestreams. The method separates material and information flow. Rother and Shook(2003) discuss also the importance of having a process owner, a value streammanager, who will be responsible for the value stream, and the development of thevalue stream. The method is divided into mapping the current state, mapping thefuture state and implementation in what they define as Yearly Value Stream Plan.During the process of mapping the current state value added activities and non-valueadded activities are revealed. Rother and Shook (2003) state that the practitionershould start with an overall picture and later detail the process map where necessary.The future state or to-be scenario is then described, where the objective is to createvalue stream where every individual process is connected to a customer by preferablycontinuous flow and a pull system. Each process should strive for a single piece flow.The Yearly Value Stream Plan (Rother and Shook, 2003) is a break-down of thefuture state into goals, objectives, activities and responsibilities, which represents theimplementation plan.Wilson (2009) argues that value stream mapping can be applied to any businessprocess including service, product development, manufacturing and office processes.When doing the value stream map, it is important to choose team members carefully.A common mistake is to choose the wrong members. Another critical aspect is thateveryone must understand the purpose of the value stream mapping activity. It isimportant to have vision with customer-focus with a three-four year perspective. Leanincludes both kaizen and kaikaku, where kaizen is small changes and kaikaku is aradical change. Value stream mapping is focused mainly on kaikaku. Takt time mustbe implemented to reach the vision to even out waste and overproduction. PDCA, as afollow-up plan, is a good tool to incorporate the vision. A vision without a plan is adream according to Wilson (2009).The value stream mapping application has been used and demonstrated in theconstruction context by Ballard et al. (2003), Arbulu et al. (2003), Álvarez et al.(2009), Serrano et al. (2008) and Khaswala et al. (2001).Ballard et al. (2003) use the value stream mapping application for precast concretefabrication. This case study of an engineer-to-order process came to the conclusionthat a value stream map is a powerful tool to change the focus from machine andpersonnel utilization into focusing on lead-time reduction, throughput increase andimproved productivity. By focusing on lead time reduction for engineered-to-orderproducts the project emancipated that the production system itself would be morerobust, i.e. less wasteful and give more rapid recovery. By using the value stream tooland “learning to see”, the lead times were reduced and the production system becamemore robust in the sense that errors were caught earlier and the system itself couldhandle deviation without new planning.“In short, they learned to look at the work-in-process to see if the production systemwas operating in accordance with its own rules” (Ballard et al., 2003)Arbulu et al. (2003) have performed a case study of the supply chain of pipe supportsthat are used in power plants in the USA. Practitioners say that pipe supports often10/26
arrive too late. In order to find out how to improve the process, it was necessary tofind out how the supply chain of pipe supports were currently organized. One type ofpipe support was therefore chosen for a value stream map that spans the whole supplychain both within the organization and the interface with company boundaries. Apartfrom improving the supply chain of pipe support the study also aimed to introducevalue stream mapping as a general tool to model and analyze other kinds of supplychains in the construction industry. The study of pipe supports illustrates thecomplexity including dependency and variation that is characteristic for constructionsupply chains. The conclusion was that the value stream mapping tool is helpful torecognize opportunities of improvements in a supply chain. Moreover Arbulu et al.(2003) argue that there are three main points to be considered when reducing leadtime caused by waste. These are: Choosing suppliers early and involve them in design. Communication through standardized processes and limited variation ofproducts. Integration of computer tools to facilitate design and product specification.The study was of a very specific product, pipe supports, but Arbulu et al. (2003) arguethat the fact of this study can be applied to any supply chain.Álvarez et al. (2009) argue that lean makes the manufacturing process more robust,leading to operational excellence, continuous improvement and elimination of nonvalue-added activities. This means according to Álvarez et al. (2009) that leanpractices increase factory performance as well as profits. Àlvarez et al. (2009) believethat the value stream mapping tool is effective and serves both a good communicationtool for practitioners as well a reference model for theoretical analysis. Álvarez et al.(2009) have proven that an assembly line with a small space can achieve high levelsof performance through redesign operative actions using the value stream mappingtool.According to Serrano et al. (2008), value stream mapping is a graphic technique toredesign production systems. The aim of their article was to evaluate the applicabilityof the value stream mapping tool in redesigning the production lines of six industrialcompanies. Serrano et al. (2008) also conducted a thorough analysis of alternativemethods, namely: flow diagram charts, structured systems, architectural systems andmodeling and simulation software. The result of the study by Serrano et al. (2008)showed that value stream mapping is a useful, efficient and applicable tool.Khaswala et al. (2001) explain the basic concepts of value stream mapping, as well asits advantages and disadvantages. Advantages of value stream mapping are accordingKhaswala et al. (2001): Value stream mapping relates the manufacturing process to supply chains,distribution channels and information flows. Value stream mapping integrates material and information flows Value stream mapping links production planning to demand forecasting andshop floor control in using takt time. Value stream mapping unifies methods like BPR, production flow analysisand process analysis that has previously been practiced in isolation. Value stream mapping is the base for implementing Lean in a company. Value stream mapping forms a company “blueprint” for strategic planning ofthe entire company.11
Some disadvantages of VSM that Kwasala et al. (2001) mention are: Value stream mapping cannot map multiple products that do not have thesame material flow. Value stream mapping lacks an economic measurement for “value”. Value stream mapping is mainly for high volume low variety (HVLV)products. Value stream mapping does not consider floor space for material handling. Value stream mapping cannot make a rapid change on a low budget.12
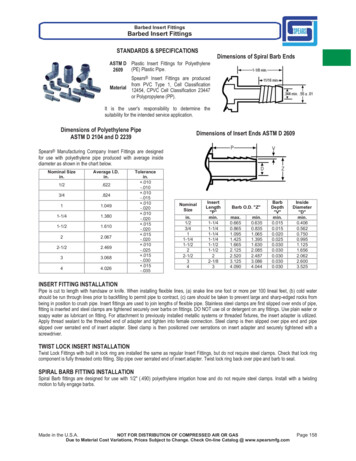
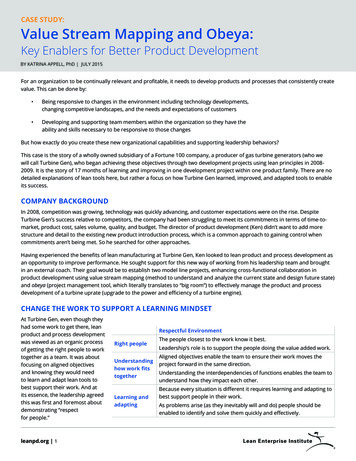
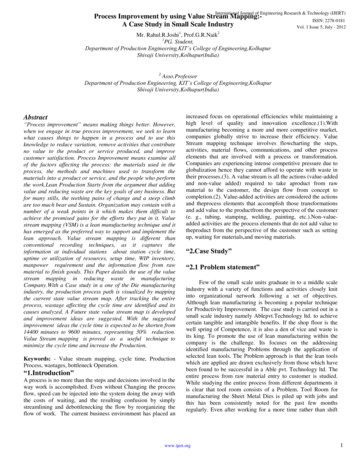
4RESEARCH FINDINGSMoelven Eurowand AB manufactures and sells prefabricated inner wall systems foroffices, see Figure 1. The wall system is called the “Eurowand method” which meansthat the walls arrive to the customer painted and ready for assembly.Figure 1: Inner wall systems manufactured at Eurowand (the Eurowandsystem). The picture is reprinted with the permission of Moelven EurowandABMoelven Eurowand AB was founded in 1973 and is Sweden’s largest supplier ofinner system walls for offices. The company has a total responsibility in development,production and assemblage of the wall systems. The manufacturing is carried out intwo factories situated at Hulån and at Kumla. The head office is in Örebro and thesales offices are in Örebro, Stockholm, Göteborg, Norrköping, Uppsala and Malmö.There are 160 people in total that work at Moelven Eurowand AB and the turnover in2009 was 208 million SEK.Our study was carried out at Moelven Eurowand AB’s factory at Hulån. The factoryat Hulån has 40 employees. The wall system consists of solid walls, room separatingwalls, doorways and glass walls. The production floor is divided into three divisions:working, painting and sub-assembly of wall sections. Each of the wall parts has topass these three divisions in order to be completed. The CEO asked us to follow theproduction flow of glass walls, see Figure 2.Figure 2: Glass wall product. The picture is reprinted with the permission ofMoelven Eurowand AB13
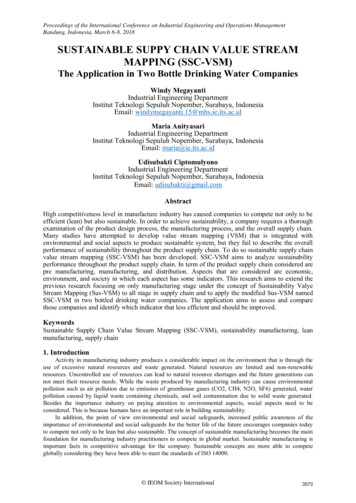
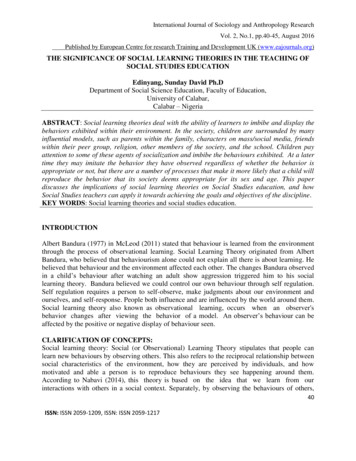
4.1The Workshop4.1.1 The first step in workshop - mapping the current stateAs earlier described in the methods section, the first workshop was initialized with apresentation about lean and value stream mapping and its purpose. It was explainedthat the lean concept is actually not a new invention, but is based on logicalprinciples. These principles are to keep the factory clean and tidy (5S) and work in alogic way to increase efficiency, which are the objectives with value stream mapping.When starting a value stream mapping process it is important to define the start andend point of the process that is to be studied. The task was to diminish the lead-timewith 50 %, thus it is important to define what this lead time actually consist of. Thevalue stream mapping illustrates the process from delivery of raw materials and endswith finished products, see Figure 3.MachineryHallPaintingAssemblyFigure 3: Studied process flowThe process is initialized by the input of raw materials i.e. wood products needed forthe frame of the glass door and glass. The wood products consisted of differentdimensions of timber bars and fiber boards i.e. MDF-boards. The production of glassdoors consists of three steps. The first step is the processes in the machinery hall wereall the pieces that constitute the framing are sawn and planed. The second step is thepainting of the different wood parts and finally the third step is the assembly of thewooden parts with the glass part. After the assembly the glass doors are prepared forshipping. The current state map is visualized in Appendix 1.The factory has a storage of MDF-boards and glass that has been delivered by theirsuppliers, see Figure 4.Figure 4: MDFThe first operation is sawing of MDF boards in a format saw, which optimizesformatting in order to minimize material waste, see Figure 5.14
Figure 5: Format SawThe saw optimizes the orders from an order box, see Figure 6. The order box is thereleasing point of production orders. Production orders are planned by the sequence oforders. The production orders are printed by the planning department and placed inthe box.Figure 6: Order BoxThe interviews, value stream mapping analysis and production data collected by thecompany revealed that the flow in the factory was uneven. The unevenness wasdetected by the assembling division and the painting division when they had to waitfor MDF bars that had not yet been planed or sawn because the machinery hall likeslarge batches to optimize machine efficiency, see Figure 7.Figure 7: Large batches in machinery hallThe assembling team had to wait because the painting team wanted to paint as bigbatches as possible of the same color. The changeover-time of coloring was extensive.This is why large batches are preferred to avoid the often dirty and heavy work ofdoing a changeover. Through the analysis of intermediate stocks between activitieswith interviews, a bottleneck was detected at the assemblage station. This was seen bylarge quantities of painted bars was waiting for assembly, see Figure 8.15
Figure 8: Painted bars waiting for assemblySo why are the assembly team waiting? The only problem was, it was not the rightbars to enable assembly. The painting division has to chase missing parts, belongingto a specific series of yellow labels in order to paint it and enable assembly, seeFigure 9.Figure 9: Yellow labels marking bars belonging to different projectsYellow labels were attached to bars of different projects in the machinery hall butwhen they are painted the labels disappear. This leads to confusion in finding the rightpieces after the painting. After the painting, the next step is assembly; see Figure 10,whose problems have already been described about missing pieces. However otherproblems occur as well, it is sometimes hard to fit all the pieces together if they arenot sawn with high precision. Moreover, there are quality issues discovered with thepainting which leads to extra time for painting and drying.Figure 10: Assembly stationAfter the assembly, the next step is packing for delivery, see Figure 11. Usually, thereis no problem with the actual packing. However because the projects are not finishedon-time there are many delays. The delays are due to that there are so many halffinished projects running at the same time, waiting for the last piece before shipping.16
Figure 11: Packing of glass doorsWhen the walk in the factory was over, it was time to note down all the information ina value stream mapping diagram. This was carried out during the following dayduring the workshop. The whole writing down of the mapping was done interactivelytogether with the participant group from the case company.4.1.2 The second step in the workshop – finding the future stateIn order to find the future state, it is of outermost importance to know the customerneeds as it is the goal of lean and value stream mapping. Interviews were thereforeconducted to pin-point customers’ needs. The customers were grouped into on-siteteams (i.e. the team that assembles the wall system at its location) and the endcustomer (i.e. the people using the wall system). The customers’ needs i.e. value thatwas found are listed in Table 1 (onsite-team) and Table 2 (end-customer.Table 1: Customer’s needs (onsite team)Customer needs (on-site team)On-time deliveryNo damagesThe right productComplete deliverySufficient information about details of deliveryThe right dimensionsFlexible delivery timeCan future state map solve this?YesYesYesYesYesYesNoTable 2: Customer’s needs (end-customer)Customer needs (end-customer)High quality finishingHigh quality fitting of door in doorwayAcoustic (affected by precisionassembly)Delivery precisionCan future state map solve this?NoNoin NoYesWhen all the customers’ needs were detected, the goals were set to what the futuremap should achieve. To enable a pull-system instead of pushing to the market, it isessential to understand that the customer in fact is the pace maker of the factory. Thusthe customer orders must be scheduled according to the factory capacity. To enable a17
steady takt time for an even flow in the factory, the time schedule of finishingcustomer orders must be put into consideration. An arrow is therefore set with a labelof even delivery of finished products in the future state map in Appendix 2. In orderto even out the flow in the machinery hall, they must only produce what thisdemanded by the painting division. The takt time should be related to the pace makerprocess. The pace maker process in turn should be controlled by customer demand.The machinery hall should limit their intermediate stocks with a maximumintermediate stock of one day. The projects should be grouped into batches and thehighest priority parts should be manufactured first. An arrow of daily control istherefore put between the machinery hall and the painting.The CNC-machine has a limit, which is the bottleneck (related to machine capacity)for the machinery hall. However, if the flow is more even and looking at the wholeprocess, the NC-machine is not a bottle-neck. To spare man-hours in production, it ispossible to invest in a sanding application for the NC-machine. Because this is thebottleneck this machine has to be controlled for daily output, see Appendix 2.As the pace maker process is controlled by customer demand, the painting divisionshould paint only what is needed for immediate subsequent activities. To know whichpieces that should be painted, a whiteboard was found to be a good way ofcommunicating this information between painting and assembly. No defect productsshould be passed over to assembly. Therefore daily control between those activities isillustrated with an arrow in the future state map, see Appendix 2.The painting division is in need of more storage space and this can be reached bytidying up the shop floor. Another issue is that the painting machine needs regularservice which is not maintained properly at the moment. There should be control ofwhat and how much is to be painted each day, see Appendix 2.As the assembly division often receive incomplete projects from the painting division.The assembly has to wait until they have all the pieces of a product. This leads to thatthe assembly becomes a bottleneck for the whole factory. The assembly should nottolerate any buffers in their production flow. The assembly must prioritize tasks thatthe shipping team needs to send. Decoupling of delivery from production takt time,and only deliver what the customer demands should be achieved. A two-bin systemfor semi-finished products was found to be a good way of organizing intermediatestocks, i.e. always have one finished and one semi-finished bin to keep the right takttime.Just like the painting division, the assembly division also needs to free up space bytidying up the shop floor. This is because the finished goods need storage spacebefore delivery. To achieve the goal of storage space a storage meeting should be heldevery week, with weekly planning of deliveries, see Appendix 2.4.1.3 The third step of the workshopThe PDCA plan is a concrete list of actions that is decided should be done in order toreach the future state. A list of actions was noted down together with the participantteam from the company. The list was the following:18
Visual planning for a more efficient information flow between the differentdivisions i.e. machinery hall, painting and assembly.Daily and weekly meetings between divisions in the factory.Remove unnecessary information on the yellow labels.Planning of customer orders for even flow.Make the change-over for the painting machine easier.More service on the painting-machine to make it running smoother.Find a solution to make the planer more efficient.Tidy up to facilitate movements (and flow) in the factory.The glue station should examine the products from the painting division. Thedefects products that are discovered by the glue station should be reported tobe able to find the causes of defects.4.1.4 The fourth step of the workshop- evaluationThe fourth step of evaluating the PDCA was done one month later. Some of the taskswere taken care of, others were in progress. The participating team showedenthusiasm and dedication to continue the value stream mapping process as it must bean always ongoing process.19
5ANALYSISIn this section we will analyze our results in order to evaluate the method of valuestream mapping. Wilson (2009) argues that value stream
Value stream mapping is focused mainly on kaikaku. Takt time must be implemented to reach the vision to even out waste and overproduction. PDCA, as a follow-up plan,is a good tool to incorporate the vision. A vision without a plan is a dream according to Wilson (2009). The value stream