Transcription
e-bookData-driven Value Stream ManagementAccelerate Your Market Response and Adaptability
“The most critical metric is how long it takesfor an innovative idea to reach a customer.If it takes your company months, how canyou compete with an organization thatdelivers in days?”Adrian Cockcroft, Vice President of Cloud Architecture Strategy,Amazon Web Services11. Cloud for CEOs: Measure Innovation with one metric, AWS executive insights, Adrian Cockroft2Tasktop
IIntroductionIn a digital-first climate, the role of IT leaders such as the ChiefInformation Officer (CIO) have never been more important. Yetdelivering excellence has become much harder—especially inthe Novel Economy where nothing is certain and where digitalinteraction dominates nearly all aspects of our living and workinglives.No longer responsible for “just” supporting efficient IT functionalityfor the business and their customers, CIOs must also deliver greaterend-user experiences through innovative software products, withzero tolerance for outages or security breaches.No easy task, especially as pressure and expectation from thebusiness intensifies—89% of CIOs say they are more involvedin leading digital transformation initiatives compared to theirbusiness counterparts, with 56% of the latter agreeing with thatshift (up from 47% in 2019).3Not that IT leaders are shying away from the challenge, far fromit; many are taking proactive measures to respond faster to themarket by adopting practices such as value stream management(VSM).According to Gartner, "By 2023, 70% of organizations will usevalue stream management to improve flow in the DevOps pipeline,leading to faster delivery of customer value."32. 2020 State of the CIO, IDG Communications, Inc.3. Gartner, The Future of DevOps Toolchains will InvolveMeasuring Flow in IT Value Streams, Majunath Bhat, Daniel Betts,Hassan Enaciri, Chris Saunderson, Thomas Murphy, 14 Jan 2020Data-driven Value Stream Management3
The progressively maturing practice takes a systematic approach tomeasuring and improving end-to-end flow that helps organizationsto: Shorten time-to-market Increase throughput Improve product quality Optimize for business outcomes, such as increased revenue,customer retention and employee happinessThe rise of VSM is born out of the frustration that despite spendingbig on Agile, DevOps, the Scaled Agile Framework (SAFe ) andother IT investments, most enterprises are still not adequatelyresponsive or adaptive—only 16% can release more than once amonth.5 While the tech giants are pivoting as nimbly as jet skis,larger organizations can often feel like a cruise ship.The question on the lips of many IT leaders is: Why am I not seeingthe results I was promised?One of the core reasons is that multi-year IT initiatives have notbeen governed by an agreed-upon set of outcome-based metricsand real-time visibility into the health of their value streams. Andin cases where they do know what’s holding them back, they don’thave adequate data, analytics and visualizations to convince thebusiness to sign off on funding and investment where it’s needed.That’s where data-driven VSM comes in.Read on to learn: What data-driven VSM is and why it matters How to continuously measure value streams to optimize flow How conversations around flow are enhancing collaborationbetween business and IT leaders How leading organizations are using real-time Flow Metrics toimprove responsiveness and adaptability5. Forrester Digital Transformation Requires DevelopmentTransformation, Jeffery S,Hammon, Deigo Lo Guidice, and ChristopherCondo, 13 December 20194Tasktop
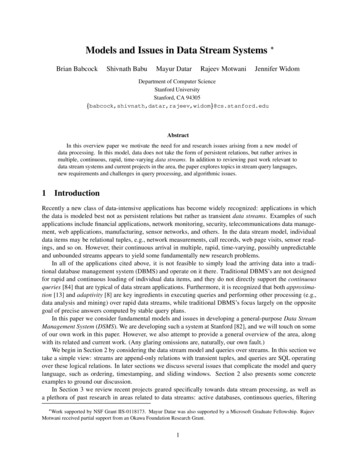
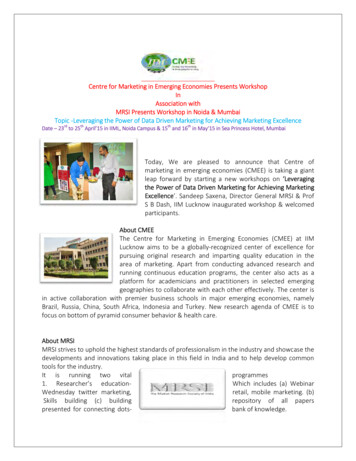
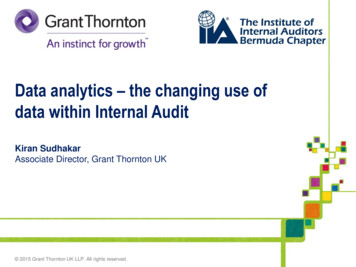
I Value Stream Managementin Software Delivery“A combination of people, process, and technology that maps, optimizes, measures,visualizes, and governs business value flow (including epics, stories, work items) throughheterogeneous enterprise software delivery pipelines. Value stream management tools arethe technology underpinnings of the VSM practice.”- Elevate Agile-Plus-DevOps with Value Stream Management, Forrester Research, Inc., April 20, 2018For many CIOs, the realization that they can’t see and quantify how their investments are improving value flow is a“eureka!” moment. Abandoning a “hit and hope” mentality, they’re applying a new business-oriented lens to the work theirdepartment does. They’re becoming “value stream thinkers.”The term “value stream” was born of the Lean movement to describe the material and information flow to create value. Avalue stream is the sequence of activities an organization undertakes to deliver on a customer need. Customers may beexternal (customer-facing value streams) or internal (value-enabling value streams)."If you can’t describe what you are doing as a value stream, you don’t know whatyou’re doing.”- Karen Martin and Mike rateReleaseReviewCodeManage GovernMeasureMonitorSupportValidateManageA value stream is the sequence of activities an organization undertakes to deliver on a customer request6 Karen Martin and Mike Osterling, Value Stream Mapping: How to Visualize Work and Align Leadership for OrganizationalTransformation (New York, NY: McGraw-Hill Education), Jan 2014Data-driven Value Stream Management5
Software delivery organizations have a value stream for each product, application or service. Value stream thinking puts thecustomer at the center, which helps transition IT organizations from an internal, project- and cost-centric focus to a productoperating model. That’s why value streams are foundational in both the Project to Product movement and enterprise agilityframeworks, like SAFe .Thinking in value streams enables you to zoom out of the technical details and take a macro look at business processesto identify strategic ways to improve them. Value stream thinkers ask: How can we provide greater and greater value toour customers—through innovation—while eliminating delays, improving quality and reducing cost, labor and employeefrustration?Here are some examples of product value streams:Industry6Product Value Streams ExamplesCustomerFinancial ServicesRegulatory Communications DeliveryExternalFinancial ServicesDevOps PipelineInternalHealthcareElectronic Records Management SystemExternalHealthcareActuarial ReportsInternalFinancial ServicesTrading PlatformInternalFinancial ServicesDigital Trading ChannelsExternalTelecomDigital RetailExternalTelecomSupply Chain LogisticsInternalPharma and HealthcareTelehealthExternalPharma and HealthcareClinical Support SystemInternalTasktop
I What Flows Through a Software DeliveryValue Stream?“Lean thinking starts not with the product, but with the value the customer pulls.”Dr. Mik Kersten, Project to Product7Value is something for which customers are willing to exchange an economic unit (time or money). The units of valuethat flow through the software value stream are called "flow items." All the work, across all the people and teams within avalue stream should be applied to the creation and, crucially, the protection of value.The simplest example of a flow item is a feature that delivers a new product capability, as customers will clearly pay for itif they need it or are delighted by it. Fixes for defects that impaired product usage is another clear example of a flow item.Meanwhile, risk and debt items focus on work that safeguards against security vulnerabilities and threats to current andfuture performance.Flow ItemsFlow ItemsDeliversPulled ByRisksDebtsExamplesNew business valueCustomersNew value added to drive abusiness result; visible to thecustomerFeatures, User stories,RequirementsQualityCustomersFixes for quality problems thataffect the customer experienceBugs, Problems, IncidentsSecurity, governance,complianceSecurity andrisk officersWork to address security, privacy Vulnerability fixes,and compliance exposuresRegulatory requirementsFeaturesDefectsDescriptionRemoval ofArchitectsimpediments to futuredeliveryImprovement of softwarearchitecture, operationalarchitecture or ways of workingTech debt, Upgrades,Process changeFrom Dr. Mik Kersten’s the Flow Framework and his bestselling book Project to ProductAn organization’s focus must be on prioritizing, optimizing and balancing the flow of theseitems across your software portfolio. For that, you need the right type of measurement.7 Dr. Mik Kersten, Project to Product: How to Survive and Thrive in the Age of Digital Disruption with The Flow Framework(OR, Portland: IT Revolution, 2018)Data-driven Value Stream Management7
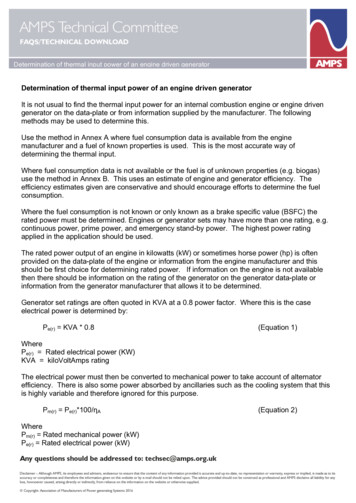
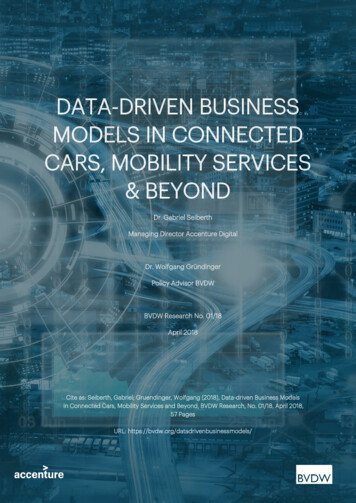
I How Do You Measure Intangible Work?“There is nothing so useless as doing efficiently that which should not be done at all.”― Peter F. Drucker8When you compare traditional lean manufacturing (such as car production) with software product development, thedistinct differences between the two processes—and how you measure them—quickly become clear.PRODUCT DEVELOPMENTWhile the software delivery process may seem linear and repeatable, in reality it’s an iterative creative process ofsoftware design with high variability, unique output and unpredictable economics. Work moves back and forth betweencontributors as it progresses through each phase, morphing, changing and converging in a highly complex process.For example, during the release process, additional testing is executed (security, static/dynamic analysis), and if issuesare found during that stage, work will go back to engineering. In another common example, while breaking down thefeature in the implementation process, a glaring omission in user experience (UX) is found, and work will go back tofeature design.8 Bob Hartman, “Peter Drucker understood agile leadership and agility before it event existed”, November 20168Tasktop
ReleaseTime to Value (End-to-End Flow Time)VALUE STREAM MANAGEMENTThis network of activity takes place in many best-of-breed and specialized tools that have grown through the Agile andDevOps movements. Yet IT leadership understandably struggles to make sense of all that complicated activity—to see itclearly and to extract insight from it for meaningful discussions with their business counterparts—because software deliveryis intangible work. It’s complex and highly-technical knowledge work lives in the spiralling network of specialized tools,often used by tens of thousands of IT practitioners. How do you improve what you can’t see?Previously, Lean practices like value stream mapping has helped management and teams to analyze the efficiency of theactivities that deliver customer value. The process allows them to map how work flows to better understand their currentand desired future state effort. Yet once-a-year value stream mapping exercises are a paper and pen affair that is detachedfrom the reality of continuously evolving software delivery work. And, the learnings don’t provide the real-time feedbackrequired to make rapid-fire decisions at an exec-level. Moreover, increased remote work adds to the complications ofarranging such a time and cost-intensive physical undertaking.Without this type of visibility, key questions are posed such as: How fast are you capable of delivering critical business capabilities? How do you know if you can potentially deliver 90% faster? How can technologists and business stakeholders get together to connect business strategy to software-driven digitalassets?The answer is mining the ground truth from the enterprise toolchains from ideation tooperation and knitting the data together to get actionable real-time visibility into the end-toend flow of work that creates and protects business value.Data-driven Value Stream Management9
I Flow Metrics: Measuring the Rate ofValue Delivery“Smart AD&D leaders know they can’t improve their processes without data. VSM givesthem the data they need to create baselines of current software delivery practices and set apath for improvement across each role of the AD&D organization.”- The Forrester Wave : Value Stream Management Solutions, Q3 2020Unlike discipline metrics that focus on activities in a specific area of the value stream (such as DevOps Research andAssessment (DORA)), VSM requires end-to-end metrics that levitate above all practices and processes to focus on the flowof business value. Discipline metrics that measure a specific silo are only meaningful if the silo itself is the bottleneck.While DORA’s four metrics—Lead Time (from code commit to deploy), Deployment Frequency, Mean Time To Restore(MTTR) and Change Failure Rate— have set the gold standard for operational efficiency for releasing new code, they are notsufficient on their own. While you must become more proficient at releasing code rapidly, securely and confidently, theyare now table stakes across the industry. Your organization will remain competitive only if it can deliver business value—notcode changes—at an ever-increasing clip.By the same token, we must all be cautious of only using Agile metrics like sprints completed, story points and t-shirt sizing,or the ceremonies and certifications associated with SAFe ; they only mean something if you can correlate such activitiesand processes with business outcomes. That’s why VSM metrics—known as Flow Metrics—are so significant. They measurethe rate of business value delivery for software products through the lens of your customers (whether internal or external)enable you to understand your current state.These outcome-based metrics abstract away details like team structure, technical architecture and tool implementationsto create a clear set of metrics that can be shared by both IT and business leaders. They hone in on business value, namelyhow much business value you are delivering today, and where you can invest your dollars and talent to deliver more valuefaster tomorrow.This common language around flow enhances collaboration between leadership to help them make critical businessdecisions around priorities and trade-offs. Instead of stories and intuition, dreams and hopes, leaders have access to thetruth of what is really going on. If a Line of Business wants that shiny new feature sooner, they will understand that it willcome at a cost. Future features may take longer, due to the accumulation of technical debt.10Tasktop
The Flow Framework presents the Flow Metrics and Flow Distribution to measure individual product value streams andproduct portfolios:Flow Metrics and Flow DistributionFlow VelocityIs value delivery accelerating?Flow EfficiencyIs waste decreasing in our processes?Flow TimeIs time-to-market getting shorter?Flow LoadAre we balancing demand vs. capacity to ensure future productivity?Flow DistributionAre we investing in both business value generation and business value protection?Data-driven Value Stream Management11
I Don’t Wait Months For Answers:Get Answers TodayThere may be some temptation to build your own Flow Metrics from a data lake, however, bear in mind that a homegrownapproach can take many months or years to produce, for the sheer effort of culling, normalizing, selecting and visualizingthe right data.Add to that the cost of data replication and storage, the expertise one must develop on each tool’s APIs and data schemas,the care you must take to prevent bad queries from impacting tool performance, and the break/fix work following everytool upgrade. Many enterprises have found that even after all that time and effort, they couldn’t use any of the data.Just as you would not build your own Enterprise Agile Planning tool — your own Atlassian Jira from scratch — you shouldnot be building your own Flow Metrics tool. You simple do not have time; your digital-savvy competitors already have theright data to continuously improve and pull further away from the pack. The cost of delay increases by the day.To be truly meaningful and impactful — and to drive true business agility — metrics must be retrieved fast and in real-time.As the Forrester Wave : Value Stream Management Solutions, Q3 2020 report recommends:"Provide useful and extensible OOTB metrics to create a system of visibility. AD&D leaders often need a crystal ball topredict software delivery dates and discern process trends, but that’s not good enough anymore. Look for VSM toolswith out-of-the-box (OOTB) metrics that inform leaders on velocity, capacity, types of work being processed, and work inprogress to enable leaders to create baselines and determine how well they are executing against plan."Consider this: if your competitorsalready have flow insights to helpthem innovate faster, can you reallyafford to wait?12Tasktop
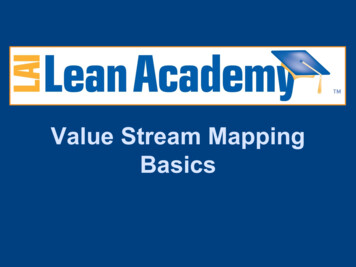
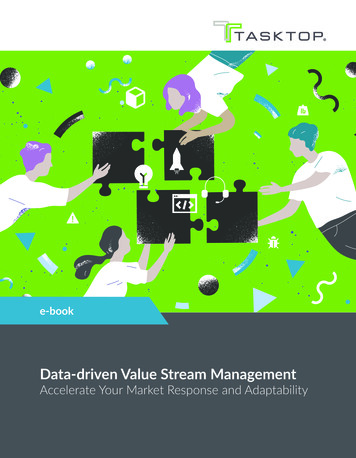
I Shifting Gears with Flow MetricsExposing the Outsourcing Black HoleUsing Flow Metrics, one wireless carrier was able to make strategic decisions onoutsourcing to change the way they were spending tens of millions of dollars withsuppliers.Using Flow Distribution, they were able to see a crippling lack of visibility into theproductivity of a managed service partner who carried out development and testingwork for the company. Reviewing the distribution of work over a three-monthperiod, it appeared like only defects were being delivered. Yet at the same time,Flow Load (a measure of work-in-progress) showed many, many features in flight.Where was the disconnect?The analysis confirmed what they had always suspected — but seeing is believing —that outsourced work was a black hole.The findings provided the catalyst to take action to resolve the issue. They adjusted the Jira implementation to bettercapture the flow of work through the value stream to highlight wait states impacting Flow Velocity.When Defects Aren’t Actually DefectsA small IT team at a leading U.S. healthcare company was facing a battle on twofronts. While the business was complaining that feature delivery was too slow,their developers were either drowning in unplanned work or blocked because theywere waiting on input or approval from the business.Experiment process changebegan between Sept and Oct.The company turned to Tasktop and Flow Metrics to better understand wherework was slowing down. They sought clear data visualizations to show leadershipand peers where investment was needed to go faster.FeaturesDefectsRisksFlow Distribution, Aug–Dec 2019DebtsDuring their flow analysis, they identified a key insight. Their Flow Distribution,which shows the ratio of business value creation work vs. business valueprotection in a given time period, showed high levels of defect work (shown inred on the graph). Nearly 70% of what this value stream delivered was defect andsupport work, with only 25% on features (in green).Further digging found that most of the tickets were not actually software defects, rather a misunderstanding of newcapabilities that could be resolved through conversations. However, this overhead was consuming a lot of team bandwidthand slowing down their ability to develop new business value-adding features.They created a simple experiment whereby they would unveil new features once every four weeks coupled with propertraining and communication. The result of this simple process change was that 95% of the tickets were eliminated,valuable development time was recovered and feature velocity improved significantly; instead of 80% defect work,Data-driven Value Stream Management13
they got 80% feature work. These results were shared with other product valuestreams who soon adopted the same release schedule to similarly favourableresults.The Hidden Costs of Tech DebtOne investment giant sought to improve time-to-market across its digital channelsto prevent a mass exodus of customers to startups and unicorns. The companyneeded to know which investments in people, process and technology would helpthem go faster. The IT teams also wanted clear data visualization to share withleadership and peers to advocate for those investments.By analyzing the Flow Time of their feature delivery across two product valuestreams (including one for web and mobile), they discovered that on average, astory (for a product feature) would take 22 days to complete — and in some cases up to 40 days, with work waiting in thevalue stream for up to 80% of that time. Tasktop Viz’s Bottleneck Finder showed that work was being held up betweendevelopment testing and QA testing.Further investigation found that all these stories were involved in the Core Backend Services project, implicating a legacycomponent that most operations and transactions (including those on digital channels) had to go through. Due to highvolumes of tech debt, Core Backend Services did not support self-service testing environments. Flow Distribution revealedthe extent of the neglected tech debt, indicating that it was likely a contributing factor to the high distribution of defect work.Product Managers were able to share the data with leadership to illustrate how their ability to compete was being crippledby the painful legacy component. Using the Flow Metrics data, they were able to make a strong case for investing inautomated testing for the next wave of digital channel features. In the immediate term, they were able to plan aroundthe constraint to shorten time-to-market for the new features by increasing the frequency of meetups between productmanagers, dev leaders and QA leaders to resolve conflicting priorities for the Core Backend Services team and ensure QAwas better prepared to test new capabilities.14Tasktop
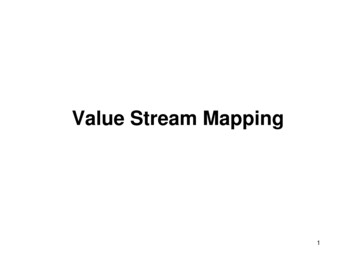
Hire More Business Analysts, Not Developers100% Efficiency? Doubtful.One of the knee-jerk, go-to-solutions for poor feature velocity is hiring moredevelopers. Yet a U.S. healthcare organization was able to use Flow Metrics tomake the data-driven case for hiring more business analysts instead of expandingthe development team.Initially, the Flow Efficiency metric for feature work was 100%. The interpretationof 100% for efficiency is that feature work is never blocked and never waiting —not once — as it makes it from ideation to operation. That was intuitively wrong.Flow Efficiency, Aug–Dec 2019This unrealistic reading was an alarm bell: It meant that this product value streamhad invisible wait states that weren’t currently being captured or measured.Without visibility into those wait states and where work was slowing down, theycould not identify how to go faster.The data made the case for adding additional states to the development tool to more accurately reflect workflow. Onceimplemented, the Flow Efficiency metric was adjusted to show lower efficiency, around 60%. The work was found to bewaiting for business analysts, not for developers. These findings were taken to the CIO, who immediately approved thehiring of additional business analysts, knowing that this would clear the impediment to faster feature delivery.15Tasktop
I Pure Play VSM: A New Way toAccelerate Market ResponseAccelerating time-to-market through software product value streams requires big data, analytics and integration capabilitiesfor which individual work management tools simply were not built. And while it’s feasible to build your own custom metricsand integrations, it’s nearly impossible to keep up with a living and breathing toolchain, supporting product portfolios thatare constantly evolving.In the Forrester Wave : Value Stream Management Solutions, Q3 2020 report, Chris Condo, the report’s author, makesa useful distinction between vendor offerings. Some vendors offer VSM bundled with their existing tools, which Chris callsan all-in-one approach. Other vendors offer stand-alone VSM solutions that integrate with an existing toolchain: Standalone VSM: The vendor provides a VSM solution that is independent of any stakeholder tool. The benefit here issupport for tool choice, heterogeneity and rapid time to value in deploying on existing toolchains. Integrated VSM: The vendor provides a VSM solution that builds on one or more of the stakeholder tools that theyprovide (e.g., an Agile development tool). The benefit here is tight integration with that stakeholder’s tools.From an ROI point of view, IT leaders should consider a pure play, standalone VSM platform that can sit on top of theexisting Agile and DevOps tools where the work gets done. By being decoupled from the tools, you benefit from rapidtime to value, as you don’t use the VSM platform for actual software development and delivery work (which could requirelengthy onboarding and training). Instead, your VSM tool can levitate about the end-to-end value stream to map andmeasure the flow across it.Data-driven Value Stream Management16
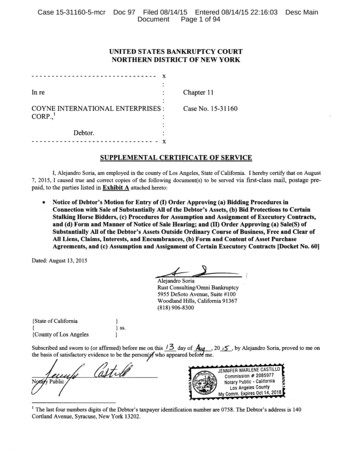
Pure Play with TasktopThe Tasktop Value Stream Management Platformplugs into your organization and sits on top of thetools you’ve chosen to get work done. With just afew clicks, it overlays the end-to-end value stream toprovide the abstractions, automations, visualizationsand diagnostics you need to practice value streammanagement on a daily basis.Tasktop gives you everything you need to align ITwith business goals. Our VSM platform helps withevery step, from connecting your teams to identifyingbottlenecks and course-correcting.Data-driven Analysis of Your Value Stream, Any Time, Any Place“Detached from rigorous analysis, intuition is a fickle and undependable guide — it is as likelyto lead to disaster as to success”-Eric Bonabeau, leading expert in complex systems and distributed adaptive problem solving10In an increasingly remote world, it's crucial to be able toeasily access and discuss Flow Metrics where ever you andyour team are. With access to this real-time objective datafrom tools like Tasktop Viz , you can kickstart impactfuldiscussions with your software delivery organization andbusiness counterparts to identify your bottlenecks and nextsteps.Whatever the issue, you can bring the right group of experts“into the room” to run a diagnosis and find a solutionto what’s slowing you down. No more theories, wishfulthinking or rolls of the dice; your teams have the truthto carry out data-driven investigation that will fix issuesfaster. And, crucially, help cultivate a stronger culture ofcollaboration and continuous learning between business andIT to supercharge your responsiveness and adaptability.Kick-start Your VSM JourneyContact us today for a VSM workshop to: Identify and measure value and protection in software productsAnalyze a baseline of software delivery performance using Flow MetricsPinpoint bottlenecks, reduce waste and improve velocity17Tasktop
About TasktopTasktop catalyzes the shift from Project to Product for globalenterprises and governments, enabling them to thrive in theAge of Software. Leveraging the Flow Framework to createcustomer-centric value streams and measure end-to-endbusiness outcomes, Tasktop’s products close the feedbackloop between the business and IT by automatically connectingtoolchains and accelerating the flow of business value acrossthe software product portfolio.Data-driven Value Stream Management18
The Buyer’s Guide for Value Stream Managementand Flow MetricsDiscoverMoreThe Forrester New Wave : Value StreamManagement Solutions, Q3 2020Project to Productby Dr. Mik Kersten 2007-2020 Tasktop Technologies Incorporated. All rights reserved. Tasktop and the “Less is More” logo ( ) are registered trademarks of Tasktop Technologies, Inc. Allother trademarks are the property of their respective owners. TSWP-10.2019Tasktop
Amazon Web Services. 1. 1. Cloud for CEOs: Measure Innovation with one metric, AWS executive insights, Adrian Cockroft . Value stream thinkers ask: How can we provide greater and greater value to . . Yet once-a-year value stream mapping exercises are a paper and pen affair that is detach