Transcription
International Journal of Engineering Research & Technology (IJERT)Process Improvement by using Value Stream Mapping:A Case Study in Small Scale IndustryISSN: 2278-0181Vol. 1 Issue 5, July - 2012Mr. Rahul.R.Joshi1, Prof.G.R.Naik21PG. Student,Department of Production Engineering,KIT’s College of Engineering,KolhapurShivaji t of Production Engineering, KIT’s College of Engineering,KolhapurShivaji University,Kolhapur(India)Abstract“Process improvement” means making things better. However,when we engage in true process improvement, we seek to learnwhat causes things to happen in a process and to use thisknowledge to reduce variation, remove activities that contributeno value to the product or service produced, and improvecustomer satisfaction. Process Improvement means examine allof the factors affecting the process: the materials used in theprocess, the methods and machines used to transform thematerials into a product or service, and the people who performthe work.Lean Production Starts from the argument that addingvalue and reducing waste are the key goals of any business. Butfor many stills, the teething pains of change and a steep climbare too much bear and Sustain. Organization may contain with anumber of a weak points in it which makes them difficult toachieve the promised gains for the efforts they put in it. Valuestream mapping (VSM) is a lean manufacturing technique and ithas emerged as the preferred way to support and implement thelean approach. Value stream mapping is different thanconventional recording techniques, as it captures theinformation at individual stations about station cycle time,uptime or utilization of resources, setup time, WIP inventory,manpower requirement and the information flow from rawmaterial to finish goods. This Paper details the use of the valuestream mapping in reducing waste in manufacturingCompany.With a Case study in a one of the Die manufacturingindustry, the production process path is visualized by mappingthe current state value stream map. After tracking the entireprocess, wastage affecting the cycle time are identified and itscauses analyzed. A Future state value stream map is developedand improvement ideas are suggested. With the suggestedimprovement ideas the cycle time is expected to be shorten from14400 minutes to 9600 minutes, representing 30% reduction.Value Stream mapping is proved as a useful technique tominimize the cycle time and increase the Production.Keywords: - Value stream mapping, cycle time, ProductionProcess, wastages, bottleneck Operation.“1.Introduction”A process is no more than the steps and decisions involved in theway work is accomplished. Even without Changing the processflow, speed can be injected into the system doing the away withthe costs of waiting, and the resulting confusion by simplystreamlining and debottlenecking the flow by reorganizing theflow of work. The current business environment has placed anincreased focus on operational efficiencies while maintaining ahigh level of quality and innovation excellence.(1).Withmanufacturing becoming a more and more competitive market,companies globally strive to increase their efficiency. ValueStream mapping technique involves flowcharting the steps,activities, material flows, communications, and other processelements that are involved with a process or transformation.Companies are experiencing intense competitive pressure due toglobalization hence they cannot afford to operate with waste intheir processes.(3). A value stream is all the actions (value-addedand non-value added) required to take aproduct from rawmaterial to the customer, the design flow from concept tocompletion.(2). Value-added activities are considered the actionsand theprocess elements that accomplish those transformationsand add value to the productfrom the perspective of the customer(e. g., tubing, stamping, welding, painting, etc.).Non-valueadded activities are the process elements that do not add value totheproduct from the perspective of the customer such as settingup, waiting for materials,and moving materials.“2.Case Study”“2.1 Problem statement”Few of the small scale units graduate in to a middle scaleindustry with a variety of functions and activities closely knitinto organizational network following a set of objectives.Although lean manufacturing is becoming a popular techniquefor Productivity Improvement. The case study is carried out in asmall scale industry namely Ablepvt.Technology ltd. to achievecertain tangible and intangible benefits. If the shop floor is thewell spring of Competence, it is also a den of vice and waste isits king. To promote the use of lean manufacturing within thecompany is the challenge. Its focuses on the addressingidentified manufacturing Problems through the application ofselected lean tools. The Problem approach is that the lean toolswhich are applied are drawn exclusively from those which havebeen found to be successful in a Able pvt. Technology ltd. Theentire process from raw material entry to customer is studied.While studying the entire process from different departments itis clear that tool room consists of a Problem. Tool Room formanufacturing the Sheet Metal Dies is piled up with jobs andthis has been consistently noted for the past few monthsregularly. Even after working for a more time rather than shiftwww.ijert.org1
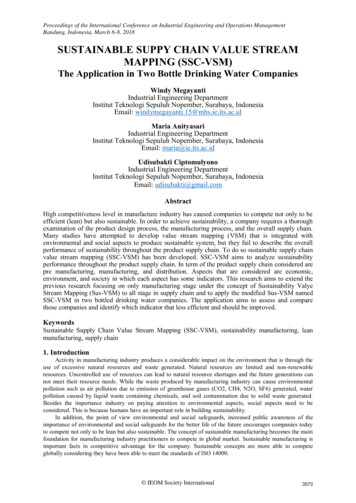
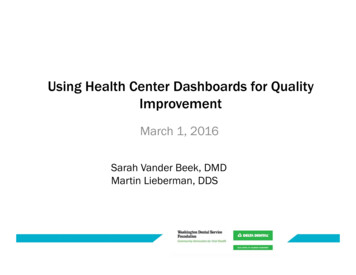
International Journal of Engineering Research & Technology (IJERT)time, the assignment doesn’t seem to cease. Due to theovertimethe manpower requirement has been rising along withadditional inventory for tools and other equipments. The cycletime required to complete is high and it is 14400 minutes. Thework-place seems cluttered with work all over the workingarea.Therefore, there is enough scope for streamlining anddebottlenecking the process flow. The aim is to reduce the cycletime and improve the process. .ISSN: 2278-0181Vol. 1 Issue 5, July - 2012“2.2 Methodology Adopted”Main objective is to achieve cycle time reduction by employingthe following steps:Step I)To draw a Current State Map by using followingsubsteps:Substep I)Identification and Drawing the Product flow from theraw material entry point of the Manufacturing division (MFD) tothe finished goods exit point of the MFD.Substep II) Calculating the number of Work in Process (WIP)for each component at each work cell.Substep III)Calculating the cycle time and utilization percentageof each process.Substep IV)Plotting the current State Map that is essentially aSnapshot capturing how things are currently being done.Step II) Create a Future State Map, Which is a Picture of howsystem should look after the inefficiencies in it have beenremoved.“2.3 Current State Map”Data Collecting Method:Method that will be used in collecting data needed is observationto theactivities that performed in the production shop floor. Wegown throughthe manufacturing facility and identified eachoperation process involved from rawmaterials to finished goods,identified all the places where inventory is storedbetween theprocesses, and observed how the material flows from oneoperation toanother.Statistical data collection methods formeasuring machine setup time were used in this study tosummaries and describe the data. Production process flow andstandard operation procedure are reviewed briefly before settingup the data collection table is done. The data was collected byusing a stopwatch. Based on the actual production, data wascollected and recorded on a daily basis. The data was collectedfor 40 days and subsequently, a statistical bar chart was drawn tomonitor and analyse the problems. These methods helps toidentify the main contributor to high time loss and help tovisualize and better understand the root causes and findingpossible solutions to the problems.“2.4 Analysis of a Current State Map”Sr.NoLead Time01Company to CustomerCycle Time(in Weeks)14“Figure I.CVSM of Supplier to ocess PlanningTool RoomSubAssemblyInspectionPaintingDispatchTotal DaysCycle 3%14.24%07.14%04.08%07.14%The following graph shows the cycle timedepartments.in days forGraph of Cycle Times of Department5042403020101014147470From The Graph it is clear that the Cycle time required for toolroom is 42 days which is Highest. The Tool room consists offollowing Components. All the Components are made parallel toeach other. The following table shows the Components withTheir Cycle time in days.www.ijert.org2
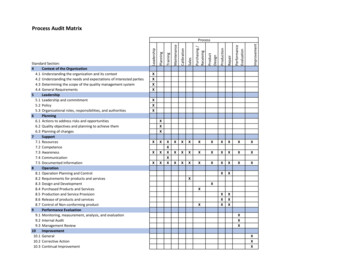
International Journal of Engineering Research & Technology ie SetDie BlockPunch PlateDie StopperPunch Stripper PlatePunchesISSN: 2278-0181Vol. 1 Issue 5, July - 2012Cycle Time(days)20300905150730 BottleneckComponent2015975Die SetDie While reviewing the entire process in a tool room for a diemanufacturing, a die block acts as an a Bottleneck Componentwhich causes the sheet metal die to pile up with the jobs. Theentire operations for making a single die block was studiedwhich takesan 30 days to complete itValue Stream Mapping Data Set:Customer Order50 per monthWorking Hoursone shift 8 hours(per day)Lunch Break45min(per day)Raw Materials.PurchaseEvery 15 daysThe Figure II of Current State map of a Particular single dieblock with value stream mapping Symbols is Follows:-“Figure II:- Current State map for Die Block”The following table Shows the operations performed on dieblock, with Their Cycle time in days, WIP, machine Utilization.Sr.NoOperations onDie Block010203Rough 58070401920480081075701.Cycle Time Reduction(C/T):The periodrequired to complete one cycle of an operation; or tocomplete a function, job, or task from start to finish. Cycle timeis used in differentiating total duration of a process from its runtime.2.Work-in-process inventory(WIP)Work-in-process inventory is inventory that has been partiallyconverted through the production process, but for whichadditional work must be completed before it can be recorded asfinished goods inventory. The partially finished goods that areheld in inventory for completion and eventual sale.3.Machine Utilization:Machine utilization computed as a percentage of the availablehours (Number of the machines available for productionmultiplied by the number of working hours), The percentage oftime that a machine is actually in use.www.ijert.org3
International Journal of Engineering Research & Technology (IJERT)The Following Graph Shows the Cycle time ,WIP, MachineUtilization. Combine with operation.C/TWIPM/C%80757070409605Rough Cut38409152880Machining Heat Treatment19208Grinding480010Wirecut“3.Proposal for the Future State Value StreamMapping”Having Visualized the Current State Map of a die block, identifiedthe Wastages and associated Problems, some of the necessaryChanges in the value Stream of die block were outlined in the draftof the future state map.Production Processes:1.Rough Cut2.Machining3.Heat Treatment4.Grinding5.Wirecut“3.1Identification of Wastes in each operation ofdie block”I) Rough cut:1. excess stock casuing more time to do rough cuttingII) Machining1) Delay in latest (revised/updated) model/drawing to reach themanufacturing cell2) Inappropriate format of 3D model for CAM software3) Absence of expertise for creating CAM program4) No provision of standard library for reference to verifycompatibility of formats/ programs/ codes of CAM program visa-vis controls on the Machining Centre'.5) Delay in creating machining program due to insufficientmemory/ RAM of the desktop computer6) Incompatible interface of CAM program with m/c interface7) Inadequate operator skills for interfacing CAM program withm/c8) Table size insufficient for the stock and the program. This islargely due to incoherent/ redundant data shared to DesignEngineer by Tool Room9) Tools selected in the CAM program not available in ToolRoom/ Tool Stores10) Gouging/ fouling with stock observed during the verification' at Tool Room2278-018111) Inefficiency in machining operation since programISSN:createdto1 Issue 5, July - 2012remove too little stock removal in the rough cutVol.operation12) Unnecessary tool change introduced by the CAMprogrammerinthemachiningprogram13) hard spots observed in the stock during machining14) Pencil tracing/ Finish cut improperly introduced in theprogram15) Frequent tool breakage for tools with longer length andlesserdiameter(lessthan4mm)16) Delay in removal of finished stock from the machine17) Breakdown of machines- no preventive maintenance18) More MTTR- No identification of critical spares andinventory19) Low speed/ feeds or changes in process parameters due tocutting tools not standardized and cutting tools inventory notmaintained20) Absentism of operators- No substitutes identified- operatorskill matrix not made (improper)III) Heat treatment:1. Loading for furnace not planned- there is either no loadat furnace or excess load suddenly coming up.Machining and Heat treatment not synchronized.2. Daily power cut off- no back up available resulting intoreheattreatment of parts after power comes back.IV) grinding:1. Minimum stock removal not planned- there are morestocks which can be optimised2. only one gridning machine availble3. machine is too old and frequently undergo maintenanceV) wire cut:1. Electrodes are outsourced- dependent only on onevendor.2. electordes sourcing is not planned/ synchronised withrequirement.3. only one wire cut is available- looking for anothermachine or source non critical wire cutting fromoutside.Classification of Wastages into Standards forms and Techniqueto Elimination of Wastage:-www.ijert.orgOperationsWastageRough Cutexcessstockcasuingmoretime todo roughcutting1) Delayin latest(revised/updated)model/drg toreach echnique ofEliminationDFM- Design formanufacturingJob descriptionand role &responsibility,HRselection processtraining4
International Journal of Engineering Research & Technology (IJERT)Machininguring cell2)unsuited formatof 3Dmodelfor CAMsoftwareMachiningErrorsDesign andprocess enceofexpertiseforcreatingCAMprogram4) Noprovisionofstandardlibraryforreferenceto verifycompatibility offormats/programs/ codesof CAMprogramvis-a-viscontrolson the MachiningCentre'.5) Delayincreatingmachiningprogramdue toinsufficientmemory/RAM chiningTechnique ofEliminationJob descriptionand role &responsibility,HRselection processtrainingMachiningErrorsData managementMachiningWaitingDesign andprocess einterfaceof CAMprogramwith m/cinterface7)Inadequateoperatorskills forinterfacing CAMprogramwith m/c8) Tablesizeinsufficient for thestock andtheprogram.This islargelydue toincoherent/redundant datashared toDesignEngineerby ToolRoom9) Toolsselectedin theCAMprogramnotavailablein duringtheverification' atToolRoom11)ErrorsDesign and ISSN: 2278-0181Vol.review1 Issue 5, July - 2012processUnderutilizedPeopleJob descriptionand role &responsibility,HRselection processtrainingUnderutilizedPeopleJob descriptionand role &responsibility,HRselection processtrainingWaitingMRP- Materialresource planning,inventory control,5SUnderutilizedPeopleJob descriptionand role &responsibility,HRselection processtrainingUnderutilJob description5
International Journal of Engineering Research & Technology (IJERT)Inefficiency inmachiningoperationsinceprogramcreatedtoremovetoo littlestockremovalin therough cutoperationizedPeople12)Unnecessary toolchangeintroduced by theCAMprogrammer 3) Hardspotsobservedin thestockduringmmachiningDefectsincoming qualitycontrol, supplierselection lyintroduced in theprogramerrorsDesign andprocess review15)Frequenttoolbreakagefor toolswithlongerlengthErrorsMachiningand role &responsibility,HRselection processtrainingMachiningMachiningJob descriptionand role &responsibility,HRselection gDesign andprocess reviewwww.ijert.organdlesserdiameter(less than4mm)16)Delay inremovaloffinishedstockfrom themachine17) Breakdown ofmachines- nopreventivemaintenance18) MoreMTTRNoidentification ofcriticalsparesandinventory19)Lowspeed/feeds orchangesinprocessparameters due tocuttingtools 0) Absentism ofoperators- NosubstitutesidentifiedoperatorskillISSN: 2278-0181Vol. 1 Issue 5, July - ceErrorsStandard gency Planning6
International Journal of Engineering Research & Technology de(improper)1.L Waitingoadingforfurnacenotplannedthere iseither noload atfurnaceorexcessloadsuddenlycomingup.machining andHT notsynchronized.2. toreheattreatment ofpartsafterpowercomesback.1. Minim Errorsumstockremoval notplannedtherearemorestockswhichcan beoptimiISSN: 2278-0181Vol. 1 Issue 5, July - 2012sedGrindingProduction plan/ line balancing,visual managementGrindingWire CutContingencyplanningWire CutWire CutDFM- Design itingLine balancing,CPM/PERT3.machine is tooold andfrequentlyundergomaintenance1.Electrodes areoutsourceddependentonly ononevendor.2.electordessourcing is ysis ofbreakdownmaintence andactions thereafter,strategic plan,DepreciationanalysisUnderutilizedPeopleJob descriptionand role &responsibility, HRselection processtraining3.onlyone wirecut isavailable- look foranothermachineor sourcenoncriticalwirecuttingfromoutsideWaitingMake or buydecision, sourcingstartegy, capacityassessment at subsupplierWaitingMake or buydecision, sourcingstartegy, capacityassessment at subsupplier“4. Methodology Eliminiate the Techniques”1.DFM- Design for manufacturing1.Identify all dimensions by sr no, 1,2,3 .2) identify the dimensions which are having machining3) calculate the stock removalwww.ijert.org7
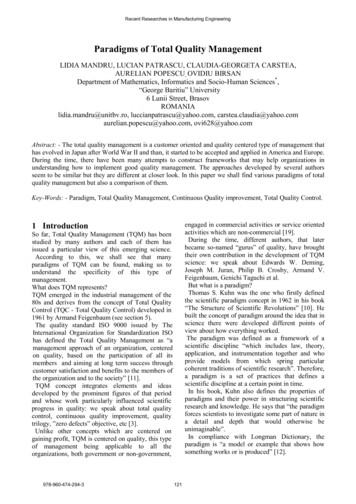
International Journal of Engineering Research & Technology (IJERT)4) Highlight all those dimensions which has excess stock( 5mm)5) modify the drawing to reduce the excess stock.2.Preventive maintenance1) identify all machines with sr no.2) prepare the master list of machines3) identify the areas of preventive maintenance4) Capture past history associated with each machine andinclude those points in preventive maintenance5) prepare the detailed work instructions for each point ofpreventive maintenance6) prepare themaintenance schedule based on therecommendation3.MRP- Material resource planning1) capture past history of spares utlilised for each machine2) discuss with machine manufacturer and identify the criticalspares3) have agreement with them @ which spares he will maintainand which one not4) include all such spares in the master list5) identify the lead time for each spare6) based on the history of consumption, identify the reorder level7) Review and Update the data on daily basis4.Standard work:It is basically a very specific instruction given tooperator to follow on daily basis. Operators should be able toread the standard work and identify the next steps whereverissue comes.5.MRP- Material resource planning, KANBAN, VisualmanagementFor visual management, we can put the board showing clearlythe status of the inventory or we can use the board with the tagsshowing the status of the inventory6.Skill matrix, and contingency planningSkill matrix:1) Line manager should identify the operations performed by alloperators2) each operator is judged by his immediate supervisor for theskill level for each identified operations. Sometime written/ oralexam is also helpful3) Thejudgment is divided into 4 categories- No skill, trained,can work but with supervision, can work independently and cansupervise others.4) this matrix helps the line supervisor to nominate the otherperson based on the skill in case one person is absent.7.Contingency planning: based on the above mentioned skillmatrix, identify the critical operations which requires more skilland plan the shift in such way that alternate person will alwaysbe there to support in case the other person is absent.8.Production plan/ line balancing, visual managementProduction plan: shows the parts which will undergo Furnace forthe month. Based on the cycle time for each part, define theloading cycle. Dispay a big board near furnace which shows thestatus of each planned part9.Contingency planning2278-0181Identify the areas which affects on the production e.g. ISSN:naturalVol. 1 Issue5, July - 2012calamities, critical machine breakdown, strike, powerfailuresetc. for the identified issue, the tool room can plan for gen set orelse hav an agreement with MSEB so that they will get advancenotification before power goes off so that better planning ispossible.10. Make or buy decision, sourcing strategy, capacityassessment at sub supplier:Electrode making in house is not viable since it requires EDMand special manpower and hence it is decided to outsource only.But now we have anlaysed the overall capacity available atsupplier by using the simple formula available minuts/ daycommitted time . This has triggered us that the supplier isalready overloaded and hence we have decided to go for anothersource as backup. Also as a strategy, now capacity assessment ismade mandatory for any outsourced parts.11.Job description and role & responsibility,HR selectionprocess trainingDefined clear job description for the purchase person and reexamined all persons. We found 2 person especially who weretaking care of electrodes sourcing were not having sufficientknwoledge of the supplier selection. Hence training has beenorganized for them by senior member within the function. AlsoJob descriptions for each category clearly made and being usedby HR while selection of the candidate.12.Design and process review:As a part of initial feasibility review, we have added a step ofcomparison of 3D model with CAM program and correctionseither in model or program based on the requirement.By adopting the above methodology,the propose Figure of aFuture value State Mapping can be prepared as below:-www.ijert.org“Figure III:- Future State map for Die Block”8
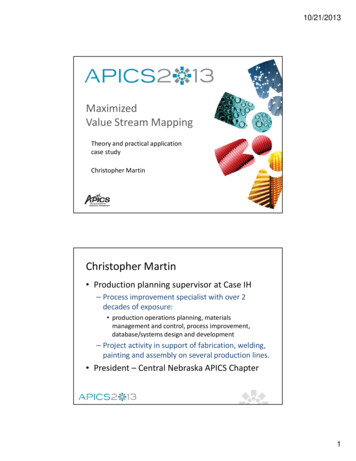
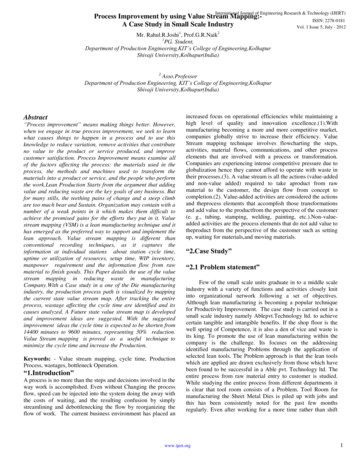
International Journal of Engineering Research & Technology (IJERT)ISSN: 2278-0181Vol. 1 Issue 5, July - 2012Comparsion between CVSM andFVSM for WIPThe Future State Shows the Following Results:Sr.Operations on CycleWIPMachineNoDie BlockTimeUtilization(min)(%)01Rough 7856WIP(CVSM)WIP(FVSM)“5. Comparison of Current State Map and FutureState Map for Die Block”Comparsion between CVSM andFVSM for C/T in minutes.6000500040003000200010000Comparsion Between CVSM and FVSM for M/CUtilization4800384024009080 803360288019207019201200960 720758070 706570606045504040CVSMM/C % Utilization(CVSM)30FVSMM/C % Utilization(FVSM)20100Rough Cut MachiningSr.No0102030405Operations recutCycle t was observed that, due to enormous potential in the leanmanufacturing tools, value stream mapping study was carriedout in a small scaleindustry. By creating current state valuestream map, the non-value added activities in the productionprocess are visualized and identified. A future state value streammap is created with the waste activities eliminated. With thefuture state value stream map, the production cycle time of dieblock is significantly shortened from 14400 minutes to 9600minutesrepresenting a 30% reduction. Value stream mapping isproved as a useful technique to shorten delivery time and reduceproduction costswww.ijert.org9
International Journal of Engineering Research & Technology (IJERT)“5.1 Comparison of processing lead time SSN: 2278-0181Mappingtool to achieve effectiveness by using efficientlytheVol.time.1 Issue 5, July - 2012process improvement Strategy to shorten the cycle14400“7.References”9600CVSM[1] William M. Goriwondo&AlphonceMarecha, “Use of theValue Stream Mapping Tool for Waste Reduction inManufacturing: Case Study”,Proceedings of InternationalConference on Industrial Engineering and OperationManagement(2011)pp 236-241.[2]Fawaz A. Abdulmalek&JayantRajgopal“ Analyzing thebenefits of lean manufacturing and value stream mapping viasimulation: A Process Sector case study”,International journal ofProduction economics(2007) 107:pp223-226.FVSM[3]John Fargher “Lean manufacturing Implementation tools”“6.Conclusion”On the Shop floor time is money. On the shop floor need iselimination of wastages and delays. It is helps in mapping theprocess it manifests itself as the objective of designing a processfor which manufacturing is a low cost process. Value Streammapping helps the in attaining higher usage levels by theproficiency of shop floor practices aimed at increased humanand machine productivity and thus improving the process.Approach is only that do just what you are doing -do it quickerand by extension, cheaper. The goal of it is to identify,demonstrate and decrease activities that add no value to the finalproduct. Value stream mapping, primarily a communication tool,but also is used tool as a strategic planning tool, is a kind oftechnique that helps to understand and streamline productionprocesses. By applying the Value Stream mapping tool in a diemanufacturing industry, a current state map is developed. Afuture state value stream map is created by eliminating non valueadded activities.The future state value stream shows markedimprovement in the process and the cycle time for production ofmaking die block is reduced from 14400 minutes to 9600minutes resulting in improvement of 30% in cycle time. A casestudy discussed outlines importance ofValue Stream[4]Lixia Chen & BoMeng, “The Application of Value StreamMapping Based Lean Production System”,InternationalJornal ofBusiness and Management(2010)Vol.5 pp203-208[5]V.Ramesh&T.R.Shrinivas “Implementation of a Lean Modelfor carrying out Value Stream Mapping in a ManufacturingIndustry”, Journal of Industrial and systems Engineering(2008)Vol 2 pp 180-196[6]Guo-qiang PAN & Mei-xian JIANG “ Application Researchof Shortening Delivery Time Through Value Stream MappingAnalysis”,IEEE(2010) pp 733-736[7] Bhim Singh & Suresh Garg“ Value Stream dustry”,International Journal of Advance ManufacturingTechonology(2011)pp 799-809[8] Handbook for Basic Process Improvementwww.ijert.org10
Value Stream mapping is proved as a useful technique to minimize the cycle time and increase the Production. Keywords: - Value stream mapping, cycle time, Production Process, wastages, bottleneck Operation. “1.Introduction” A process is no more than the step