Transcription
Proceedings of the International Conference on Industrial Engineering and Operations ManagementBandung, Indonesia, March 6-8, 2018SUSTAINABLE SUPPY CHAIN VALUE STREAMMAPPING (SSC-VSM)The Application in Two Bottle Drinking Water CompaniesWindy MegayantiIndustrial Engineering DepartmentInstitut Teknologi Sepuluh Nopember, Surabaya, IndonesiaEmail: windymegayanti.15@mhs.ie.its.ac.idMaria AnityasariIndustrial Engineering DepartmentInstitut Teknologi Sepuluh Nopember, Surabaya, IndonesiaEmail: maria@ie.its.ac.idUdisubakti CiptomulyonoIndustrial Engineering DepartmentInstitut Teknologi Sepuluh Nopember, Surabaya, IndonesiaEmail: udisubakti@gmail.comAbstractHigh competitiveness level in manufacture industry has caused companies to compete not only to beefficient (lean) but also sustainable. In order to achieve sustainability, a company requires a thoroughexamination of the product design process, the manufacturing process, and the overall supply chain.Many studies have attempted to develop value stream mapping (VSM) that is integrated withenvironmental and social aspects to produce sustainable system, but they fail to describe the overallperformance of sustainability throughout the product supply chain. To do so sustainable supply chainvalue stream mapping (SSC-VSM) has been developed. SSC-VSM aims to analyze sustainabilityperformance throughout the product supply chain. In term of the product supply chain considered arepre manufacturing, manufacturing, and distribution. Aspects that are considered are economic,environment, and society in which each aspect has some indicators. This research aims to extend theprevious research focusing on only manufacturing stage under the concept of Sustainability ValyeStream Mapping (Sus-VSM) to all stage in supply chain and to apply the modified Sus-VSM namedSSC-VSM in two bottled drinking water companies. The application aims to assess and comparethose companies and identify which indicator that less efficient and should be improved.KeywordsSustainable Supply Chain Value Stream Mapping (SSC-VSM), sustainability manufacturing, leanmanufacturing, supply chain1. IntroductionActivity in manufacturing industry produces a considerable impact on the environment that is through theuse of excessive natural resources and waste generated. Natural resources are limited and non-renewableresources. Uncontrolled use of resources can lead to natural resource shortages and the future generations cannot meet their resource needs. While the waste produced by manufacturing industry can cause environmentalpollution such as air pollution due to emission of greenhouse gases (CO2, CH4, N2O, SF6) generated, waterpollution caused by liquid waste containing chemicals, and soil contamination due to solid waste generated.Besides the importance industry on paying attention to environmental aspects, social aspects need to beconsidered. This is because humans have an important role in building sustainability.In addition, the point of view environmental and social safeguards, increased public awareness of theimportance of environmental and social safeguards for the better life of the future encourages companies todayto compete not only to be lean but also sustainable. The concept of sustainable manufacturing becomes the mainfoundation for manufacturing industry practitioners to compete in global market. Sustainable manufacturing isimportant facts in competitive advantage for the company. Sustainable concepts are more able to competeglobally considering they have been able to meet the standards of ISO 14000. IEOM Society International3573
Proceedings of the International Conference on Industrial Engineering and Operations ManagementBandung, Indonesia, March 6-8, 2018At the beginning of 1940 the concept of lean manufacturing become a new paradigm that is considered tohave many benefits in its application. Lean manufacturing focuses on seing efficient in economic aspect thataims to improve the system continuously to eliminate waste in the manufacturing system, thus reducingproduction costs and accelerating products received by consumers. But nowadays the paradigm evolves towardsthe concept of sustainability that is focus on triple bottom line which not only focus on economy but alsoconsider environmental and social aspects. This is due to the economic benefits that are not able to guarantee thesustainability of the next life, therefore the paradigm shifts towards sustainable manufacturing. Sustainablemanufacturing is defined by the United Stated Department of commerce (2010)"As the creation of manufactured products that use processes that minimize negative environmentalimpacts, conserves energy and natural resources, are safe for employee, communities, and consumer and areeconomically sound" (US DOC, 2010).Faulkner & Badurdeen (2014) mention that sustainable manufacturing is important. It includes the use ofsustainable processes and systems to produce more sustainable products. In addition, achievement of sustainablemanufacturing requires a thorough examination of the product design process, manufacturing process, andoverall supply chain (Faulkner & Badurdeen 2014; Brown et al. 2014). According to the explanation it can beseen that sustainable manufacturing becomes an important thing to note now in every process associated withthe product.2. Previous Research & Modifications2.1 Sustainability Integration with Value Stream MappingCurrently lean manufacturing has been widely used to develop a strategy towards green and sustainablemanufacturing (Faulkner & Badurdeen 2014). One method of visualizing the production process with the leanprinciple is value stream mapping (VSM). VSM was introduced by Rother and Shook in 1999. VSM is amethod that has been accepted and used by many practitioners to improve production systems using leanprinciples. VSM aims to identify and visualize waste in manufacturing processes where the main objective is toknow lean oriented production practices and develop plans to improve future performance (Brown et al., 2014).VSM will describe all activities along the production line and will divide the activity as a value added or nonvalue added activity. In its application the VSM focus on manufacturing stage and does not directly consider theperformance of environmental. Many researchers have developed value stream mapping by consideringenvironmental and social aspects.Research conducted by Torres & Gati (2009) tried to develop environmental value stream mapping. That isdeveloping methodology to map environmental aspect in VSM. The environmental aspect to consider is the useof water. Kuriger & Chen research (2010) develops energy and environmental value stream mappingmethodologies. Aspects to be considered in this research are the time (waste) and environmental aspects whichconsist of measurement of energy and material consumption. Verma & Shrama (2016) develops green EnergyVSM (EVSM), aspects considered in this study are time and energy consumption. Faulkner & Badurdeen (2014)developed a sustainable value stream mapping (Sus-VSM) methodology in the satellite dish industry. In thisresearch social aspect started to be involved in VSM. Environmental aspects to consider are time (waste),energy, materials, and water. All of the mentioned studies have considered economic, environmental, and socialaspects of VSM with a focus on the manufacturing stage. Whereas Marimin et al (2014) conducted a research onvalue chain analysis of natural rubber supply chain and the main focus is not only in the manufacturing stage butthe pre-manufacturing stage. The processes considered by Marimin et al (2014) are natural rubber cultivation(pre manufactur) and ribbed smoke sheet production (manufactur). Indicators to consider are the consumption ofenergy, material, water, garbage, transportation distance, and emissions. In addition, Simons & Mason (2002)has introduced lean and green in the distribution stage, in this study CO2 emissions are considered thoroughly atthe distribution stage starting from packaging manufacturing to retailers and home. Suarez-Barazza, et al (2016)has developed supply chain value stream mapping (SC-VSM) but focuses on volume and on time delivery(OTD) indicator from supplier to manufacturer and from manufacturer to consumer. Simons & Mason (2003)mentioned that it is necessary to understand further how the impact of the process of procurement anddistribution of products on sustainability issues. Therefore, from various literatures it is found that there is anopportunity to develop the use of value stream mapping as a tool for mapping and analyzing the level ofsustainability in the supply chain products from preparation stage (pre manufacturing), manufacturing, untilproduct distribution process to consumers by considering economic, environmental, and social aspects.2.2 Sustainable Supply Chain Value Stream Mapping (SSC-VSM)Currently companies not only need to increase profit in the delivery process, but also necessary carryout business in good manner and think about the environmental and social impacts of all activities (Simons &Mason, 2003). To assist the company in evaluating all business activities on the environmental and socialimpacts SSC-VSM is developed. SSC-VSM integrates the conventional VSM that has been widely used by IEOM Society International3574
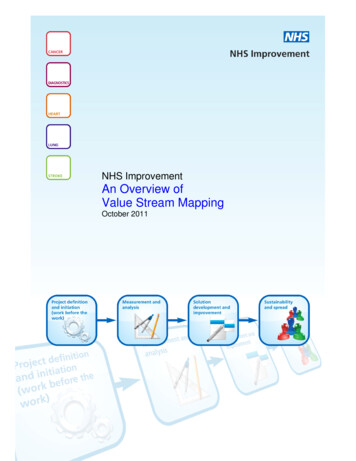
Proceedings of the International Conference on Industrial Engineering and Operations ManagementBandung, Indonesia, March 6-8, 2018users in identifying waste with triple bottom line. SSC-VSM aims to facilitate the user (company) in identifyingall activities undertaken by the company starting from the preparation activities of raw materials (premanufacturing), manufacturing process (manufacturing), and distribution by considering the triple bottom line(economic, environment, social). Pre manufacturing is preparation activity of raw materials starting from theprocess of ordering materials from suppliers to materials ready for use on the production floor. Manufacturing isa production activity that turns material into a product of value. Distribution is a product delivery activity fromthe production floor to the distributor / retailer / consumer. In each aspect have several indicators. This indicatoris selected based on suggested indicators in references, a selection process through interview with water bottlecompanies were conducted and obtained the following indicators:Table 1. Selected Indicator for SSC-VSMAspectsEconomicIndicatorLead TimePre ManufacturMarimin et al (2014)EnvironmentalQualityVolume and On TimeDelivery (OTD)Material ConsumptionSuarez-Barazza, et al(2016)Marimin et al (2014)Water ConsumptionMarimin et al (2014)Energy ConsumptionMarimin et al (2014)EmissionMarimin et al (2014)Waste ManagementHealthSafetyMarimin et al (2014)Jayal et al (2010)Jayal et al (2010)SocietyManufacturRother & Shook (1999), Mariminet al (2014),Kuriger & Chen (2010)Li et al (2012)Haefner et al (2014)Faulkner & Badurdeen (2014),Marimin et al (2014),Kuriger & Chen (2010)Faulkner & Badurdeen (2014),Marimin et al (2014),Torres & Gati (2009),Faulkner & Badurdeen (2014),Marimin et al (2014),Kuriger & Chen (2010)Faulkner & Badurdeen (2014),Marimin et al (2014),Li et al (2012)Marimin et al (2014)Jayal et al (2010)Jayal et al (2010)Distribution-Suarez-Barazza, et al(2016)Simons Mason (2002)-Currently distribution is measured by emission (Simon & Mason, 2002). However since supply chainbecomes important issue and identified as on of the main burdens for manufacturer, thus including economicaspect in the distribution measure is necessary. In this research distribution stage will be measured in someindicator in each aspect. The indicators considered in the economic aspects of the distribution stage are time andquality, on the environmental aspects are material consumption, water, energy, emissions, and wastemanagement, on the social aspect are health and safety. The definitions and modified measurements of eachindicator at each stage are as follows:A. Economic Indicators1. Lead Time: As described in the previous section, lean is a philosophy for minimizing resources includingtime spent on business activities, including minimization of non-value-added activities (Cox &Blasckstone, 1998). Therefore time calculation is needed on each process to identify time value added(value added activity) and non value added time (non value added activity). Lead time becomes the mainreference in value stream mapping method. Here is a definition of value added and non value added timeat each stage:a. Pre manufacturing1) Value added: the time required for the preparation of materials that starts from the ordering ofmaterials on the supplier until the material is ready for use on the production floor and the activityadds value to the material2) Non value added: the time required for the preparation of materials that starts from the ordering ofmaterials on the supplier until the material is ready for use on the production floor but the activitydoes not provide added value to the materialb. Manufacturing1) Value added: Time needed for value-added activities (converting raw materials into valuableproducts)2) Non value added: time wasted for activities not worth adding. IEOM Society International3575
Proceedings of the International Conference on Industrial Engineering and Operations ManagementBandung, Indonesia, March 6-8, 2018c. Distribution1) Value added: time spent on value-added activities when delivery products to consumers2) Non value added: time wasted for activities when delivery products to consumersLead time is measure by the time it takes to prepare the product from the time the consumer ordersuntil the product will be delivered to the consumer (Bharath & Prakash, 2014). To calculate the lead timeit is necessary to measure the cycle time on each activity on the business process. One method that can beused is by using stopwatch time study (STS).2. Quality: Quality is one of the most important things to note. Juran (1993) defines the quality as fitness foruse of the product to the needs and customer satisfaction. Therefore quality is one of the indicators thatneed to be considered. Inventory is one of the waste that need to be eliminated.a. Pre manufacturing1) Value added: good quality material when purchased from supplier and can be used in goodperformance when it will be processed at manufacturing stage2) Non value added: defect materials when purchased from suppliers or materials that do not havegood performance when will be processed at the manufacturing stage.b. Manufacturing1) Value added: the product conform to the specified specification2) Non value added: the product does not conform to the specified specificationc. Distribution1) Value added: products delivered and received by the retailer or consumer in good condition2) Non value added: products delivered and received by retailers or consumers in defect conditionQuality at each stage can be measured by counting the number of materials or products that are good andbad for a certain period3. Volume and On time Delivery (OTD) Performance: on SSC-VSM will be used indicator whichintroduced by Suarez-Barazza, et al (2016) that is considering volume and OTD in SC-VSMa. Pre manufacturing: Performance accuracy of the volume and on time delivery of the supplierb. Manufacturing: the accuracy of volume and time of production in accordance with production targetsc. Distribution: the accuracy of the volume and delivery time of the manufacturer to consumer.B Environmental Indicators1. Material consumption: Processed material is a major source of cost for the finished product so thatmaterial consumption can become waste in the environment and economy (Torres & Gati 2009). Thismeans that measuring the effectiveness of the materials used during the production process is importantto do.a. Pre manufacturing1) Value added: Materials needed for material preparation process materials that starts from theordering of materials on the supplier until the material is ready for use on the production floor andand the material consumption adds value to the raw material2) Non value added: Material needed for material preparation process materials that starts from theordering of materials on the supplier until the material is ready for use on the production floor, butthe the material consumption does not provide value to the raw material or become waste afterprocessb. Manufacturing1) Value added: Materials needed during the production process that can provide value addedproducts2) Non value added: Material required during production process but not providing value addedproduct or become waste after the processc. Distribution1) Value added: Materials needed for product delivery process that can provide value added products2) Non value added: The material required for the delivery process but can not provide value on theproduct or become waste after the processMaterial consumption in maufacturing stage can be calculated by calculating the weight of componentsbefore and after a process (Vinodh, 2016). And in pre manufacturing and distribution stages it can becalculated by measuring the weigh of material supplied to the material or product.2. Water Consumption: Measurement of water consumption aims to calculate the amount of water usedduring the manufacturing process and to illustrate the important aspects that should be evaluated forimprovement from the standpoint of sustainability manufacturing (Faulkner & Badurdeen 2014).Wastewater or waste causes environmental and social harm (Torres & Gati 2009) therefore waterconsumption becomes one of the important indicators to be analyzed for sustainability. IEOM Society International3576
Proceedings of the International Conference on Industrial Engineering and Operations ManagementBandung, Indonesia, March 6-8, 2018a. Pre manufacturing1) Value added: Water required for material preparation process that starts from the ordering ofmaterials on the supplier until the material is ready for use on the production floor and and thewater consumption adds value to the raw material2) Non value added: Water required for the material preparation process that starts from the orderingof materials on the supplier until the material is ready for use on the production floor, but the thewater consumption does not provide value to the raw material or become waste after the processb. Manufacturing1) Value added: Water required during production process that can provide value added products2) Non value added: Water required during the production process but does not provide value addedproducts or become waste after the processc. Distribution1) Value added: Water required for the delivery of products that can provide value-added products2) Non value added: Water required for product delivery process but does not provide value to theproduct or become waste after the processThe water consumption of the product in manufacturing stage can be calculated by measuring the watersupplied to a machine and water resulting from a process. While calculating the calculation process ofwater consumption per unit of product is as follows (Faulkner & Badurdeen 2014):(the amount of water used in the process over a period of time)𝑊𝑎𝑡𝑒𝑟 𝐶𝑜𝑛𝑠𝑢𝑚𝑝𝑡𝑖𝑜𝑛 (1)(number of units of goods produced over a period of time)3.4.In pre manufacturing and distribution stages it can be calculated by measuring the water supplied to thematerial or product.Energy consumption is directly related to the environment this is due to the use of non-renewableresources and emitted GHG emissions (Faulkner & Badurdeen 2014). Therefore, energy consumptionmetrics need to be measured to identify how much energy is consumed in each process or betweenprocesses such as in-plant transportation, and the energy needed in the storage process.a. Pre manufacturing1) Value added energy: energy required for material preparation process that starts from the orderingof materials on the supplier until the material is ready for use on the production floor and and theenergy consumption adds value to the raw material2) Non value added energy: energy required for the material preparation process that starts from theordering of materials on the supplier until the material is ready for use on the production floor, but thethe energy consumption does not provide value to the raw materialb. Manufacturing1) Value added energy: the energy needed during the production process that can provide value addedproducts2) Non value added energy: energy needed during the production process but does not provide valueadded productsc. Distribution1) Value added energy: energy required for the process of delivering products that can provide valueadded products2) Non value added energy: energy required for the delivery of products but does not provide valueon the productMeasurement of energy consumption at each stage using the following formula:𝑄 𝑛𝑖 1 𝑃𝑖 𝑥 𝑡𝑖(2)Where:Q Amount of energy consumed𝑃𝑖 Energy needed for device i𝑡𝑖 operating time of the i tool iEmissionOne of the sustainability concept is to reduce CO2 emissions associated with the products (Simons &Mason, 2003). Gaseous emissions gas to the earth is generally referred to as greenhouse gas (GHG). TheGHG are CO2 (Carbon dioxide), CH4 (methane), N2O (Dinitro Oxide), and SF6 (sulfurhexafloride).CO2 emissions are generally associated with transportation, industry, and domestic energy use.a.Pre manufacturing1) Value added emission: emission generated from the material preparation process that starts fromthe ordering of materials on the supplier until the material is ready for use on the production floor andand the activity adds value to the raw material IEOM Society International3577
Proceedings of the International Conference on Industrial Engineering and Operations ManagementBandung, Indonesia, March 6-8, 20182) Non value added emission: required emission of the material preparation process that starts fromthe ordering of materials on the supplier until the material is ready for use on the production floor andbut the material consumption does not provide value to the raw materialb. Manufacturing1) Value added emission: emissions generated during the production process that add value to theproduct2) Non value added emission: emissions generated during the production process but do not providevalue added productsc. Distribution1) Value added emission: emissions generated from the product delivery process that adds value tothe product2) Non value added emission: emission generated from the product delivery process but does notprovide material value to the productTo calculate Greenhouse Gas emissions at each stage can be calculated using following formulation(wirahardikusumah & Sahana, 2012)𝐺𝑅𝐾 𝐸𝑚𝑖𝑠𝑠𝑖𝑜𝑛 𝐸𝑛𝑒𝑟𝑔𝑦 𝐶𝑜𝑛𝑐𝑢𝑚𝑝𝑡𝑖𝑜𝑛 (𝑀𝐽)𝑥 𝐸𝑚𝑖𝑠𝑖𝑜𝑛 𝐹𝑎𝑐𝑡𝑜𝑟 (𝑘𝑔𝑃𝑟𝑜𝑑𝑢𝑐𝑡 𝑇𝑜𝑡𝑎𝑙𝐶𝑂2)𝑀𝐽(3)5.Waste Managementa. Pre manufacturing1) Value added: waste generated from the process of material preparation that starts from the orderingof materials on the supplier until the material is ready for use on the production floor and had beenmanage (6R)2) Non value added: waste generated from material preparation process that starts from the orderingof materials on the supplier until the material is ready for use on the production floor, but the thematerial consumption does not provide value to the raw material, but had not been manage (6R)b. Manufacturing1) Value added: waste generated during the production process and had been manage (6R)2) Non value added: waste generated during the production process but had not been manage (6R)c. Distribution1) Value added: waste generated from the process of product delivery and had been manage (6R)2) Non value added: waste generated from the process of product delivery but had not been manage(6R)Waste management can be calculated by measure weight the waste before and after managed.C. Social IndicatorsHealth and Safety: Health and Safety is a matter that needs to be paid attention to. Well-organized workingconditions can improve worker productivity. The ILO (2013) states that if the workplace is safe and healthyworkers can do their work effectively and efficiently, whereas if the workplace is bad it can lead to accidents,absenteeism due to illness, loss of employee income, and decreased productivity for the company. Each yearthere are more than 250 million accidents happening in the workplace and over 160 million workers sufferingfrom ill health due to poor work environment (ILO, 2013). From this, the health and safety of workers need tobe considered in producing a sustainability system.1. Healtha. Pre manufacturing1) Value added: total number of days of attendance of workers capable of fulfilling material preparationactivities that starts from the ordering of materials on the supplier until the material is ready for useon the production floor.2) Non value added: total number of days of absenteeism so unable to fulfill material preparationactivity that starts from the ordering of materials on the supplier until the material is ready for useon the production floor.b. Manufacturing1) Value added: total number of days attendance of workers who are able to fulfill production activities2) Non value added: total number of days of absence of worker so unable to fulfill production activityc. Distribution1) Value added: total number of days of attendance of workers capable of fulfilling material preparationactivities2) Non value added: total number of days of worker absence so unable to fulfill product deliveryactivity IEOM Society International3578
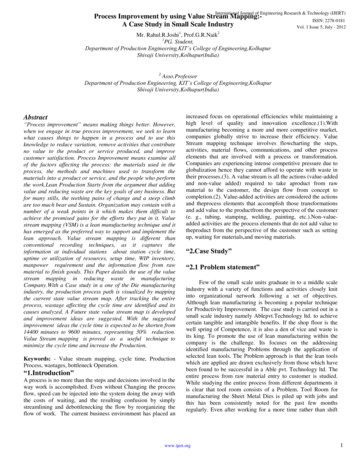
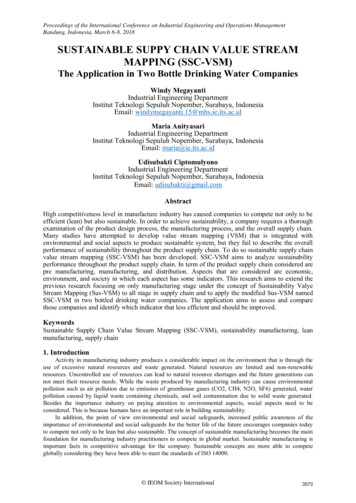
Proceedings of the International Conference on Industrial Engineering and Operations ManagementBandung, Indonesia, March 6-8, 20182. Safetya. Pre manufacturing1) Value added: total number of worker days capable of fulfilling material preparation activity well thatstarts from the ordering of materials on the supplier until the material is ready for use on the productionfloor.2) Non value added: the total number of worker days has a work accident so unable to fulfill thematerial preparation activity that starts from the ordering of materials on the supplier until the materialis ready for use on the production floor.b. Manufacturing1) Value added: total number of worker days capable of fulfilling production activity well2) Non value added: the total number of worker days has a work accident so unable to fulfill theproduction activityc. Distribution1) Value added: total number of worker days capable of fulfilling product delivery activity well2) Non value added: total number of worker's day have job accidents so unable to fulfill productdelivery activityWorker health and safety can be calculated by counting the number of days of attendance of the number ofworkers during a certain period due to ill worker or accident.3. Case StudyIn this research, SSC-VSM method applied to two bottled drinking water companies located inIndonesia. The companies have differences in that the second company has a larger production capacitycompared to the first company that is 30,000 units per month. While the company's first production capacity is6000 units per month. In addition to the difference from production capacity, the two companies have thedistinction of existing product advantages. The company first focused on producing gallon water with TDS 6quality level while at second company focus on fulfill the quality standard specified by ISO. TDS is the amountof water content in water such as Al, Fe, Ca, etc. All aspects and indicators will be collected and processed intovalue-added information. The results of all indicators will be used as a basis for drawing SSC-VSM maps. Theresults of the SSC-VSM map will be analyzed in three aspects (economic, environmental, and social)3.1 Case Study 1The first case study was the application of SSC-VSM to a manufacturing company that produces gallonpacked drinking water (AMDK) gallons. The company is a new and growing company. The company is able toproduce 6,000 units per month. The water offered has an advantage at TDS level 6 and has more oxygencontent. The product is generally used by consumers such as for drinking, cooking, washing fruits andvegetables, etc. Product in this company has 3 stages: pre manufacturing, manufacturing, distribution, Activitiesin pre-manufacturing process are the process of purchasing all materials on suppliers, raw material inspection,and storage of raw materials at the warehouse. Activity at the manufacturing stage is filtration 1 (filtering usingsand filters 1 and 2), back wash process, filtration 2, micro filter (bacterial filtering), UV irradiation andozonization, gallon sterilization, filling, and storage of finished products in the warehouse. The process of gallonsterilization and filling on PT X is done manually. Activities at the distribution stage are distributing finishedproducts to retailers and consumers as well as the process of storing finished products to retailers. PT X does thedistribution process by using two pickup vehicles. The related data on each indicator and aspect required werecollected by observation, secondary data, and interviews to related parties at every stage. The results of the datacollection used to draw SSC-VSM. SSC-VSM for PT X can be seen in Figure 1. IEOM Society International3579
Proceedings of the International Conference on Industrial Engineering and Operations ManagementBandung, Indonesia, March 6-8, 2018PPICAmount ProductionDemandProductionDemandPO MaterialsLT 0-12 daysMaterialsWarehouseWashingOutside gallonMaterialsSUPPLIERAblutionOutside GallonWashing InsideGallonFlushing InsideGallonW 1C/T 3.28 secW 1C/T 9.41 secPick Up : 2W 1MaterialGallonStickerGallon CoverTissueSealLT PO0 days12 days10 days7 days7 daysPerformance OTD-Volume Ordered100260080050005000Volume Received100260080050005000W 1C/T 5.95 secVolume Performance100 %100 %100 %100 %100 %W 1C/T 3.47 secConsumer DemandRetailer DemandWater tank
(value added activity) and non value added time (non value added activity). Lead time becomes the main reference in value stream mapping method. Here is a definition of value added and non value added time at each stage: a. Pre manufacturing 1) Value added: the time required for the