Transcription
Brazilian Journal of Operations & Production Management 13 (2016), pp 360-370VALUE STREAM MAPPING AND EARNED VALUE ANALYSIS: A CASE STUDY IN THEPAPER PACKAGING INDUSTRY IN BRAZILGleison Hidalgo Martinsa; Marcelo Gechele CletobabPackaging Industry Professional - Curitiba, PR, BrazilFederal University of Paraná (UFPR) - Curitiba, PR, BrazilABSTRACTThe study approached the application of the Value Stream Mapping and Earned Value analysis methods in a Pinch Bottomwith Simple Fold (PBSF) paper bag production line in an industrial packaging enterprise of multiwall paper bags locatedin Brazil. From the joint application of the mentioned methods, a better diagnosis of the situation was obtained, and theopportunities of eliminating wastes, of operation enhancement, and of a better monitoring of the involved costs appeared,bringing potential production gains and quality to the enterprise. As a contribution of this work, it can be highlightedthe presentation and discussion about the complementarity of a Lean Manufacturing tool with a Project ManagementMethodology.Key words: Value Stream Mapping, Earned Value Analysis, Paper Bags, Packaging industry, Production CostsABEPRODOI: 10.14488/BJOPM.2016.v13.n3.a13
361Brazilian Journal of Operations & Production ManagementVolume 13, Número 3, 2016, pp. 360-370DOI: 10.14488/BJOPM.2016.v13.n3.a131. INTRODUCTIONThe production system management of a companyaims to find means to improve its productivity, quality,flexibility, and punctuality. Mapping the value stream allowsenterprises to visualize their wastes, which helps thempropose enhancements in the process flows. Accordingto Rother et Shook, (2003) , the organizations must thinkabout the flow, instead of implementing discreet productionsystems or isolated improvement processes. The ValueStream Mapping (VSM) methodology has proved itselfefficient by focusing its attention to the flow.The Earned Value Analysis is pointed out as one of themost important techniques used for controlling projectsbased on cost, deadlines, and physical progress (Oliveira,2003). The concept is quite simple: assessment of whatwas acquired in relation to what was consumed and towhat the expenditure planning was. One of the mainadvantages of the earned value analysis is to calculate theproject performance throughout its development, so thatit is possible to project deadline estimates, future costs,and corrective and preventive actions beforehand (Vargas,2011).The study is justified by the existing gap in the literaturerelated to the VSM and EVA techniques use in the productionline of multiwall paper bags package with the application ofboth methods as a goal. Such application allows the analysisof decision making possibility to be more substantiatedbased on obtained data in the research, improving, thisway, the performance indicators used by the enterprise.The project elaboration will use for the field research thestudy case technique, which allows the researcher to seein a systemic and meaningful way the real situation of theevents. The case studies are the source of richness andextension of the phenomena reality context and require thatthe researchers face several distinct situations, in which onewill obtain more interest variables than the data point out.The fundamental tactics used by researchers to circumventthe variables is to use multiple evidence sources so that thedata converge in a triangular form.1.1. PackagesPackages appeared more than 10.000 years ago, beingused simply as recipients for drinking or stocking as coconutshells and sea shells in the natural state. The years wentby and evolution brought new technologies and allowedman to create new packages by handicraft processes, suchas: wooden bowls; natural fiber baskets; animal skin bags;pottery pots and other casings and containers.Right after the Second World War, the urban life gotto know new elements, the industrialization process, thesupermarket, and the increase of products consumption.These factors boosted the demand for packages both forthe consumer and for the transport companies, causing theraw material price of can packages such as tin and steel toincrease, forcing producers to search for new alternatives(Abrae, 2012).For Abrae the macroeconomics research presentedin the 1st semester of 2012, by IBRE (Brazilian Institute ofEconomics) /FGV (Getúlio Vargas Foundation) disclosedstatistics data of the national packaging industry as shownon (Table 1), the revenue of the packaging industry. In spiteof the positive results, there was a production decrease inthe first semester of 2012 (Abrae, 2012).Table 1: Packing Industry’s BillingYearSales ource: Abrae, 2012Gross ProductAmount36.434.942.845.647.9According to Abrae (2012), the analysis by packagingproduction sector in the wood, pasteboard, cardboard,paper, glass, plastic, and metal markets withdrew in the firstsemester of 2012 in comparison to the one in 2011. The mainretraction is in the glass market, which production decreasedin 10.88%, followed by the wooden (-8.08%), metal (-7.10%)and plastic (-3.77%) markets. The market that stands out isthe paper, pasteboard, and cardboard one for being the onlyone to achieve a positive result with 1.36% in its production.(Graphic 1) illustrates the participation of each market in thepackaging industry.Graphic 1: Physical Production of Packages in BrazilSource: Abrae, 20121.2. Industrial multiwall paper bagsThe multiwall paper bags are originated in Europe inthe XVIII century, due to the necessity of increasing theproductivity and the speed of salt packaging. Their mainfunctions are: to protect and accommodate the productavoiding contamination, to resist the conditions to whichthey are subjected, not to mention the space exploitationthrough all the productive chain, from the manufacturer tothe final consumer (Canan, 2011).
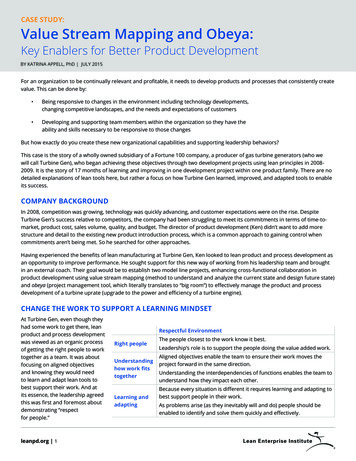
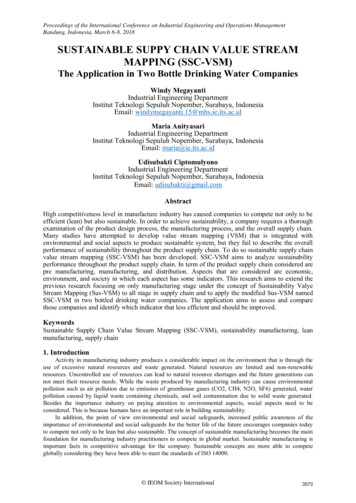
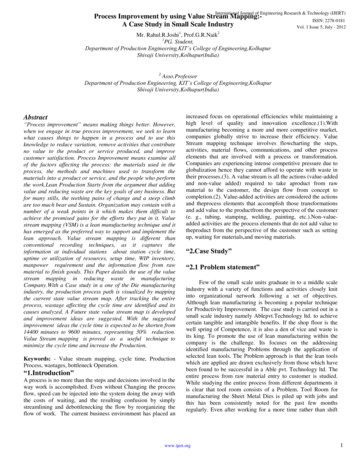
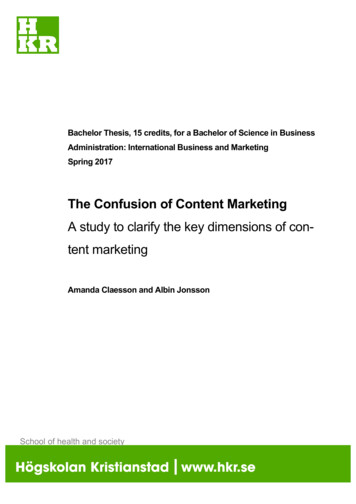
362Brazilian Journal of Operations & Production ManagementVolume 13, Número 3, 2016, pp. 360-370DOI: 10.14488/BJOPM.2016.v13.n3.a13The paper bags are made in several styles and sizes, whichvary from 1 to 50 kilos, and are used for the accommodationof several products such as: seeds, flour, chemical products,ores, animal ration, vegetable charcoal, food products,among others. The package models are illustrated by (Figure1), the industrial multiwall bags may be compound of one ormore layers and/or combinations with other materials suchas: plastic wrap and paper foil (Klabin, 2011).Figure 1: Models of industrial multiwall bags1.3. Value stream mappingTo Rother et Shook (2003), value stream mappingdoes not mean optimize only the parts in the individualprocesses, but also to consider the larger picture as awhole. But if one really wants to see them with a systemicvision, it will be necessary to go throughout the wholematerial transformation process and information tovisualize the value stream of a product, this path may coverother productive units as well as other enterprises. It isrecommended a lean implementation, since it is a tool thatmeets the “door-to-door” production flow inside the plant,including the delivery to the costumer’s plant, parts arrivals,and purchased materials, where a vision of the future stateis projected and it is implemented immediately. The valuestream mapping helps to understand the material and theinformation flow as the product follows the value stream.It is essential to see the flow of the productive systems asa whole. In order to make the results satisfactory, it will benecessary to follow some steps:1. Select the family of products;2. Determine the flow manager;3. Draw the current and future states;4. Plan and implement.1.4. Earned value analysisThe earned value analysis is a technique used for thecontrolling of projects in their full cost, deadline, andphysical process. It is an important tool that may offerprecise and complete diagnoses in any stage of the projecthelping managers with their decision makings. To Naemi etSalehipour (2010), the earned value analysis measures theperformance and the progress of the project, integratingthem in the management of the three most importantelements: costs, timetable, and scope. To Noori (2008),however, it is a management tool that absorbs some ofthe cost points of view, such as: the cost by the budgetedprogrammed work; calculus of the activity distributionsbased on the budget in relation to the estimated time;complete budget at the end of the project; assessment ofthe project date by date and verification in the project, theinstallment value, which should be spent.According to Vargas (2010), the three basic elements ofthe terminology for the calculus of the earned value analysiswere formed in three classical ways, based on the ANSI/EIA748 of the American National Standards Institute norm. Oncethese three parameters (PV, AC, and EV) are determined, theanalysis of the results is obtained from the found values ineach one of them. (Figure 2), uses a graphic presentationof the three variables of the earned value through the timeof a determined period, with an S-shape curve to show theearned value for a project in which its performance is abovethe one that was planned and is delayed in relation to thework plan.Figure 2: PV, EV, and AC through timeIt is observed that the definitions for the creation of aproject plan consist of four steps according to Vargas (2011)and Oliveira (2003).1- Work Breakdown Structure;2- Chronogram Development;3- Allocations of resources and definitions of controlcells;4- Manufacture of the project baseline (PV).2. FIELD RESEARCHThe choice of the case study method is advantageousfor it approaches a systemic and flexible view of the data
363Brazilian Journal of Operations & Production ManagementVolume 13, Número 3, 2016, pp. 360-370DOI: 10.14488/BJOPM.2016.v13.n3.a13collection and analysis, and for that the used techniques forthe research study were: a) Bibliographic research basedon materials such as books, theses, dissertations, scientificarticles, and websites aiming to clarify concepts and forms;b) Document survey of the project, based on constructivedetails of the product project, such documents werereleased by the supervisor; c) In order to elaborate drawings,spreadsheets and graphic of the process according to theproposed model, the MICROSOFT VISION and OFFICE software were used; d) data analysis and correlation of theresults.2.1. The case studyThe selected industry for the empiric research was thePackaging Industry of multiwall bags of Curitiba, ParanáState, Brazil. The enterprise produces several styles ofmultiwall bags and for this case the selected productionline refers to the pinch bottom bags with simple fold (PBSF)family product. The purpose was to collect informationfrom the PBSF production line, and through the theoreticalknowledge, accomplish during the practice the valuestream mapping and earned value analysis and present theeconomic viability analysis of the project, which allowedto analyze the earned value of pertinent parts, proposeenhancements to the manufacturing process, reduce set uptimes and also reduce the production line chain cycle timeand the scrap rate.2.2. The case study outlineAccording to Yin (2010), the evidences from case studiesmay be reached from six sources: documents, archiveregistries, interviews, direct observations, participantobservations, and physical artifacts.a)Documents: Production Orders (PO), reports ofplanned costs, reports of the products’ real costused in the research;b) Archive registries: The enterprise uses amanagement system called Enterprise ResourcePlanning (ERP);c)Interviews: The interviews were performed withresponsible members of each section;d) Direct observations: The direct observations mustbe done inside the natural environment of the casestudy;e) Participant observations: This topic is about amodality in which the observing participant is notonly the passive observer, but he/she can also takepart of several roles in the case study situations.f)Physical artifacts: constructive details of thedeveloping package (physical artifact of themultiwall paper bag).3. APPLICATION OF THE VSM AND EVA METHODS TO THECASE STUDYIn this chapter, the obtained results by the application ofboth methods to the problem presented in the case studyenterprise will be disclosed.3.1. Project DiagnosisThe data collection subsequently enabled thetriangulation of various evidence sources. Thus it waspossible to develop a data bank creation, in order to analyzethe data and obtain results.3.2. Data set for the value stream mapping of the currentstate3.2.1. Production process informationThe production process in the packaging industry for thisfamily involves pre-printing, laminating, tube formation,glue applying at the mouth extremities and at the tubebottom. Each process mentioned above will be processed insome specific equipment and for that production orders aregenerated for each process.The estimated time to produce the pilot batch wasplanned in 10.7 hours, having in mind the equipmentsetup time and the product processing time in all stages,considering the production historical data and the productcomplexity, as shown in Board 1, setup historic.Board 1: Setup historicSetupProcessingTotal ofminutesLaminate50 min50 min100 minPrinter50 min50 min100 minTuber60 min120 min120 minBottomer60 min200 min260 minMachineTotal ofminutes640 minTotal of hours10, 7 HsCustomer requirements: Pilot batch of 1,600 un of bags; Test the package performance; Packaging of refractory ores.Working time of the packaging industry: 24 working days per month; 3 shifts of 8 workinghours, 40-minute breaks and rosters (6X1). Anexception being the bottomer 13, which works inadministrative shifts from 7 a.m. to 5 p.m.
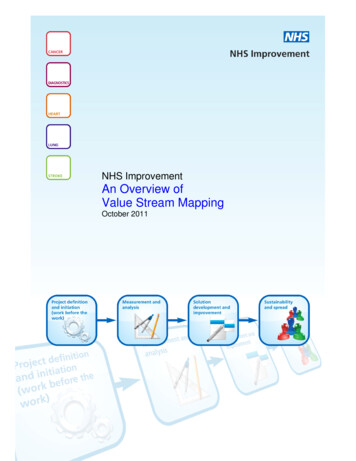
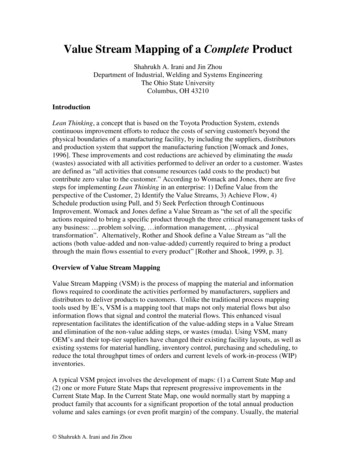
364Brazilian Journal of Operations & Production ManagementVolume 13, Número 3, 2016, pp. 360-370DOI: 10.14488/BJOPM.2016.v13.n3.a13Production Planning and Control Department: PPC and Sales define the budget and productionestimation monthly; Sales send sale orders (SO) daily. The PPC runs theMRP (Master Resource Planning) generating theneed of materials, tools, input, and raw material. The model used to establish the programsequencing in the factory are followed through areport called “production daily map”.3.2.2. Mapping of the current stateAfter collecting the information to elaborate the data setpresented on item 4.2.2, the stream mapping of the currentstate for the production process of the pinch bottom familywas developed, as illustrated by (Figure 3), stream mappingof the current state.Question 1 – What is the Takt time, based on theavailable working time of the flowing processes below thatare closer to the costumer?The 2s takt time is the necessary time that it takes toproduce a bag, that is, to meet a 1,600 un production of apilot batch, it takes approximately 53 minutes.Question 2 – Would you produce to a supermarket offinished goods from which costumers pull, or direct toshipping?Due to the high productivity and to the easiness ofstorage of the finished good, the enterprise directly definedto produce to shipping instead of developing a supermarket,as it is illustrated in (Figure 4), the finished production directto shipping.3.3. Data set for the value stream mapping of the futurestate3.3.1. Key points for the value stream mapping of the futurestateIn order to gather information and stream map the futurestate the methodology Rother et Shook (2003) will beadopted for the next 8 questions.Figure 4: Finished Production direct to shippingFigure 3: Map of the current stream state
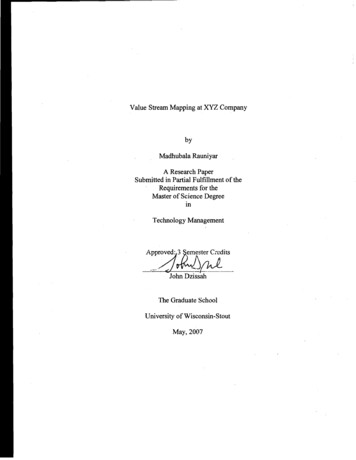
365Brazilian Journal of Operations & Production ManagementVolume 13, Número 3, 2016, pp. 360-370DOI: 10.14488/BJOPM.2016.v13.n3.a13Question 3 – Where can you use the continuous flow?In order to reduce the time from 8s to 2s as it is shown in(Graphic 2), a continuous flow in the manufacturing processmust be developed. It is suggested to work with bottomer 13on three shifts. This way, tuber 10 provides the tubes for thebottomer in a continuous flow, and then directly to shipping.As illustrated in (Figure 5), the produced continuous flowdirect to shipping.Question 5 – Which is the only production chain point(the pulling process) that the packaging industry chainshould program?The point that the company (PPC) should program wouldbe the bottomer, since all the previous processes need to bein a flow so that a pulling system between the bottomer andthe tuber can be planned.Question 6 – How should the packaging industry levelthe mix of products in the pulling process?The production of multiwall pinch bottom bags is madeby a specific machine, therefore the mix of products are notsignificant for this matter.Question 7 – Which constant working increment shouldthe packaging industry release and take away from thepulling process?Graphic 2: Current time of the cycles flow direct to shippingAt the moment of boarding, the material controller isresponsible for taking away the kabans from the palletsand returning them in the increment in order to route themto the production control section for the emission of newproduction orders.Question 8 – What are the improvements in the processthat are going to be necessary so the value stream of thepackaging industry work as it is described in the drawing ofthe future state?Figure 5: Produced continuousQuestion 4 – Where are you going to need to introducethe supermarket pull system in order to control the flowingprocesses above?Between the subassembly process and the tuber. Afterthe step of subassembly processes is done, bags are storedagain waiting for the tuber order. As the production ordersof the bag item are produced, the subassemblies are takenaway from the supermarket, as shown in (Figure 6), thesupermarket processes are not continuous and the kanbansare developed so they are produced again.To make the material and information flow in the packagingindustry feasible, the following process enhancements areproposed: Flexibility to develop new products; reduce theLead time; meet the deadlines; reduce the scraprate; reduce the setup time; improvements.3.4. Stream mapping of the future stateAfter working in the formulation of the key questionsthat were elaborated aiming to promote improvementsin the production process of the pinch bottom family, astream map of the future state was developed based on theinformation gathered from the key questions in item 4.3.1,allowing a clear view of the proposed objective in the flow,as it is illustrated in (Figure 7).3.4.1. Analysis of the situation improvement of the casestudyFigure 6: Supermarket of non-continuous processThe comparison between the value stream mapping ofthe current state related to the value stream of the futurestate, a tendency of positive values for the future indicatorsof the organization is realized, as it is illustrated on (Board2), lead time improvements.
366Brazilian Journal of Operations & Production ManagementVolume 13, Número 3, 2016, pp. 360-370DOI: 10.14488/BJOPM.2016.v13.n3.a13Figure 7: Stream mapping of the future stateBoard 2: Lead time improvementsTimeRolls of paperSubassemblyBefore5 days17 daysPulled continuous flow4 days5 days Paper rolls – There will be an 1 day anticipationin the raw material, if the information flow ismore efficient with the supplier, for that it willbe necessary to follow the monthly schedule asplanned (unity of bags);Subassembly – First the subassemblies areproduced and then they are stored in supermarkets,waiting for the next level of the production process(tuber). This process gets a reduction of 12 days instorage. But it is only possible if the POs of the bagitem are started in the bottomer;Tuber/Bottomer – as the setup is initialized, itis already possible to start the bottomer setup,waiting for the tube production to finish up thesettlement to the closure of the bag bottom, theFinished productLead TimeProcessing time1 day10 days33 days11.85 seconds0 day3 days12 days2.85 secondsglue application on the mouth, in the bottomer.Since the flow process is continuous, the waitingtime is reduced from 01 day to zero (0); Finished Good – the time that it took the productto be shipped to the costumer was also reduced to3 days, through the production planning sequence; Lead time – with the improvement in theinformation and material stream, it will be possibleto perform a planned production so it meets theoptimization of resources under the costumer’sstandpoint. The suggested flow in the elaborationof the future mapping reduces the lead time in 21days;Processing time – In the elaboration of thecurrent map, the product was processed in 3
367Brazilian Journal of Operations & Production ManagementVolume 13, Número 3, 2016, pp. 360-370DOI: 10.14488/BJOPM.2016.v13.n3.a13stages: subassembly, tubing and bottoming. Theprocessing time was measured in 11.85 seconds.When it comes to the stream mapping of thefuture, the product will then be processed in 2stages: subassembly and continuous flow betweenthe tuber and the bottomer. The bottomer reducedthe processing time to 2.85 seconds.3.5. Earned value analysisWhen considering the development of a new highlycomplex product of the PBSF family, the earned valueanalysis was performed in order to measure and assessthe project. As soon as the parameters (PV, EV, AC) aredetermined, analysis results are obtained for each one ofthem.3.5.1. Quantitative example of the earned value analysisFollowing, the project data will be presented, so that theunderstanding and the content application are eased.Project: Development of PBSF paper bags Production Order Quantity: 1,600; Planned Budget (BAC): R 3,400.00; Available Time (PAC): 10.7 hours.3.5.2. Scope definition of the WBS ProjectThe scope is defined through the Work BreakdownStructure (WBS), which objective is to define and control theworks to be done, to ensure that the product is producedwithin the proposed goal. As it is shown in (Table 3), thepinch bottom paper bag WBS project.After the scope was defined, the cost of each processwas estimated, based on the planned cost report and theprocess time based on the historic production data. Thecost is proportioned to the quantity and necessary time toproduce.Each process stage is composed by: Material – Raw material and direct materials; Resources – equipment, knives, and bottomers; Direct costs – depreciation, maintenance, andothers.The Work Breakdown structure (WBS) values are available,as shown on (Table 4), allocation of costs and deadlines.3.5.3. Chronogram developmentIt was used to define the creation of a chronogram, ina way to identify how the activities are distributed in time,considering delivery deadlines among other tasks. Also toelaborate the planned activity chronogram, the data fromitem 4.2.1 Process Production Information were used. Nowfor the chronogram of the carried out activities, they wereextracted from the item 4.2.2 Mapping of the current state.Below, (Graphic 3), Gantt Graphic Chronogram, illustratesthe planned time versus the realized time, after the activitieswere concluded.Table 3: Pinch bottom bag project --------------------1.1 Subassembly process --------------------1.1.1. Printing Stage --------------------1.1.2. Laminating Stage --------------------1.2 Tuber process --------------------1.2.1. Tube Formation --------------------1.2 Bottomer Process --------------------1.3.1. Tube Closing --------------------1.2 Packaging Process --------------------1.4.1. PackageTable 4: WBS – Allocation of cots and deadlinesPinch Bottom Bag Project --------------------1.1 Subassembly Process --------------------1.1.1. Printing Stage --------------------1.1.2. Laminating Stage --------------------1.2 Tuber Process --------------------1.2.1. Tube Formation --------------------1.2 Bottomer Process --------------------1.3.1. Tube Closing --------------------1.2 Packaging Process --------------------1.4.1. PackageTotalCost ( .1782.063400.960.1610.7
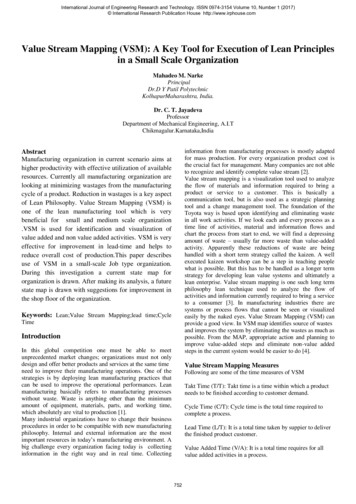
368Brazilian Journal of Operations & Production ManagementVolume 13, Número 3, 2016, pp. 360-370DOI: 10.14488/BJOPM.2016.v13.n3.a133.5.4. Allocation of resources and definitions of cellsTo determine the cost of each activities, among them:planned cost, realized cost, and earned value, the values ofeach processes were identified as illustrated on (Graphic 4),auxiliary table of cost distributions.3.5.5. Manufacturing baseline of the projectWith the scope defined, it is only necessary to follow theprogress and assess the performance of the project in thePlanned Value (PV) baseline, where all the information fromthe project is outlined, such as: chronogram, cost, activities,control, etc. Below, (Graphic 5) helps visualize the budgetbaseline of the planned value.Because it is a short-term project, the time was countedin hours and then it was chosen to measure the data afterthe project was concluded. This way the manager, throughincurred costs and the physical progress of the projectperformed a systemic analysis in order to search for the ACand the EV curves.It is noticed that the manager had planned a 10.7-hourtime to conclude the project, projecting that the cost valuewould be of R 3,400.00 PV. However, up to the referenceGraphic 3: Gantt graphic chronogramGraphic 4: Cost distributionGraphic 5: Budget baseline of the PVGraphic 6: Earned Value Analysis
369Brazilian Journal of Operations & Production ManagementVolume 13, Número 3, 2016, pp. 360-370DOI: 10.14488/BJOPM.2016.v13.n3.a13date, R 3,146.00 had been spent, and the earned valuehad been of only R 1,698.00. Below (Graphic 6) is shown tooutline the project analysis through the lines.As presented on chapter 2.4 Earned Value Analysis, thecost terminologies, deadline and performance rate werecalculated up to the reference date. CV EV-ACCV R 1,698 – R 3,146 (- R 1,448); SV EV – PVSV R 1,698 – R 3,400 (-R 1,702); TV (Graphically obtained)TV 9.3 hours; CPI EV/ACCPI R 1,698/R 3,146 0.54; SPI EV – PVSV R 1,698/R 3,400 0.50.It is observed through the calculated data up to thereference date, that the project presented lower estimatedcosts, and delays on the chronogram and conclusion of theproject. It was measured that the work time conversion andthe invested value were below the expectations.4. FINAL CONSIDERATIONS4.1. Research considerationsThe initial research by using two methodologies aboutvalue stream mapping and earned value analysis, in theproduction line of pinch bottom with simple fold (PBSF)paper bag family, aimed to help the organization achievesystematic improvements, by eliminating not only waste, butalso its causes. This study allows the enterprise to visualize inits procedures the waste sources, as well as the performanceof the earned value analysis of the product, which maycontribute to the application of new improvements. Besidesthe value stream mapping of the current state, a streamvalue of the future state was developed, and the economicfeasibility of the project was analyzed.To present the final considerations about the obtainedresults in the research, it will be necessary to revise thegeneral objectives and confront them with the results ofthe analyses. It will also be presented some considerationsabout the methodology and suggestions for future works.The development of the data set to construct the currentmap has organized the stream details in each pertinentprocess of the production line of the PBSF family, thusthe development for the map construction with futureapplications both on the flow and on the actions waselaborated, which resulted in analyzing points for theachievement of the proposed general objective.4.2. Methodology considerationsThe used methodology was of great importance forthe case study performance, and it clearly and succinctlyshowed how the research development must be carried out.The joining of two authors Rother et Shook (2003) (VSM)et Vargas (2011) (EVA), created an essential tool for theelaboration and application of the methods in collecting andprocessing the resulting information.Through the application of these two methodologies(VSM) and (EVA), it was possible to map all the process inquestion, and to collect information for the data set of thevalue stream and later of the information processing – whichwas only possible through the data from the value streammapping – that was performed through the earned valueanalysis, obtaining, as a result, the project feasibility.4.3. Considerations about the results of the performedanalysesWith the application of the two methodologies, thevalue stream mapping and the earned value analysis, itwas possible to visualize all the process of the PBSF familyproduction line, such as: value stream, planned value, realcost, cost variations, chronogram, and performance ratesaccording to the concepts and terminologies presented inthe research. For the case study, the joining of both toolswas efficient, since it has mapped out all the productionline flow when it collected the information flow and thenprocessed it, through the value analysis, which reached,as a result, a very high lead time, and in order to reduceit, the organization will need to enhance the systems (theflow, equipment and workforce), so it has an economicallypotential and profitable product for the enterprise.The intention is to propose to the enterprise the useof both methodologies, which is fundamental to obtain awider knowledge of the value stream in the production line,and in the future, deploy it in other lines, i.e. the managerswould have in their own hands a helping tool when makingdecisions about project control of costs, deadlines andphysical progresses as a whole.REFERENCESAbrae (2012). Associação Brasileira de Embalagens[Brazilian Association of Packages]. Available at http://www.abre.org.br Retrieved in: May 1, (In Portuguese).Canan C (2011). Agregando valor ao produto. [Addingvalue to the product]. Available at http://cabanhacanan.com.br/area public
1.3. Value stream mapping To Rother et Shook (2003), value stream mapping does not mean optimize only the parts in the individual processes, but also to consider the larger picture as a whole. But if one really wants to see them with a systemic vision, it will be necessary to go thr