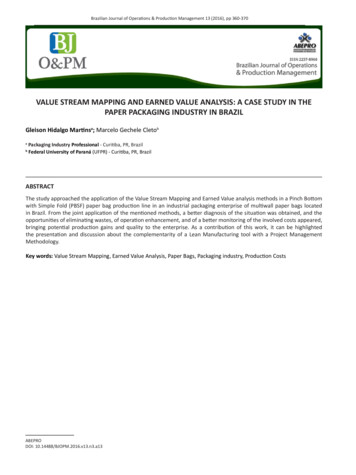
Transcription
Mapping Your Path –Using Value Stream Maps to Improve2020 Washington State Government Lean Transformation Conference
Core Objectives Recognize and read a value stream map Describe the purposes of and differencesbetween value stream and process maps Build and use value stream maps to improve
What is Lean?EnergyIt is WORK SCIENCE based on flow.Goal: deliver maximum value to thecustomer using the least amount of energy.Concept credit: Joanne Gaudet & France Bergeron
What is Flow?To flow means to move along in a steady, continuous, predictable fashion.Many barriers to flowFew or no barriers to flowIn Lean, we pursue continuous flow, where value reaches thecustomer by passing quickly and easily through a steadysequence of value-added activities.
5 Lean PrinciplesDefine ValuePursuePerfectionEstablishPullMap ValueStreamCreate Flow
How to Define Value1Identify product2Identify end-users3Ask end-users todefine value andproductrequirements
5 Lean PrinciplesDefine ValuePursuePerfectionEstablishPullMap ValueStreamCreate Flow
PollWhen it comes to value stream mapping, I would say: I’m here to learn what it is. I know about it, but haven’t experienced it. I’ve participated in it. I’ve facilitated it.
What is a Value Stream?All the materials and work ittakes to create and deliver aproduct to the customer.What is a Value Stream Map?A drawing that shows theflow of material andinformation through theproduction process.Energy
Why Draw a Value Stream Map?1. See flow across the system – to find & remove barriers2. Share understanding – to make better decisions3. Clarify value – to identify waste4. Connect each function to the customer – to keep them inmind5. Evaluate the work from objective and quantitative point ofview – to measure performance and changes6. Manage and continually improve the system of work – tostay in business
Value Stream Map vs. Process MapValue Stream Maps High-level (zoom out) Product and information flowImage: 9/ValueStreamMapParts.png (Daniel Penfield)Process Maps (Flowcharts) Detailed (zoom in) Activities and decisionsImage: https://en.wikipedia.org/wiki/Swim lane#/media/File:Approvals.svg (Paul Kerr)
Value Stream Map vs. Process Map (Flowchart)
Types of Value Stream MapsIdeal StateFuture StateCurrent StateImages: Copyright 2012 Leanman
How to Build a Current State Value Stream Map1. Map material flow2. Map information flow3. Add timeline and calculateprocess performance data
SIPOC Framework for Value Stream omerInputOutputProcessProcessProcess
SIPOC Example: Licensee Data EntryLicenseePublic
Map Material Flow Be the thing and walk the process – sketch reality Identify major work activities: operator and process step Identify inventory (inbox) queues
Material Flow Example: Licensee Data EntryLicenseePublicAdmin. Asst.Scan Tech.Data Tech.Senior Tech.SupervisorOpen & BatchMailScan & Log FormsEnter Form DataCheck Data inSystemRelease DataRequirements:- Easy to find- Available w/in 7 days- Accurate
Map Information Flow & Capture Data Be the thing and walk the process – try in reverse Specify how the input is supplied Identify electronic systems used to capture/transfer info. Capture who gets information, how, and how often
Information Flow Example: Licensee Data enseeFormsLicenseeInformationAdmin. Asst.Scan Tech.Data Tech.Senior Tech.SupervisorOpen & BatchMailScan & Log FormsEnter Form DataCheck Data inSystemRelease DataRequirements:- Easy to find- Available w/in 7 days- Accurate
Map Information Flow & Capture Data – cont’d Measure what’s happening Capture data about time, quality, and customer demand Note inventory and number of operators at workstations Identify quality issues and rework loops Optional: label the product between workstations
Data Example: Licensee Data atabase90 min360 min1000 min3600 minLicenseeFormsLicenseeInformationAdmin. Asst.Scan Tech.Data Tech.Senior Tech.Open & BatchMailScan & Log FormsEnter Form DataCheck Data inSystemBatch ofFormsBatch ofScannedFormsBatch ofEnteredFormsSupervisorBatch ofEnteredFormsRelease DataC/T 90 minC/T 40 minC/T 120 minC/T 15 minC/T 5 minT/T 7 minT/T 5 minT/T 15 minT/T 8 minT/T 5 minIY 90%IY 95%IY 97%IY 93%IY 100%Requirements:- Easy to find- Available w/in 7 days- Accurate
Add Timeline & Calculate Performance Data Draw timeline along bottom Calculate process performance metrics: Lead (total production) time: Cycle Time Wait Time Value-added time: Sum of value-adding Touch Time Rolled throughput yield: Product of all Incoming Yields
Timeline Example: Licensee Data EntryPublicLicenseeAARequirements:- Easy to find- Available w/in 7 days- AccurateBB18/dayLicenseeDatabaseFormDatabase360 min90 min3600 min1000 minLicenseeFormsLicenseeInformationAdmin. Asst.Scan Tech.Data Tech.Senior Tech.Open & BatchMailScan & Log FormsEnter Form DataCheck Data inSystemBatch ofFormsBatch ofScannedFormsBatch ofEnteredFormsSupervisorBatch ofEnteredFormsRelease DataC/T 90 minC/T 40 minC/T 120 minC/T 15 minC/T 5 minT/T 7 minT/T 5 minT/T 15 minT/T 8 minT/T 5 minIY 90%IY 95%IY 97%IY 93%IY 100%5 min7 min90 min90 min40 min8 min15 min360 min120 min1000 min15 min3600 minRTY: 77.1%5 minVA/T: 40 min5 minL/T: 11.1 days
5 Lean PrinciplesDefine ValuePursuePerfectionEstablishPullMap ValueStreamCreate Flow
Flow Analysis Example: Licensee Data EntryPublicLicenseeAARequirements:- Easy to find- Available w/in 7 days- AccurateBB18/dayForm s90 minLicenseeForms1000 min360 minNVA WorkLicenseeInformationAdmin. Asst.Scan Tech.Data Tech.Senior Tech.Open & BatchMailScan & Log FormsEnter Form DataCheck Data inSystemBatch ofFormsBatch ofScannedFormsBatch ofEnteredForms3600 minSupervisorBatch ofEnteredFormsRelease DataC/T 90 minC/T 40 minC/T 120 minC/T 15 minC/T 5 minT/T 7 minT/T 5 minT/T 15 minT/T 8 minT/T 5 minIY 90%IY 95%IY 97%IY 93%IY 100%5 min7 min90 min90 min40 min8 min15 min360 min120 min1000 min15 min3600 minRTY: 77.1%5 minVA/T: 40 min5 minL/T: 11.1 days
Solve Problems to Achieve Future StateFuture StateCurrent State Produce to takt Eliminate wasteImages: Copyright 2012 Leanman
Common Value Stream Mapping SymbolsSupplier orCustomerProcessStart and end of processKaizenBurstProblem/source of waste and ideato improveProcess Step: Action takenOperator: Role that performs this process step.List the number of operators if more than one.Shipment(#) Operator(Colors represent different roles involved)C/T XX minT/T XX minIY XX% CommentsData Boxes:Cycle Time: Total time required to complete aprocess step (includes touch time).Touch Time: Time a product is actually beingworked on.Incoming Yield: Percent of time that productfrom previous step is fit for use in current step(complete and accurate).QQueue (waiting) time for product orservice to enter next processTimeName of system that information flowsto and/or from within value streamAdditional information related to processDatabase
Common Value Stream Mapping SymbolsWhatWhatMaterial flow to Customer or fromSupplierPhysical flow (what)WhatAARework (location where defect detected)Electronic flow (what)Rework (location where defect startsrework)# ofiterationsIteration loop (between twoprocesses or within one process)Summary MetricsLead Time (LT): The total time a customer must wait to receive aproduct after placing an order (or initiating the process).Rework Loops: When a work product contains errors (incomplete orinaccurate) and must be sent back upstream to be fixed.Rolled Throughput Yield (RTY): The probability that a single unit canpass through a series of steps free from defects. To calculate, multiplythe IY for each step.Value Added : Non-Value Added (VA/NVA): For an activity to be valueadded, it must meet all three of these criteria:1)The customer must care about it.2) It must change the fit, form, or function.3) It must be done right the first time.A Non-Value Added step is anything that does not meet these threecriteria.Handoffs: The number of time a product changes hands in a process onits way to being completed.
Example
10 Mapping Pitfalls & How to Avoid ThemIt’s a mistake to: Map only in a conference roomDraw what supposedly happensDive too deep into details (tasks)Follow operatorsCorrect operatorsJump to solutionsSkip metricsMap solo or “stitch” maps togetherStop at mappingFocus on making a beautiful mapusing technologySo, instead: Go and see firsthandCapture realityThink “high-level handoffs”Follow the productObserve, inquire, and seek to understandNote problems (pain)Measure what happensMap whole process together as a teamUse maps as launch pad for actionDraw – in pencil – the messy truth, andkeep it dynamic (change it as you learn)
Additional Resources Learning to See by Jim Womack and Dan Jones “Value Stream Mapping – Helping Your Team See the Future State” 2012 Lean Conference Presentation by Sarah Stuart, Impact Washington Link to YouTube video: https://www.youtube.com/watch?v 27OBzSEjHzA&feature player embedded %20the%20Future%20State.pdf Link to slides:
Eden.Teachout@des.wa.gov
What is a Value Stream? All the materials and work it takes to create and deliver a product to the customer. Energy What is a Value Stream Map? A drawing that shows the flow of