Transcription
Value Stream Mapping at XYZ CompanybyMadhubala RauniyarA Research PaperSubmitted in Partial Fulfillment of theRequirements for theMaster of Science DegreeInTechnology ManagementThe Graduate SchoolUniversity of Wisconsin-StoutMay, 2007
iiThe Graduate SchoolUniversity of Wisconsin-StoutMenomonie, WIAuthor:Madhubala RauniyarTitle:Value Stream Mapping at XYZ CompanyGraduate Degree/ Major: MS Technology ManagementResearch Adviser:John DzissahMonthfYear:May, 2007Number of Pages:46Style Manual Used: American Psychological Association, 5th editionABSTRACTA value stream includes all activities required to transform a product from raw materialinto the finished goods. Value Stream Mapping scrutinizes business processes from beginning toend and a visual representation map is drawn of every process involved in the material andinformation flows. Then a future state map is drawn to show how things should work for bestcompetitive advantage. Value Stream Mapping helps to identify the current flow of material andinformation in processes for a family of products, highlighting the opportunities for improvementthat will most significantly impact the overall production system.The purpose of this study is to develop a value stream map for a manufacturing companyin Minnesota. The goal is to identify and eliminate waste which is any activity that does not addvalue to the final product, in the production process. In order to collect the information needed tocomplete the project, the researcher will take a tour ofthe production facility. This will enablethe researcher to be familiar with the activities being performed at the shop floor. It would alsohelp in getting a vivid idea ofthe production flow. In addition, a classroom environment would
iiibe set with leads from the various departments of the company so that the researcher can observeand collect information related to product families for the practical mapping and product/processflow from start to finish. This information would highly assist the researcher to visualize thecurrent state ofthe process activities by mapping the material and information flow and lookingfor opportunities to eliminate wastes and to improve the process flow. Based on all theinformation gathered, the company would utilize these results as a plan to map the future stateand implement lean manufacturing techniques so that wastes can be eliminated, flow maximizedand throughput increased.
ivThe Graduate SchoolUniversity of Wisconsin StoutMenomonie, WIAcknowledgmentsIt is a great pleasure to thank my advisor, John Dzissah who has supported me immensely andguided me throughout my project work.I would also like to thank Tom Lacksonen, Lloyd Peterson and Gerry Tietz for supporting medirectly and indirectly in completing my research work.Many thanks to XYZ Company for giving me an opportunity to do my research work on them.
vTABLE OF CONTENTS.PageABSTRACT.iiList of Tablesvi.List 0 f FIguresVllChapter I: Introduction.1Statement ofthe Problem2Purpose ofthe Study2Assumptions ofthe Study2Definition of Terms3Chapter II: Literature Review6Definition ofLean Manufacturing6Origin ofLean Manufacturing6Value Added and Non- Value Added7The Phases ofLean Application8Value Stream Management9Value Stream MappingChapter III: Methodology1012Subject Selection and Description.13Instrumentation15Data Collection ProceduresData Analysis,. 1516
viChapter IV: Results22Introduction22Analysis ofthe Current State Map.23Future State Map25Chapter V: ions31References33Appendix A: Value Stream Definitions and Symbols34
viiList of FiguresFigure1: Product Matrix of XYZ Company14Figure 2: Metrics of Each Process15Figure 3: Work-In-Progress Between Process16Figure 4: Current State Map18Figure 5: Future State Map28
1Chapter I: IntroductionEvery organization is striving hard on getting more work done in less time and with greaterease. The fundamental aim of any organization has been to continuously minimize waste andmaximize flow which would ultimately lead to customer satisfaction by providing right productat the right time in the right quantity and the right quality at a reasonable price. This can beachieved greatly by adopting lean manufacturing system which is more than a cost reductionprogram. It aims at eliminating wastes which could be in the form of excess production andinventory, redundant movement of material, waiting and delays, over processing, excess workermotion, rework and corrections.Part of lean manufacturing is assessing operations and processes or products that add costrather than value (Tapping, Luyster & Shuker, 2002). Each step of the manufacturing process isexamined to determine if it adds value to the product. If it does not add value, the process couldbe assigned to a subcontractor or outsourcing company in order to focus the workforce on value added operations of its core business. This is known as value stream which is a set of processesrequired to transform raw materials into finished goods that customers value (Womack & Jones,1996).This study aims at developing a value stream map for XYZ Company. It is a lead acidrefining and recycling company located in Minnesota and servicing in North America. More than98% of all automotive batteries are recycled as the state law requires reclamation of used batteryfor each battery sold. As a result, the demand for lead-acid batteries is growing. Most of the leadreclaimed and refined is purchased and used to manufacture the next generation of automotiveand industrial batteries. Recycled lead products are also used for sporting goods equipment, x ray shielding, pipes and cable sheaths, roofing materials, back-up electrical power, and much
2more. With the growing demand of lead, the company is seeing a dramatic increase in saleswhich demands the need to accelerate production in such a way so that there is minimal of wasteand increased flow with ease thereby increasing throughput.The company manufactures several product families. This research is focused on theproduct family of soft lead pigs that comprises 65% of the total demand. XYZ Company adoptsthe traditional concept of mass production in batches where the product is produced in fullcapacity despite the quantity of product ordered. This creates high level of inventory, long leadtime and a reduction of available floor space.Statement ofthe ProblemXYZ is a manufacturing company that recycles used automotive lead-acid batteries. Withthe growing demand of lead- acid batteries and uses of recycled lead in other products, XYZCompany wants to introduce and implement lean flow technologies in the company so thatcustomer demand can be met by increasing throughput and capacity. It presently works on thebatch processing system with longer lead time and cycle time. This has thereby led to increasedinventory and higher cost.Purpose ofthe StudyThe purpose of the study is to identify non-value added activities and waste so that it can begradually reduced and eliminated, compress production lead time, switch from big batches tosmall batches and one-piece flow wherever it is possible in the process flow. Its ultimate aim isto introduce lean flow in the workplace ofXYZ Company so that continuous improvement canbe made and determine adequate inventory based on customer demand.Assumptions ofthe Study1. The result of the study is limited to XYZ Company
32. All data is reliable and accurate3. The research is limited to one product family4. The research includes the development of current and future state map but not how toimplement the recommended process improvement.Definition ofTermsBatch. A mass production approach to operations in which large lots or quantities areprocessed and moved to the next process despite the actual quantity needed (Rother andShook, 2002)Continuous Flow. The movement of product from one manufacturing operation ormachine to another without stopping (Tapping et al. 2002)Current state map. A chart that depicts the present day situation of a manufacturingprocess or a product family.Customer demand. The quantity of products required by a customer.Cycle time. The time that elapses from the beginning of a process or operation until itscompletion.Flow. The movement of material or information.Future state map. A chart that suggests ways to adopt lean techniques in order to reduceand eliminate non-value-added activities and increase throughput.Heijunka. Balancing the amount of work to be done during a shift with the capacity tocomplete the work.Just-in-time production. A production paradigm which ensures right product in the rightquantity, at the right time to the customer.
4Kanban. An inventory control card at the heart of the pull system specifying what isneeded in terms ofproduct and quantity and at the time required to achieve just-in-timeKaizen. Small daily improvements performed by everyone in order to eliminate waste.Lead time. The time taken by a product to be transformed from raw material to finishedgoods.Leveling. Evenly distributing the work required over a shift or a day to fulfill customerdemand.Muda. A Japanese word for waste which means any activity that consumes resourceswithout creating value for the customer.One piece flow. See continuous flow.Product family. A group of parts that share common equipment and processing attributes.Pull production. A method of production control in which downstream activities signaltheir needs to upstream activities.Supermarket, A system used to store a set level of finished goods inventory or work-in progress and replenish what is pulled to fulfill internal and external customer demand.Takt Time. The pace at which the process needs to run in order to meet customerdemand. It is calculated by dividing available production time by customer demand.U-shaped cell. The location in V-shape ofprocessing steps for a product immediatelyadjacent to each other so that parts, documents can be processed in a closely continuousflow.Value stream. All of the actions, both value-creating and non value-creating, required tobring a concept to launch and from order to delivery.
5Value Stream Mapping. A visual representation of the material and information flow of aspecific product family.Waste (muda). Anything within a value stream that adds cost or time without addingvalue.
6Chapter II: Literature ReviewThis chapter gives an overview and information of lean manufacturing and value streammapping which would help the reader in understanding the details of the study in the laterchapters.Definition ofLean ManufacturingLean manufacturing is a systematic approach to process improvement. It is based onidentifying and reducing waste coupled with continuous improvement. According to Womack,Jones and Roos (1990), the term "lean" represents a system that utilizes fewer inputs to createthe same outputs than those created by a traditional mass production system, while increasing thevariety of finished goods for the end customer.Lean manufacturing is also popular by the name Just-In-Time Manufacturing developed byToyota, the Japanese car manufacturer. This concept is now applied by diverse industries andbusinesses including engineering, administration, project management, manufacturing andadministration. Lean manufacturing aims at transforming an organization into an efficient,smoothly running, competitive and profitable organization that continues to learn and improvise.The application oflean paves its way to reduce lead time and increase throughput by eliminatingwastes which comes in various forms.Origin ofLean ManufacturingNo new idea springs from a void and so is the case with lean manufacturing. During thepost World War II period, Japanese manufacturers were facing the problem of deficiency ofmaterials, financial problems, and human resources (Ohno, 1988). For many decades, Americahad cut costs by using the mass production system by producing fewer types of end items while
7for the Japanese the problem was how to cut costs in order to produce small number of manytypes of end items.The history of lean is dated back to 1940 when German worker produced three times asmuch as a Japanese worker and an American worker produced three times as much as a Germanworker (0000, 1988). Therefore, the ratio ofproduction between American and Japanese workforces was nine to one. Striving towards improvement, the Japanese leader Toyoda Kiichiroproposed to reduce the gap with America in three years, resulting in the birth of leanmanufacturing. Eiji Toyoda and Taiichi 0000 at the Toyota Motor Company in Japan pioneeredthe concept of lean production (Womack, Jones, Roos, 1991). It was originally called Kanbanand just-in-time (JIT) which are presently the techniques oflean production. Lean productioncombines the advantages ofboth craft and mass production. It avoids the high cost ofthe formerand the rigidity ofthe latter. It strives in attaining perfection; continually declining costs, zerodefects, zero inventories, and endless product variety which is an endless quest.Value- Added and Non-Value AddedContrary to the conventional business view, all value is defined from the point of view ofthe customer with regard to lean (Carreira, 2005). It makes to think and analyze whether theactivity directly contribute to the customer's product to make it more complete and ifthecustomer is paying for that activity or not. This, in the language of lean is known as value-addedand non-value-added activity. The former refers that the product has been physically changedand its value to the customer has increased. The latter refers to the activity that consumes time(people expense), material, and space (facilities expense), yet does not increase its value.The basic idea of lean is to identify and eliminate non- value added activities from everyaspect of the business (Levinson and Rerick, 2002). Businesses are accustomed to waste so
8identifying waste is an important aspect of lean manufacturing process. The Japanese call waste''muda''. Hiroyuki Hirano defined waste as "everything that is not absolutely essential."(Santos,Wysk and Torres, 2006) He also defined work as any task that adds value to the product. Wasteis a symptom rather than a root cause of the problem. The seven major forms of waste are thefollowing: (Tapping and Shuker, 2003)1. The waste of overproducing: It refers to producing more than needed or producing itahead of time resulting in consumption of materials, people and storage faster thanrequired which thereby results in other kinds of waste.2. The waste of waiting: It refers to anything such as people, paper, machines or informationthat causes the workflow to stop. It is the idle time between operations.3. The waste of over processing: It refers to redundant activities that do not add value andthe customer is not willing to pay for it.4. The waste of inventory: It refers to excess stock of anything from raw materials tofinished goods.5. The waste of motion: It refers to any motion that is not necessary to the successfulcompletion of an operation.6. The waste of defects or correction: It refers to producing defective work that needs to beredone which disrupts a normal process and leads to productivity losses.7. The waste oftransport: It refers to moving something more than necessary.Three Phases ofLean ApplicationCustomer Demand PhaseThis phase determines who the customer is, what the customer's requirements are so thatcustomer demands can be met (Tapping and Shuker, 2003). It requires the calculation oftakt
9time which is derived from a German word "takt" meaning rhythm. It is the pacemaker whichdetermines how fast a process needs to run to meet customer demand. It is calculated by dividingthe total operating time available by the total quantity required by the customer.Continuous Flow PhaseThe heart oflean is just-in-time or continuous flow which means producing only what isneeded, when it is needed and the exact amount needed. It is characterized by the ability toreplenish a single work unit when the customer has pulled it also called "Move one, make one".Leveling PhaseLeveling involves evenly distributing the work required to fulfill customer demand over aperiod of time which could be a week, day or hour. Failure to accomplish work leveling maylead to processing delay or waiting time.Value Stream ManagementLean utilizes proper tools to make work flow as smooth as possible so that it reaches its endcustomer (Tapping and Shuker, 2003). Value stream management is a process of planning andlinking lean initiatives through systematic data capture and analysis which consists of eight steps.1. Commit to lean2. Choose the Value Stream3. Learn about Lean4. Map the current State5. Identify Lean Metrics6. Map the Future State (using the demand, flow, and leveling concepts)7. Create Kaizen Plans8. Implement Kaizen Plans
10Value stream Management is a systematic approach that tells people how and when toimplement improvements that aids in meeting customer demand. The tools of leanmanufacturing such as value stream mapping, supermarket, heijunka, u-shaped cells and pointkaizen workshops must be applied in a proven, structured process to attain success. The leanmanagement principles are of great essence to transform an organization into lean. The followingare the lean management principles:1. Define value from the customer's view perspective.2. Identify the value Stream3. Eliminate the seven deadly wastes4. Make the work flow5. Pull work, don't push it6. Pursue to perfection7. Continue to improveValue Stream MappingIt is a tool of lean manufacturing that helps to understand the flow of material andinformation as products make their way through the value stream. The value stream includes thevalue adding and non-value adding activities that are required to bring a product from rawmaterial through delivery to the customer. In other words, value stream mapping is an outline ofa product's manufacturing life cycle that identifies each step throughout the production process.It is a visual representation of the material and information flow of a particular product family(Tapping et. al. 2002).Value stream mapping is a powerful yet simple tool which allows the user to see the wastethroughout the stream (Lovelle, 2001). It consists of sketching the current and future state map.
11The current state map charts the present flow of material and information as a product goesthrough the manufacturing process. It is a simplified visual blue print that identifies value andwaste throughout the system and encourages systematic approach to eliminating waste. Thefuture state map is a chart that shows how to create a lean flow. It adopts lean manufacturingtechniques to eliminate waste and reduce non-value added activities to the minimum.The goal of Value Stream Mapping is to move from batch and push to one piece flow andpull through the entire value stream. Introducing a lean value stream that optimizes the flow ofthe entire system from information, to material, to finished goods arriving at the customer's dooris the ultimate goal. It helps in reducing lead time, inventory, and overproduction and improvesthroughput, efficiency and quality. It aims at continuously improving in a capable, sustainablemanner.Appendix A shows the various symbols for value stream mapping which would enable thereader in understanding the current and the future state map in the later chapters.
12Chapter III: MethodologyThe objective of this study is to reduce lead time and increase throughput by identifyingnon-value added activities and striving to reduce and eliminate it at XYZ Company so thatcustomer demand can be met. Batch processing in full capacity and bottlenecks in the productionprocess are key contributors to long lead times. The results of the research would have directimpact on product lead time and inventory which would aid in reducing cost and meetingcustomer demand.The research started by taking a three day lean workshop which enhanced the understandingof lean manufacturing and value stream mapping. Employees from XYZ Company belongingfrom different departments participated in the workshop so that the mapping of the value streamcould be done smoothly. After the completion of the certification course, .a company visit atXYZ was scheduled for three days. The research started by taking a tour of the plant andobservations were made on the shop floor and the entire plant. Then a classroom environmentwas set by involving people from different departments ofXYZ Company so that further detailsof the current production process could be obtained and discussed. Information regarding cycletime, lead time, number of operators involved in each process, amount of inventory and work-in progress between processes were determined. Based on the information gathered, a current statemap was drawn which depicts process flow, product flow, information flow and communicationflow. Takt time and cycle time are also calculated. Besides, the inventory between each processis also determined. The data is then analyzed to see what areas need improvement by identifyingnon-value added activities that can be reduced and eliminated. Thereafter, the current state mapis expanded into future state map followed by further discussions and analysis. Lean techniquesare suggested for improvising the product flow, communication flow and information flow.
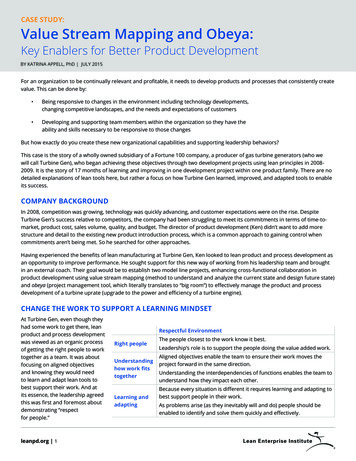
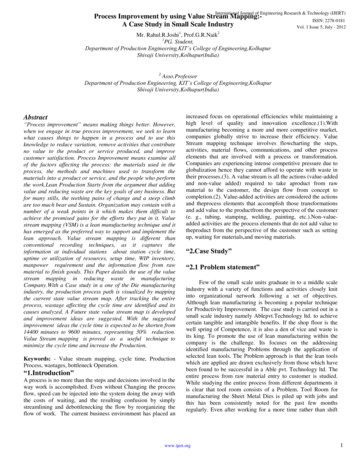
13Eventually the benefits oflean manufacturing techniques are projected and savings in lead timecalculated. The current state map would then be used as a guideline for improvement that can bemade. A final presentation is made to XYZ Company demonstrating the areas of improvementrequired and the positive impact and benefits the company would have by implementing them. Aneed for change management and employee involvement is also brought to their attention.Subject selection and descriptionThe study will focus on soft lead pigs' product family as it comprises 65% of the customerdemand. There are several other product families but as soft lead product family contributes to amajor portion of the customer demand, it is a good product family to focus the study on.In order to choose which product family to select for the mapping, product family with thehighest demand was selected. A product matrix in figure 1 was developed with the differentproducts manufactured on the left hand side column and the process operations toward the righthand row. It enables us to see the different processes followed by different products.
14Figure 1: Product Matrix ofXYZ 7P8P9Pig Cst'zBill Cst'zBIk ING PIGXXXXXPB3XXXXXP4XXXXX1.5% LARGE BILLETSXXXXXXX0% LARGE BILLETSXXXXXXX10% LARGE BILLETSXXXXXXXSMALL BILLETXXXXXXP3XXXCorroding blockXXXXXXXXXXXXXXXXXXXXBOLCKSRED BASE KETTLES5,6,9 BASE ONLY-PUMB7&8 CASTING KETTLESPIG CASTING 4.5 HRS/POTCLK CASTING 4 HRS/POTXXXXXXXXXXXXXXXXX
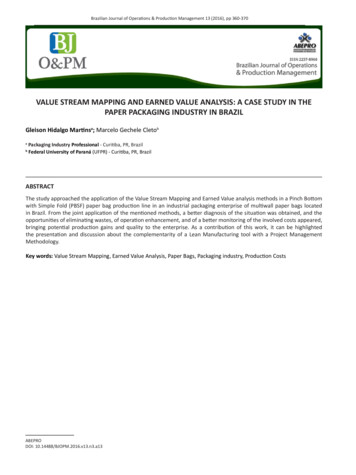
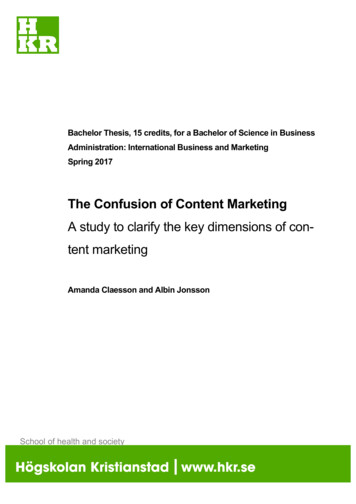
15InstrumentationValue Stream Mapping was used as a tool to map the process and depict the scenario withthe aim of reducing lead time and increase throughput. The main source used to create the mapswas the book Value Stream Mapping Workshop (Rother and Shook, 2002). Besides, the threeday lean certification workshop and the knowledge gained from the books related to value streammapping provided the tools to create useful and informative maps.Data Collection ProceduresIn order to collect the data to draw the current and future value stream map a classroomenvironment was set with employees from all areas of the company. Data was obtained from therespective departments as the value stream map was drawn. Plant tour with the company officialswas done prior to the classroom discussion so that the researcher could have a clearunderstanding of the process and the entire scenario. Active participation in discussions withemployees and correct information being disseminated assisted in drawing an accurate valuestream map for the company. The figures 2 and 3 below shows the information collected whichfacilitated in drawing the current state map.Figure 2: Metrics for each ProcessProcessOperatorsCycle Time(hours)Uptime94.390%Reverb essingCentre
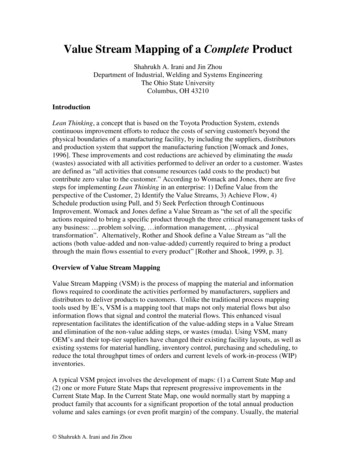
16Figure 3: Work-In-Progress (WIP) Between ProcessesQuantityQuantityWIP in DaysProducedRequired 9.85Between ReverbFumace& Refining271600280009.7Between Refining---ProcessBetween(Pounds) (2)Receiving &RMPCBetween RMPC &Reverb Furnace& CastingBetween CastingI---61500006850008.9& CoolingBetween Cooling& ShippingTotal28.45From the data and information retrieved from the above tables and discussions from theleads of different departments, current state map with material flow, communication flow andinformation flow was drawn to show the process of soft lead pigs from the point it was ordereduntil delivered to the end customer. The last step was to analyze the current state map andsuggest lean techniques for possible improvements in order to reduce lead time and increasethroughput.Data AnalysisMapping the value stream always starts with the customer demand. With the productfamily, soft lead pigs, specified for the mapping, a product matrix (figurel) was made whichhelps see what family of products follow the same manufacturing process. Figure 2 and 3 aids in
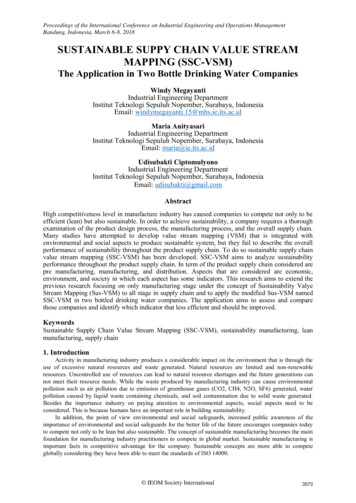
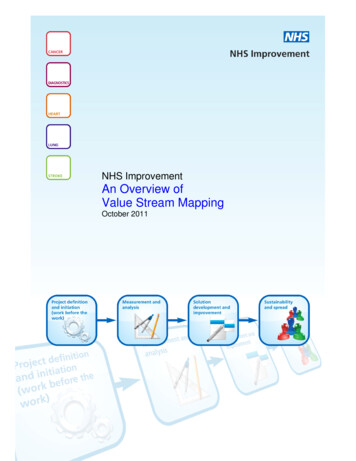
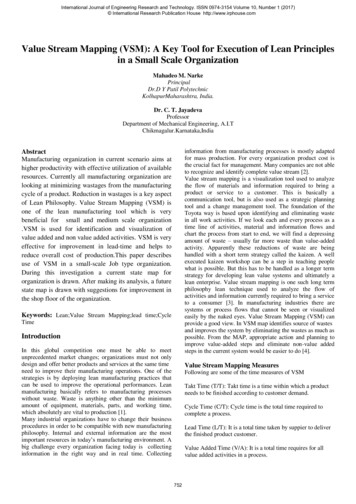
17the proper and accurate mapping of the current state map. An understanding of the value streammapping is enabled with the help of value stream symbols and definitions in appendix A. Figure4 below is the current state map followed by a detailed explanation.
18Figure 4. XYZ Current State MapSoft Lead PigsCu.uxnerDemand:250MM rbsJYf685KI lay28.5Kfhr.3.7 24)OK:b POl:s per 08);(laJrt T",. 3ag ";nutes)PO's6SIn.Product MIX Demand: ---- -----.; I .i ets; 6-.:33%No ",xed 'oads-.v.:S \\DailyCO'sMisc. RawMaterialDeir;Junk [)e,.------.,V.Custaners44K lb. loads11DbucllstNeekeqUv.Sched. . 03ITotalCJT 4.5 m·1Uptime·!lO%D.0542 days-- ---'M r; Rcv'gffiffiDaly COsI CoclJnLJ. r . 0212 ""·16.9da Lead Time 30.7 da Processing Time· 53.8 InXYZCO. INC.Soft Lead Pigs.Preliminary CurrentState
19As shown in the current state map above in figure 4, the focal point of all informationgathering and dissemination is the production control point. The focus of study for the valuestream mapping is soft lead pigs. Daily, weekly, monthly and annual orders are taken bycustomer service and entered in the ERP System. Thereafter, information is sent to the receivingdepartment as how much raw material, junk batteries need to be delivered at the receiving area.The production control also lets the supplier know on how much raw material is required soonafter the order is taken. One interesting factor to be noted is that the company receives the rawmaterial of junk batteries at the will of its customers and also buys them from other suppliers. Asit has no control over the amount ofjunk batteries it will receive from its customers there aretimes when the inventory for raw material is high. This is a big issue that that the company isfacing currently. There is not a proper scheduled flow ofjunk batteries from sources. When thedaily junk delivery schedule is obtained from the customer it is sent to the receiving department.Due to lack of proper flow of raw material, there is non-value added activity between receivingand raw material processing centre (RMPC). Thereafter, the processed raw material is taken tothe reverb furnace where all the solids and metal is converted into molten state. Then the metalfrom the reverb furnace is refined in kettles where the content of trace element is adjusted toproduce the desired alloy. Common products are soft lead and various alloys of hard lead. This issent for casting into pigs, billets and slugs and left for cooling. Then, the product is ready forshipping.Once the orders are received from the customers, it is entered into the ERP system. It isdetermined that the demand for soft lead pigs is 65% which is 250000000 pounds per year,685000 per day, and 28500 per hour. Takt time is 389 minutes or 6.5 hours which is calculatedby dividing the available production time 24 hours (1440 minutes) by total daily quantity
20required (3.7*200000 pounds pots per day). The total available production time per shift is 8hours (480 minutes). Two 15 minutes break and one 15 minutes lunch is not taken intoconsideration as everyone does not take break at the same time and there are operators availablefor service. Thereafter, the production control places the raw material order to the suppliers ofjunk batteries. The supply ofjunk batteries is at the will of the customer for which it sends aweekly or daily schedule to the receiving department. Each day, there are 32 trucks with rawmaterial coming into the company. Each truck carries 44000 pounds ofjunk batteries from whichonly 50% oflead is obtained. It is recorded that the non value added activity is 1.3 hours.The junk batteries are then transferred to the raw material processing centre where the cycletime is 4.3 hours and an uptime of 90% with nine operators working per shift. The cycle time iscalculated by dividing 190000 pounds of lead divided by 44000 lead per hour. There is aninventory equivalent of9.85 days which is calculated by total quantity oflead which is 6750000pounds divided by the quantity oflead required per day which is 685000 pounds. Thereafter, theprocessed raw material is sent to the reverb furnace to convert into molten state. The cycle timeis 6.8 hours which is derived by dividing total quantity ofmolten metal used which is 190000pounds by the quantity required per hour which is 28000 poun
Value Stream Mapping scrutinizes business processes from beginning to end and a visual representation map is drawn of every process involved in the material and information flows. Then a future state map is drawn to show how things should work for best competitive advantage. Value Stream Mapping