Transcription
International Journal of Engineering Research and Technology. ISSN 0974-3154 Volume 10, Number 1 (2017) International Research Publication House http://www.irphouse.comValue Stream Mapping (VSM): A Key Tool for Execution of Lean Principlesin a Small Scale OrganizationMahadeo M. NarkePrincipalDr.D Y Patil PolytechnicKolhapurMaharashtra, India.Dr. C. T. JayadevaProfessorDepartment of Mechanical Engineering, A.I.TChikmagalur.Karnataka,Indiainformation from manufacturing processes is mostly adaptedfor mass production. For every organization product cost isthe crucial fact for management. Many companies are not ableto recognize and identify complete value stream [2].Value stream mapping is a visualization tool used to analyzethe flow of materials and information required to bring aproduct or service to a customer. This is basically acommunication tool, but is also used as a strategic planningtool and a change management tool. The foundation of theToyota way is based upon identifying and eliminating wastein all work activities. If we look each and every process as atime line of activities, material and information flows andchart the process from start to end, we will find a depressingamount of waste – usually far more waste than value-addedactivity. Apparently these reductions of waste are beinghandled with a short term strategy called the kaizen. A wellexecuted kaizen workshop can be a step in teaching peoplewhat is possible. But this has to be handled as a longer termstrategy for developing lean value systems and ultimately alean enterprise. Value stream mapping is one such long termphilosophy lean technique used to analyze the flow ofactivities and information currently required to bring a serviceto a consumer [3]. In manufacturing industries there aresystems or process flows that cannot be seen or visualizedeasily by the naked eyes. Value Stream Mapping (VSM) canprovide a good view. In VSM map identifies source of wastesand improves the system by eliminating the wastes as much aspossible. From the MAP, appropriate action and planning toimprove value-added steps and eliminate non-value addedsteps in the current system would be easier to do [4].AbstractManufacturing organization in current scenario aims athigher productivity with effective utilization of availableresources. Currently all manufacturing organization arelooking at minimizing wastages from the manufacturingcycle of a product. Reduction in wastages is a key aspectof Lean Philosophy. Value Stream Mapping (VSM) isone of the lean manufacturing tool which is verybeneficial for small and medium scale organization.VSM is used for identification and visualization ofvalue added and non value added activities. VSM is veryeffective for improvement in lead-time and helps toreduce overall cost of production.This paper describesuse of VSM in a small-scale Job type organization.During this investigation a current state map fororganization is drawn. After making its analysis, a futurestate map is drawn with suggestions for improvement inthe shop floor of the organization.Keywords: Lean;Value Stream Mapping;lead time;CycleTimeIntroductionIn this global competition one must be able to meetunprecedented market changes; organizations must not onlydesign and offer better products and services at the same timeneed to improve their manufacturing operations. One of thestrategies is by deploying lean manufacturing practices thatcan be used to improve the operational performances. Leanmanufacturing basically refers to manufacturing processeswithout waste. Waste is anything other than the minimumamount of equipment, materials, parts, and working time,which absolutely are vital to production [1].Many industrial organizations have to change their businessprocedures in order to be compatible with new manufacturingphilosophy. Internal and external information are the mostimportant resources in today’s manufacturing environment. Abig challenge every organization facing today is collectinginformation in the right way and in real time. CollectingValue Stream Mapping MeasuresFollowing are some of the time measures of VSMTakt Time (T/T): Takt time is a time within which a productneeds to be finished according to customer demand.Cycle Time (C/T): Cycle time is the total time required tocomplete a process.Lead Time (L/T): It is a total time taken by suppier to deliverthe finished product customer.Value Added Time (V/A): It is a total time requires for allvalue added activities in a process.752
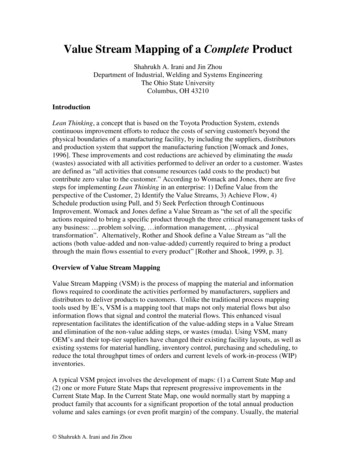
International Journal of Engineering Research and Technology. ISSN 0974-3154 Volume 10, Number 1 (2017) International Research Publication House http://www.irphouse.comFor production line, volume demands changes slightly everymonth. It means the takt time is also changing. The tablebelow showed the takt time production. Calculation refers onshifts with total of working hours per day.Non-Value Added Time (NV/A) It is a total time requires forall value added activities in a process.Implementation of VSM on Small Scale OrganizationBottlenecks or constraintsProcess Review and Data CollectionIn determining the presence of bottlenecks or constraints inthe line, at any point where the CT is more than the takt time,the process is potential a candidate, this could cause work inprogress (WIP) or extra processing time. CT in thisproduction line is the period required to complete one of anoperation, or to complete a function, job, or task from start tofinish. Cycle time is used in differentiating total duration of aprocess from its run time. In manufacturing, cycle time is thetotal time it takes to produce an order.Initially the existing method of the processes in the industryare studied through direct observation. Hardcopy informationis collected about the actual manufacturing activities, based ontheir Operations Manuals and the Standard OperatingProcedure. The Cycle Time or the Processing Time as per themanufacturing data is calculated . All the relevant data theProduction and In-process Quality Control (QC), for themonth is collected and compiled it in order to establish thebaseline for the data analysis. Further a line observation isconducted to monitor and to grasp the full understanding ofthe current practice at the production line as well as to identifythe types of the wastes in the process. The Changeover time,transportation time, queuing, handling and machine time dataduring the monitoring period is calculated.Cycle Time (CT) Machine Time Man TimeLead Time:Lead time can be defined as total time required tomanufacture an item, including order preparation time, queuetime, setup time, run time, move time, inspection time, andput away time. It is the time interval between the initiationand the completion of a production process. For make-toorder products, it is the time taken from release of an order toproduction and shipment. For make-to-stock products, it is thetime taken from the release of an order to production andreceipt into finished goods inventory.Following are some of the important steps, which are carriedout for implementation of VSMWork SequenceIn this step, the working time of the operators is determinedand the cycle time for each operator is calculated. Thedeviations in workers’ work are determined. In this process, itis observed that the cycle time of operations is below the takttime. For this reason, with drawing the work sequence andtime towards the takt time by the method of balancing theproduction line, the work division among the operators isrearranged.Cycle time calculation: Following tables shows cycle timecalculations for different components machined in theorganizationTakt Time CalculationIn manufacturing, takt time refers to frequency of a part orcomponent must be produced to meet customers’ demand.The formula used in the takt time calculation is the timeavailable (per shift) divided by the demand (per shift). Theaverage of monthly production is approx. 10000 jobs andmonthly work day is 26. So that the average number of dailyproduction is 384. The average of daily working time of thefactory is 28080 seconds. Out of this time, 3120 seconds isspared for tea breaks and the remaining 24960 seconds is pureworking time. The daily demand of the product by consumersis 400 for Industry under investigation.BRAKE FLANGE InspectionThis takes into account average productive, working time ofmanufacturing process. The importance of measuring takttime is due to the costs and inefficiencies factors in producingahead of demand, which include: Storage and retrieval of finished goods Premature purchasing of raw materials Premature spending on wages The cost of missed opportunities to produce other goods Capital costs for excess capacityBRAKE FLANGE NUMBER 1XXXXOPERTIONCYCLESEQUENCESHIFT HOURS 31601.11Inspection753&
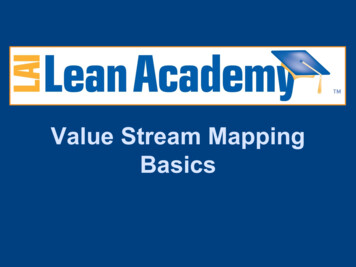
International Journal of Engineering Research and Technology. ISSN 0974-3154 Volume 10, Number 1 (2017) International Research Publication House http://www.irphouse.comM/CTRASMISSION 1467121125Takt Rate0.060.250.050.110.27Takt .60%Lead 37.50%83%75%33.34%66763067Cycle Time13.081.711.174.031.87C/O .691Lathe1602031.3VMC11013.754.361.32001.11BEARING AXEL 30Table 1 Current State Map CalculationsBRAKE FLANGE letime (sec)6876068760687606876068760The Analysis of the Current SituationIn the factory, casting comes from customerindustries after coming here the casting here machining isdone on casting and again send to customer industries. Thereare 31 workers in the production line of the yashwant. Theworking hours for them are from 12:00 to 12:00 & forYashwant. All the works under the production process is laborintensive. In the workplace, there are thirteen machines in thiscompany and production line on that the production is made.Currently, the total area of the workplace is 3400 sq ft forYashwant Industries. The 900 sq ft part of this area is for thestorage of component and the 1900 sq ft part is for productionline. The machining of a various component is arrangedaccording to lead time of the component.&Uptime CalculationThe formula of uptime is given below:Uptime (Available time-Total Changeover time per day)/Available timeThe available time for the company where we conducted ourresearch is calculated below:One 8 Hour shift 60 min /hr*8 hrs 480 min/shiftMachine set up Time 43 min/shiftMDI Meeting 10 min/shiftLunch and Prayer Time 30 min/shiftTea Break 15 min/shiftNet Operating Time 480-43-10-30-15 382 min/shiftNumber of shift 3.So the available time (382*3*60) sec 68760secIn the bellow table we have presented all uptime we havecalculated. We used these data in our current state VSM.Current State Situation and MapThe current situation and existing problems in theproduction line can be described as as follows: The Companydetermines the number of product to be produced on amonthly base. The number is approximately 10000. The3product of company has taken machining on CNC to outsidevendor. And also there is more wastage of time due to theygive a product after one or two days. And on the productionline at VMC some product has been stopped due machining ofother product. This is the most important problem. For thisreason, sometimes producing on time becomes a problem.While sometimes there is overproduction leading the excess toproduct to wait, in other days there is overtime because theproduct does not match up. In addition, another importantthing to mention is that the Company is not able to haveproduction breaks in order to decrease its financial expenses754
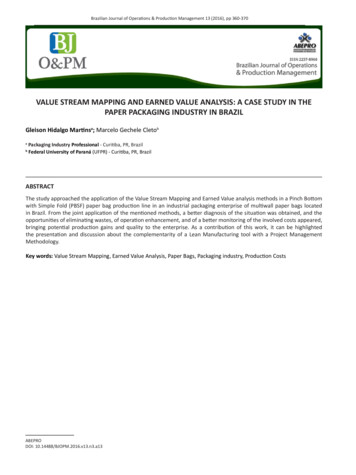
International Journal of Engineering Research and Technology. ISSN 0974-3154 Volume 10, Number 1 (2017) International Research Publication House http://www.irphouse.comand make the maintenance for the production. Fig representsthe map showing the value flow of current production atyashwant. In line with the value stream map and enumeratedobjectives mentions above, the following changes in theproduction process are made in order to improve the llingMilling-VMC 1Milling-VMC 2Lathe-CNCMilling-CNCInspectionTable 2 Future State Map apacity781351196674200133Takt Rate0.060.250.110.050.050.270.27Coclusion:Takt 56%3.613.50%3.620.30%Lead 346744133131.53.51110.54.56110.1511110.15Value Stream Mapping (VSM) as a key tool for execution ofLean Principles in a Small Scale Organization has beendescribed in this paper. During the investigation current statemap and future state map are drawn to visualize a perfectpicture of organization. Current investigation reveals thatVSM tool is very important technique to visualize the currentscenario which in turns helps to remove unnecessary thingsfrom the manufacturing set up.This can help manufacturingorganization to improve and regulate work environment. Fromcurrent state and future map calculations corrective actionshave been taken whichleads in reduction of lead time by 3 %.UptimeEPEICycleTimeC/O 133[1] Nor Azian Abdul Rahman, Sariwati Mohd Sharif andMashitah Mohamed Esa,Lean Manufacturing Case Study withKanban System Implementation , Procedia Economics andFinance ,7 ( 2013 ) 174 –180.[2] Danijela Gracanin , Borut Buchmeister, and BojanLalic,Using Cost-Time Profile for Value Stream ptimization,Procedia Engineering 69 ( 2014 ) 1225 – 1231.[3] Kannan Jayaraman, VALUE STREAM MAPPINGAdapting Lean Management Principle in the ESO, ,L&TIntegrated Engineering Services,pp3-4,2010.[4] Nor K. M. Khalid, Ahmad Y. B. Hashim, and Mohd R.Salleh ,On Value Stream Mapping and Its IndustrialSignificance, Journal of Industrial and Intelligent InformationVol. 2, No. 2, June 2014 .Lead time resultCurrent state lead time 15 daysFuture state lead time 10 days% reduction in lead time 15%19.4. TAKTTakt time Available Time/Demand 4320/28 154 dayTakt rate Demand/Available Time 64.8%/dayMin. no. of operators Available Time*18/Demand 28*18*60/4320 7 operators755
International Journal of Engineering Research and Technology. ISSN 0974-3154 Volume 10, Number 1 (2017) International Research Publication House http://www.irphouse.comFigure 2 Future State mapFigure 1 Curret State Map756
easily by the naked eyes. Value Stream Mapping (VSM) can provide a good view. In VSM map identifies source of wastes . and improves the system by eliminating the wastes as much as possible. From the MAP, appropriate action and planning to improve value-added steps and eliminate non-value add