Transcription
A HISTORICAL AND STATISTICAL COMPARISON OF"TORNADO ALLEY" TO "DIXIE ALLEY"John P. GaganNational Weather ServiceSpringfield, MissouriAlan GerardNational Weather ServiceJackson, MississippiJohn GordonNational Weather ServiceLouisville, KentuckyAbstractThe media and public frequently use the term “tornado alley,” an unofficial term which is used todescribe various parts of the United States that are perceived to have a high incidence of tornadooccurrence. This paper examined the history of the term “Tornado Alley,” as well as the lesserknown term “Dixie Alley.” A basic statistical analysis of the temporal and spatial occurrence oftornadoes and tornado-related casualties was done in each of these areas, both long term and inthe recent years following the modernization of the National Weather Service.Corresponding Author: Alan GerardNational Weather Service234 Weather Service DriveJackson, MS 39232email: Alan.E.Gerard@noaa.gov
Gagan, et al.1. History and Terminologya. TornadoTornadoes are one of the most talked about weatherphenomena and certainly one of the most destructive.The history of the word tornado took several twistsbefore it landed with its current meaning in the UnitedStates. Ultimately, it comes from the Spanish word forthunderstorm, tronada, and then turned into ternado byEnglish sailors in the 1500s to mean “a violent tropicalstorm.” In pop-culture, movies such as “The Wizard ofOz” in 1939, “Mr. and Mrs. Bridge” in 1990, and “Twister”in 1996 have certainly increased the public’s awareness.Public awareness has been fueled with impressive tornadovideos, including a television crew hiding underneath aKansas turnpike bridge on 26 April 1991, the 3 May 1999video from the Moore, Oklahoma F5 tornado, and the 24June 2003 National Geographic video from inside an F3tornado near Manchester, South Dakota.b. “Tornado Alley”Many Americans are familiar with the widely usedterm “Tornado Alley.” Generally speaking, this is an areaof the Great Plains and Midwest which is commonlythought of as the location for peak tornado occurrence inthe United States. However, a less commonly known termis that of “Dixie Alley.” This generally refers to that part ofthe southeastern United States which is prone to tornadodevelopment. This manuscript will take an in depth lookat the similarities and differences between “TornadoAlley” and “Dixie Alley.”If you use any of the popular internet search enginesand type in “tornado alley location”, you will come up withover 400,000 hits. Of the first 100 internet search resultsor so, the location for tornado alley varies greatly. Some ofthese include: 146“Region in the middle of the United States wheremore tornadoes occur than anywhere else in theworld.”“Most tornadoes in the United States form in anarea called ‘Tornado Alley.’ This area includesparts of Texas, Oklahoma, Kansas, and Nebraska.”“By most definitions, ‘Tornado Alley’ extendsfrom north-central Texas through centralOklahoma, Kansas, and Nebraska into theDakotas, the north-south line where moist anddry air collide time after time.”“The United States ‘Tornado Alley’ stretches fromnorthwest Texas across Oklahoma and throughnortheast Kansas.”National Weather Digest “States included in ‘Tornado Alley’ are Texas,Colorado, Kansas, Nebraska, Oklahoma, Arkansas,Illinois, Indiana, and Missouri.”“An L-shape region, which stretches from westernIowa down through Nebraska and Kansas tosouthern Oklahoma and then over Arkansas andLouisiana to southeastern Mississippi.”Some publications that address “tornado alley” included: “The primary area of the U.S. in which significanttornadoes occur most often is in an L-shapedregion from Iowa to Oklahoma to Mississippi,with the highest threat in Oklahoma.”(Concannon et al. 2000)“Texas, Oklahoma, Kansas, Nebraska, Iowa,Missouri, Arkansas, Louisiana were analyzedseparately. This region essentially contains theproverbial ‘tornado alley’ where tornadoes aremost prevalent.” (Schaefer and Tatom1999)Historically, the term “Tornado Alley” has been usedloosely, and the locations indicated are often based onpersonal perception rather than scientific data (Grazulis1993). The authors personally spoke to Dr. CharlesDoswell III and Dr. Howard Bluestein from the Universityof Oklahoma, Tom Grazulis from The Tornado Project,retired Storm Prediction Center (SPC) Director Dr. JoeSchaefer, retired SPC Science and Operations OfficerBob Johns, retired National Severe Storms ForecastCenter (NSSFC) Director Fred Ostby, and former NSSFCDirector Allen Pearson. Nobody could provide a definitiveanswer to the origin of “Tornado Alley.” Most of theaforementioned referenced Snoden Flora’s 1954 tornadoclimatology, although we could not locate a reference inFlora’s manuscript. The authors conducted a thoroughliterary search which entailed numerous papers fromevery decade from the 1950s through today. This includedseveral papers from Snoden Flora, Dr. Theodore Fujita,and Dr. Howard Bluestein which offered no insights todefinitive location or origin.The only “tornado alley” reference that the authorscould obtain was from an article in Take-off, the Tinker,OK Air Force Base (AFB) newspaper, which appeared onJanuary 16, 1953 [Available online at: html]. The articlestated: “On Feb 15, 1952, Fawbush and Miller set up a newproject called, ‘Tornado Alley,’ in which a concentratedstudy of severe weather activity was made over an areaextending from Lubbock, Texas to Eastern Colorado andNebraska. This was done in stages, the first being fromLubbock, Texas to Enid, Oklahoma, and the second fromEnid, Oklahoma to the Nebraska line.”
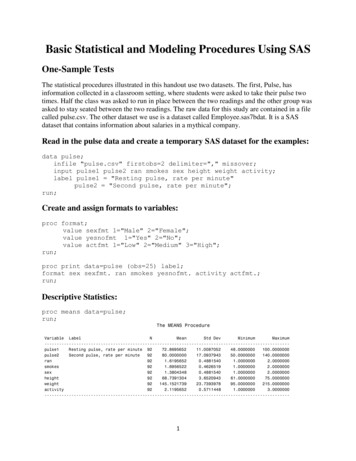
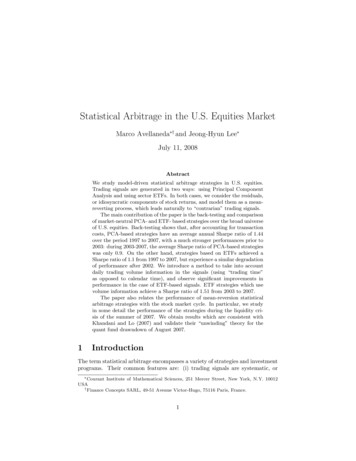
A Historical and Statistical Comparison of "Tornado Alley" to "Dixie Alley"c. “Dixie Alley”Regarding the origin and location of “Dixie Alley,”the authors once again consulted those tornado expertspreviously cited, and researched numerous previouspublications. Most experts referred the authors to Dr.Harold Brooks, but Dr. Brooks told us explicitly that hedid not coin the phrase. The only source that knew theorigin of “Dixie Alley” was former NSSFC Director AllenPearson. Mr. Pearson explained that he personally coinedthe phrase after working the Mississippi Delta outbreakof 21 February 1971. This event had 10 long-tracktornadoes that resulted in 121 deaths and over 1,500injuries. Pearson compared that event with the ArkansasTennessee outbreak of 21-22 March 1952, where 28tornadoes struck, killing over 200 people. Both eventswere in the south, and Pearson coined the phrase “DixieAlley” in 1971. One of the few websites defining DixieAlley was from an article in USA Today Weather [Availableonline at: 9/ndstue09.htm] which stated: “A thirdtornado focus is the so-called ‘Dixie Alley’, which runsfrom northeast Texas to northern Alabama, then skipsover the southern Appalachians and reforms in NorthCarolina.”Since there was such limited formal documentation,it was difficult to compare the two tornado alleys. AsGrazulis (1993) stated in Significant Tornadoes, 16801991 compendium, there is more than one tornado alley.“Any area that seems to experience above average tornadofrequency is eventually labeled a ‘tornado alley.’ There aredozens of such regions.” There is also evidence of smallertornado alleys across the United States based on a longtrack F3 to F5 tornado climatology study from 1880 to2003 (Broyles and Crosbie 2004). This paper will bridgethe gap between perception and reality by offering a basicstatistical analysis of the frequency of tornadoes in the“Dixie Alley.” In an effort to support the validity of a “DixieAlley,” these statistics will be compared to those from“Tornado Alley.”perceptions. Tornado Alley, hereafter referred to as thePlains Tornado Alley (PTA), includes all of Nebraska,Kansas and Oklahoma, and a large portion of northernand central Texas (Fig. 1).The existence of a Dixie Tornado Alley (DTA) hasbeen an idea cultivated through the observations ofmeteorological professionals who have lived in thesouthern states and those with severe weather forecastingexperience. The first statistical analysis suggesting thevalidity of a DTA was provided by Brooks et al. (2003)severe thunderstorm climatology. A higher frequency oftornadoes was located from Louisiana through much ofMississippi and Alabama, when accounting for the meannumber of days with tornadoes from October throughDecember. Broyles and Crosbie (2004) investigatedthe frequency of long-track (path length greater than25 miles) violent tornadoes (rated F3 to F5) across theUnited States from 1880 to 2003. They discovered thattwo of the most prominent tornado alleys were locatedin central Mississippi and an area extending fromwestern Tennessee into northern portions of Mississippiand Alabama. With these discoveries in mind, the DTAproposed by this investigation includes all of Arkansas,Louisiana, Mississippi and Alabama, western and centralTennessee, and northern and central Georgia (Fig. 1).b. MethodologyTornado data for both the PTA and DTA weregathered from the Storm Prediction Center’s ONETORdatabase [Available online at: http://www.spc.noaa.gov/wcm/#data]. This database provides detail ranging fromthe physical attributes of each tornado (e.g., location,damage rating, path length and width), to the effects of2. Tornado Alley and Dixie Alley – A HistoricalStudya. BackgroundThe existence of “Tornado Alley” has been widelyaccepted by the meteorological community for decades,though as discussed in the introduction section, itsexact spatial extent has had numerous interpretations.Without a definitive area to reference, the TornadoAlley referred to in this text should be considered theauthors’ interpretation based on a collective of publishedFig. 1. A map outlining the Plains Tornado Alley, in red, andthe Dixie Tornado Alley, in green.Volume 34 Number 2 December 2010147
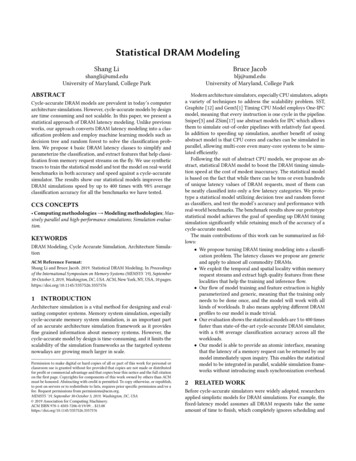
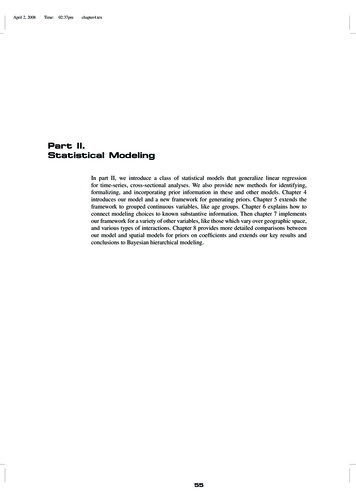
Gagan, et al.the tornado (e.g., injuries and fatalities). The ONETORdatabase was developed by counts of tornado records, notindividual tornadoes [Available online at: http://www.spc.noaa.gov/wcm/SPC severe database description.pdf] . A vast majority of the records within the databaseare counts of individual tornadoes; however, duplicaterecords for a tornado exist within the database whena tornado crosses one or more state lines. Therefore,in order to develop a data set of individual tornadoes,records within the ONETOR database were pared downto exclude duplicate counts of tornadoes. In addition,tornado segments outside of the boundaries of the PTAand DTA were excluded and tornadoes that moved fromone alley to another were segmented into two separateevents (one for each alley). For this study, reports oftornadoes from 1950 through 2007 were interrogated.From this subset of the ONETOR database, raw tornadostatistics for each alley were extracted, including thefrequency of all tornadoes, the frequency of strong andviolent tornadoes (F2/EF2 or greater on the Fujita Scale),the number of casualties, and the frequency of killerstrong and violent tornadoes. In order to draw a moreaccurate one-to-one comparison of the DTA and the PTA,statistics have been normalized for both spatial areaand population. The PTA spans 407,734 mi2, dwarfingthe DTA, which covers 276,890 mi2. According to the2000 United States Census [Available online at: http://quickfacts.census.gov/qfd/index.html, the population ofthe DTA was 24,948,345, while the population of the PTAwas 17,824,023.c. Comparison of the Dixie Tornado Alley and the PlainsTornado AlleyWithout question, the PTA is second to none when itcomes to overall tornado frequency. Over 13,500 tornadoeswere reported in the PTA, with over 7500 tornadoesreported in the DTA. However, when considering strongand violent tornadoes (rated F2/EF2 to F5/EF5 on theFujita scale), the annual frequency of tornadoes is muchmore comparable between alleys. Over 2850 strongand violent tornadoes were reported in the PTA, with alittle over 2450 reported in the DTA. Normalizing thesefrequencies by area (10,000 mi2) produces similar resultsfor the overall frequency of tornadoes. The normalizedfrequency of all tornadoes for the PTA outpaces that ofthe DTA, with 332 and 276 tornadoes per 10,000 mi2,respectively. For strong and violent tornadoes, however,the DTA has a higher frequency than the PTA, with 89 and70 tornadoes per 10,000 mi2, respectively.While both the PTA and DTA observe similarfrequencies of strong and violent tornadoes, each alleyhas unique distributions of strong and violent tornado148 National Weather Digestreports by month (Fig. 2) as well as by the time of day (Fig.3). In the PTA, 72% of the observed strong and violenttornadoes occur during the three-month period fromApril through June. In the DTA, only 38% of the observedstrong and violent tornadoes have been observed fromApril through June. In the DTA the risk for strong andviolent tornadoes is spread out over two distinct seasons.Like the PTA, there is a maximum in the frequency oftornadoes during the spring season; however, there isa prominent, secondary peak in tornado frequency inNovember. The differences in the frequency of strong andviolent tornadoes are most pronounced in the monthsfrom October through February. In the DTA, 40% ofstrong and violent tornadoes have occurred during thistime frame, while only 10% have occurred in the PTA.When considering the time of day (Fig. 3), it is evidentthat the vast majority of strong and violent tornadoesoccur during the afternoon and early evening hours (12PM to 9 PM, Central Standard Time). Seventy-six percentand 59% of all strong and violent tornadoes occur duringthis time frame in the PTA and DTA, respectively. Duringthe overnight hours (9 PM to 7 AM CST), the frequencyof strong and violent tornadoes in the PTA decreasessubstantially to 19%. While the DTA also shows a decreasein frequency during the overnight hours, 29% of strongand violent tornadoes occur during this time frame.Casualties sustained by each tornado alley also varyconsiderably in both amount and timing. While the DTAis smaller in geographic coverage as compared to thePTA, over 7 million more persons reside in the DTA thanthe PTA, per the U.S. Census Bureau [Available online ures4-5 highlight the distribution of fatalities and injuries forthe DTA and PTA by month. A higher incidence of fatalitiesand injuries have been reported in the DTA as comparedto the PTA (in the DTA 1705 fatalities and 26,026 injurieswere reported, while in the PTA nine hundred ninety-onefatalities and 14,709 injuries were reported.) One wouldexpect that the DTA would incur more casualties given thata larger population lives within this alley. Normalizingthe amount of casualties by 100,000 people confirms thatthe DTA has been slightly more dangerous than the PTA.The DTA has observed 6.8 fatalities and 104 injuries per100,000 people, while the PTA has observed 5.6 fatalitiesand 83 injuries per 100,000 people. As expected, themajority of the reported casualties in the PTA, 88% offatalities and 84% of injuries, occur between April andJune. During this same time frame, only 35% of fatalitiesand 38% of injuries occur in the DTA. Far more fatalities(64%) and injuries (61%) occur from the period Octoberthrough March in the DTA.Killer strong and violent tornadoes (Fig. 6) are mostcommon in the DTA. Three hundred seventy-one killer
A Historical and Statistical Comparison of "Tornado Alley" to "Dixie Alley"Fig. 2. The frequency of strong and violent tornadoes by month in the Plains Tornado Alley(red) and the Dixie Tornado Alley (green).Fig. 3. The frequency of strong and violent tornadoes in the Plains Tornado Alley (red) and theDixie Tornado Alley (green) by hour (CST).Volume 34 Number 2 December 2010149
Gagan, et al.Fig. 4. The frequency of all tornado-related fatalities by month in the Plains Tornado Alley (red)and the Dixie Tornado Alley (green).Fig. 5. The frequency of all tornado-related injuries by month in the Plains Tornado Alley (red)and the Dixie Tornado Alley (green).150 National Weather Digest
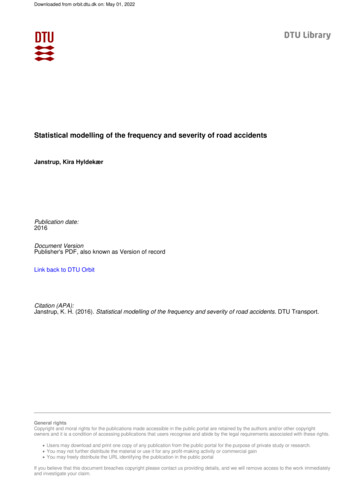
A Historical and Statistical Comparison of "Tornado Alley" to "Dixie Alley"tornadoes have been observed in the DTA, with 205 inthe PTA. Normalizing the frequency of killer strong andviolent tornadoes by area (Fig. 7) further demonstratesthe disparity between the DTA and PTA. In the monthsspanning October through March, 8.4 and 1.0 killerstrong and violent tornadoes were observed per 10,000mi2 in the DTA and PTA, respectively. Meanwhile, in themonths spanning April through June, 4.7 and 3.9 strongand violent tornadoes were observed per 10,000 mi2 inthe DTA and PTA, respectively. While both the DTA andPTA exhibit a maximum risk of killer strong and violenttornadoes around April, the DTA demonstrates a muchmore substantial risk during the late fall and wintermonths.Figure 8 highlights the distribution of killer strong andviolent tornadoes by time of day. As is the case with allstrong and violent tornadoes, the vast majority of killerstrong and violent tornadoes occur during the afternoonand early evening hours (12 PM to 9 PM Central StandardTime). Seventy-six percent and 62% of killer strong andviolent tornadoes occur during this time frame in thePTA and DTA, respectively. During the overnight hours (9PM to 7 AM CST), there is a noticeable difference in thefrequency of killer strong and violent tornadoes. While21% of killer strong and violent tornadoes occur duringthe overnight in the PTA, an alarming 34% of killer strongand violent tornadoes occur during the overnight in theDTA. The DTA has nearly twice the number of incidenceof strong/violent tornadoes during the Midnight to Noontime period than the PTA, and this obviously includesthe timeframe when most people are asleep and morevulnerable to tornado related injury or death.3. Post-NWS Modernization StatisticsIn addition to the long-range statistics discussed inthe previous section, a separate analysis was also madefor the time period after the modernization of the NWS(post-modernization era, or PME). The rationale forlooking at this time period separately is that with theadvent of operational Doppler radar, NWS personnel aremore aware of mesocyclones over sparsely populatedareas, which prior to Doppler radar might have goneundetected. These mesocyclones would be capable ofproducing tornadoes which were more likely to havegone unreported during the conventional radar era. Thisis particularly the case for the DTA where storm spottingis extremely difficult due to forestation, hilly terrain, andthe diffculty in storm spotting due to lower cloud basesand more frequent night time events. Therefore, theDoppler time period might yield different results thanthe relatively longer time frame when only conventionalradar was generally used. Of course, the much shorterDoppler period of analysis introduces an inherent errorsource that would most likely be smoothed in a longerterm analysis. Thus, this drawback must be kept in mindwhen drawing any conclusions from these results.The methodology used in calculating the postmodernization statistics differs from that previouslydescribed in a few key ways. First, the period evaluatedFig. 6. The frequency of killer strong and violent tornadoes by month in the Plains TornadoAlley (red) and the Dixie Tornado Alley (green).Volume 34 Number 2 December 2010151
Gagan, et al.Fig. 7. The frequency of killer strong and violent tornadoes by month, normalized by area(per10,000 mi2) in the Plains Tornado Alley (red) and the Dixie Tornado Alley (green).Fig. 8. The frequency of killer strong and violent tornadoes in the Plains Tornado Alley (red)and the Dixie Tornado Alley (green) by hour (CST).152 National Weather Digest
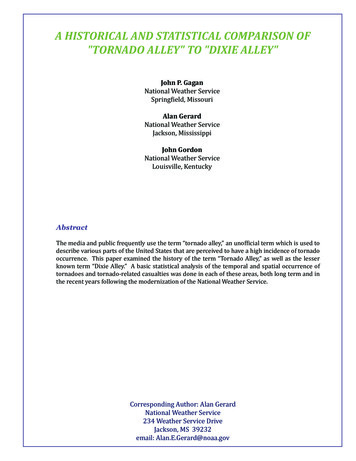
A Historical and Statistical Comparison of "Tornado Alley" to "Dixie Alley"is a nine-year period from 1998 to 2006. Selection of actually increases again in January before decreasing intothis time period is of course somewhat subjective, but February and March before reaching its spring peak inbased on the authors’ experience it was felt that 1998 April. This trend is in contrast to the longer term statisticsbest demarcated the full modernization of the NWS which show a relative minimum in December and Januaryfrom a severe convection perspective due to the full before increasing up to the peak in April.implementation of the Weather Surveillance Radar (WSRComparing the two alleys’ traces reveals the magnitude88D ) system. Secondly, because of the desire to look at of the PTA spring peak was greater than that of DTA,verification statistics in this part of the study as well as while the fall peak is clearly much larger (by nearly anpotential concerns about the ONETOR database at the order of magnitude) in the DTA than the PTA. While thevery end of the study period, NWS Storm Data [Available PTA trace reaches zero or near zero for several monthsonline at http://www4.ncdc.noaa.gov/cgi-win/wwcgi. of the year (July through September, November throughdll?wwEvent Storms] was used to calculate the statistics February), the incidence of strong tornadoes during therather than ONETOR. This means that instead of looking PME only approached or reached zero in DTA during theat actual tornadoes, we are looking at county-based summer months. Tropical cyclone landfalls increased thetornado events. This introduces a potential bias since incidence of tornadoes during the late summer, and coolareas with more numerous, smaller counties will likely season tornado events led to strong tornado occurrencehave somewhat more reports than those areas with at a rate of at or above .05 per 10,000 mi2 for all winterfewer but larger counties. Because most tornado tracks and spring months other than December. The total annualare relatively short ( 20 km), it is expected that this bias incidence of strong tornado events per 10,000 mi2 wasshould be relatively minimal, but could result in numbers 1.74 for DTA versus 0.81 for PTA.that are slightly tilted toward the DTA region, whereWhile there exists potential biases or errors in thecounties are generally smaller than in the PTA area.data which might lead to an artificial inflation of theThe overall trend of tornado reports during the PME number of strong tornado events in DTA versus PTAwas not unexpected given the results found from the (greater population density, possibility of more active timelonger term study. Overall, there were about 50% more period, and smaller counties), the fact that the DTA had anreports of strong tornadoes from the DTA region (384) incidence nearly three times as great as that of PTA seemsthan PTA (265). When looking at killer tornadoes, the to clearly support the premise that strong tornadoes are atdominance of the DTA region is very clear. A total of 79 least as common in the DTA region as PTA. Perhaps morekiller tornadoes occurred in this region during the period importantly, the much larger number of killer tornadoesof study, compared to only 24 in PTA. The number in the in the DTA region would indicate that a combination of theDTA comprised more than one-third (36.9%) of all killer rate of strong tornado occurrence combined with othertornadoes in the United States during the 1998 to 2006 factors (e.g., both meteorological and socioeconomic asperiod, while correspondingly the killerStrong Tornadoes 98-06tornadoes in PTA comprised only 12%of the national total.Figure 9 shows the annual trend ofstrong tornadoes in both alleys duringthe PME period, using the simplenormalization of dividing the numberof tornadoes by the area of each alley(expressed as tornadoes per 10,000mi2). As can be seen, both alleys show adistinct maximum in the spring months,with the DTA’s decreasing after Apriland PTA’s decreasing after May, andDTA’s larger in magnitude. However,DTA shows a pronounced fall maximumin November, much larger than PTA’sspring maximum, which the PTA doesnot show in any significant manner(there is a small increase in frequency Fig. 9. The per annum frequency of strong and violent tornadoes by month,during October). After a decrease from normalized by area (per 10,000 mi2), for the Plains (red) and Dixie Alley (green)November into December, the DTA trace areas, for the PME (1998-2006).Volume 34 Number 2 December 2010153
Gagan, et al.discussed in the next section) means that the DTA regionwas much more susceptible to tornado-induced loss of lifethan the PTA region.4. ConclusionThe purpose of this work is not to provoke scholarlyarguments over the “champion” area as far as tornadoincidence. Rather, it is to show that public and mediaperception is just that, perception, and that reality is oftenmore complicated. Recent outstanding work by Ashley(2007) and Ashley et al. (2008) has helped to illustratethe complexity of the United States’ tornado vulnerability,and the potential for the mid-South and Southeast to be“overlooked” by the focus on “Tornado Alley,” includingdiscussions of the potential socioeconomic factors (e.g.,higher incidence of mobile home use) which will not berestated here. While the various biases associated withtornado reporting make any one-to-one comparisonbetween “Tornado Alley” and “Dixie Alley” difficult atbest, the statistics outlined in this paper make severalclear pointsFirst, both the monthly and diurnal distributions oftornado incidence are much different in the DTA than inthe PTA. In the DTA, the risk of a strong or killer tornadoon the day of peak risk is substantially less than the riskon the peak day in the PTA. However, this peak is muchless pronounced in the DTA, and the annual incidence inthe DTA can be viewed as more of a persistent, moderaterisk through much of the year rather than an extreme riskduring a more confined “season” as is observed in the PTA.When the more sustained risk of the DTA is added up overan entire year, it seems clear that even when taking anypotential data biases into account, the DTA has at least asgreat a risk of strong/violent tornadoes as the PTA, andcertainly has a greater risk of killer tornadoes than thePTA.Additionally, the DTA has about a 50% greater risk ofstrong tornadoes during the overnight hours, with over athird of its killer tornadoes occurring between 9 pm and7 am. The annual and diurnal distribution of the tornadorisk in the DTA has a substantial impact on preparednessand warning dissemination efforts in this area. Clearly,residents and emergency personnel in the DTA mustmaintain a level of tornado preparedness throughoutmost of the year, which contrasts to the PTA in which theNWS, emergency management and media can focus theirpreparedness activities around the “tornado season” oflate March through June (although occasional atpyicalevents do occur outside of the “season” here as well).Warning dissemination and preparedness activities inthe DTA must also account for the greater frequency ofovernight tornadic activity as well, although clearly there154National Weather Digestis sufficient risk of such events in the PTA to ensure thatresidents there also do not discount the risk of nighttimetornadoes. Another concern is that cool season tornadoesare often moving at a greater speed than storms in thewarm season, potentially leading to less time for peopleto take shelter.The challenge facing operational meteorologists inthe DTA can be summed up looking at statistics from thelast 20 years. Between 1986 and 2005, SVRPlot [SPConline storm report program, available at: ] shows that 504people have been killed by tornadoes in the two “alleys”combined. Seventy-five percent of these fatalities (377)occurred in the DTA. On average, a strong tornado in theDTA is associated with 0.44 fatalities, more than twice therate as in the PTA (0.18). Also, NWS verification statisticsduring this time period show that the probability ofdetection (POD) and lead time (LT) for strong tornadoesis greater in the PTA than the DTA (POD: .80 versus .68;LT: 13.6 min versus 10.2 min).The disparity in verification skill is likely in largepart due to the inability to effectively spot storms in thesoutheast United States due to heavy forestation, and itshould be noted that this disparity has shrunk markedlysince NWS modernization introduced Doppler radar intowarning operations [POD: .75; (1996-2005) versus .45(1986-1995); LT: 12.6 min versus 6.1 min]. Still, tornadoevents associated with large numbers of fatalities continueto be a serious risk in the DTA even with improvedwarnings, as shown by the 2008 Super Tuesday outbreak.This outbreak killed 57 people, nearly all in the DTA,even with advance warnings issued for all of the killertornadoes. Clearly, if the fatality rate is to be decreasedsubstantially in the DTA, improved meteorological scienceand warnings will not be sufficient, at least not in the nearterm. At least as important will be a commitment by theoperational meteorology community to better understandpublic response through an increased focus on socialsciences, as well as increased understanding among thepublic and government officials of the significant riskfrom tornadoes faced by the region.AcknowledgmentsThe authors would like to thank the reviewers for theirthoughtful comments which improved the quality ofthis paper. We also would like to thank Tom Grazulisfrom The Tornado Project for his assistance with thehistorical part of this work. Finally, we would like tothank Jon Davies for his encouragement to formalizethis study.
A Historical and Statistical Comparison of "Tornado Alley" to "Dixie Alley"AuthorsReferencesJohn P. Gagan is currently a Senior Forecaster at theNational Weather Service (NWS) Forecast Office inSpringfield, MO. He received his Master of Science degreein Meteorology from Saint Louis University in 2001, withresearch focused on heavy rainfall and the role of systempropagation. John began his weather career as a mediumra
pdf] . A vast majority of the records within the database are counts of individual tornadoes; however, duplicate records for a tornado exist within the database when a tornado crosses one or more state lines. Therefore, in order to develop a data set of individual torn