Transcription
Statistical DRAM ModelingShang LiBruce Jacobshangli@umd.eduUniversity of Maryland, College Parkblj@umd.eduUniversity of Maryland, College ParkABSTRACTCycle-accurate DRAM models are prevalent in today’s computerarchitecture simulations. However, cycle-accurate models by designare time consuming and not scalable. In this paper, we present astatistical approach of DRAM latency modeling. Unlike previousworks, our approach converts DRAM latency modeling into a classification problem and employ machine learning models such asdecision tree and random forest to solve the classification problem. We propose 4 basic DRAM latency classes to simplify andparameterize the classification, and extract features that help classification from memory request streams on the fly. We use synthetictraces to train the statistical model and test the model on real-worldbenchmarks in both accuracy and speed against a cycle-accuratesimulator. The results show our statistical models improves theDRAM simulations speed by up to 400 times with 98% averageclassification accuracy for all the benchmarks we have tested.CCS CONCEPTS Computing methodologies Modeling methodologies; Massively parallel and high-performance simulations; Simulation evaluation.KEYWORDSDRAM Modeling, Cycle Accurate Simulation, Architecture SimulationACM Reference Format:Shang Li and Bruce Jacob. 2019. Statistical DRAM Modeling. In Proceedingsof the International Symposium on Memory Systems (MEMSYS ’19), September30-October 3, 2019, Washington, DC, USA. ACM, New York, NY, USA, 10 ODUCTIONArchitecture simulation is a vital method for designing and evaluating computer systems. Memory system simulation, especiallycycle-accurate memory system simulation, is an important partof an accurate architecture simulation framework as it providesfine grained information about memory systems. However, thecycle-accurate model by design is time-consuming, and it limits thescalability of the simulation frameworks as the targeted systemsnowadays are growing much larger in scale.Permission to make digital or hard copies of all or part of this work for personal orclassroom use is granted without fee provided that copies are not made or distributedfor profit or commercial advantage and that copies bear this notice and the full citationon the first page. Copyrights for components of this work owned by others than ACMmust be honored. Abstracting with credit is permitted. To copy otherwise, or republish,to post on servers or to redistribute to lists, requires prior specific permission and/or afee. Request permissions from permissions@acm.org.MEMSYS ’19, September 30-October 3, 2019, Washington, DC, USA 2019 Association for Computing Machinery.ACM ISBN 978-1-4503-7206-0/19/09. . . 15.00https://doi.org/10.1145/3357526.3357576Modern architecture simulators, especially CPU simulators, adoptsa variety of techniques to address the scalability problem. SST,Graphite [12] and Gem5[1] Timing CPU Model employs One-IPCmodel, meaning that every instruction is one cycle in the pipeline.Sniper[3] and ZSim[17] use abstract models for IPC which allowsthem to simulate out-of-order pipelines with relatively fast speed.In addition to speeding up simulation, another benefit of usingabstract model is that CPU cores and caches can be simulated inparallel, allowing multi-core even many-core systems to be simulated efficiently.Following the suit of abstract CPU models, we propose an abstract, statistical DRAM model to boost the DRAM timing simulation speed at the cost of modest inaccuracy. The statistical modelis based on the fact that while there can be tens or even hundredsof unique latency values of DRAM requests, most of them canbe neatly classified into only a few latency categories. We prototype a statistical model utilizing decision tree and random forestas classifiers, and test the model’s accuracy and performance withreal-world benchmarks. The benchmark results show our prototypestatistical model achieves the goal of speeding up DRAM timingsimulation significantly while retaining much of the accuracy of acycle-accurate model.The main contributions of this work can be summarized as follows: We propose turning DRAM timing modeling into a classification problem. The latency classes we propose are genericand apply to almost all commodity DRAMs. We exploit the temporal and spatial locality within memoryrequest streams and extract high quality features from theselocalities that help the training and inference flow. Our flow of model training and feature extraction is highlyparameterized and generic, meaning that the training onlyneeds to be done once, and the model will work with allkinds of workloads. It also means applying different DRAMprofiles to our model is made trivial. Our evaluation shows the statistical models are 5 to 400 timesfaster than state-of-the-art cycle-accurate DRAM simulator,with a 0.98 average classification accuracy across all theworkloads. Our model is able to provide an atomic interface, meaningthat the latency of a memory request can be returned by ourmodel immediately upon inquiry. This enables the statisticalmodel to be integrated in parallel, scalable simulation frameworks without introducing much synchronization overhead.2RELATED WORKBefore cycle-accurate simulators were widely adopted, researchersapplied simplistic models for DRAM simulations. For example, thefixed-latency model assumes all DRAM requests take the sameamount of time to finish, which completely ignores scheduling and
MEMSYS ’19, September 30-October 3, 2019, Washington, DC, USAShang Li and Bruce Jacobqueuing contentions that may cause significantly longer latency.There are also queued models that account for the queuing delay,but they fails to comply with various DRAM timing constraints.Previous studies such as [18] have shown that such simplistic models suffer from low accuracy compared to cycle-accurate DRAMmodels.Then came along cycle accurate DRAM models, such as [4, 7,9, 16, 20] and DRAMsim3. These cycle-accurate DRAM simulatorsimproved DRAM simulation accuracy, some are also validated byhardware models, but as we have shown, they started to lag thesimulation performance.Other than cycle-accurate models, there are also event basedmodels such as[6, 8]. Event based models do not strictly enforceDRAM timing constraints, and can accelerate the simulation if theevents are not frequent. But just as [8] pointed out, when memoryworkloads gets more intensive, memory events will be as frequentas every cycle, and therefore will undermine the advantage of theevent-based approach.Finally, there are analytic or statistical DRAM models such as[5, 21]. [5] presents a DRAM timing parameter analysis but doesnot provide a simulation model. The model in [21] provides predictions on DRAM efficiency instead of per-access timing information. [19] built a decision tree that classifies memory requestsinto conditional probability distributions but still needs a different scheduling algorithm to help producing the memory latency.Our work differentiates these previous work by treating DRAMtiming modeling as a classification problem and classify each memory request into pre-defined latency classes instead of generatinga conditional probability distribution. The latency classes comesfrom the understanding of how DRAM timing works instead ofpure observation. We also do not treat memory controller as a blackbox, but instead extract high quality features from request streamsthat help the machine learning model “understands” the targetedcontroller model.channel, but for each request there is only a subset of these statesthat really matter to the timing of that request. Also, the queuingstatus when a new request arrives can also be accounted as states.The timing of each DRAM request has already been largelydictated by the DRAM states when it arrives at the controller:intuitively speaking, when a request arrives at the DRAM controller,there are very limited actions that the controller can take. It caneither A) process this request, whether because it is prioritizedby the scheduler, or just because there are no other requests tobe processed at the time, or B) hold the request whether becausethere is contention, other events are happening such as the current rank/bank is refreshing. Most of the scenarios here can berepresented as a “state” like we previously discussed.Our observation shows most DRAM request latencies fallinto very few latency buckets, meaning that they are likelyto be predictable: we ran cycle-accurate simulations on a set of12 real world benchmarks, and discovered that although everybenchmark has a long tail latency that stretches to over 400 cycles,(likely the result of having to wait for a refresh which is 420 cyclesin this case), the latency of more than 90% of the requests are limitedto just quite a few latency buckets.This distribution fits into a statistical or machine learning modelvery well: the majority of the cases are predictable while the cornercases are there to optimize. With a statistical or machine learningmodel, we cannot handle 100% of the requests accurately like cycleaccurate simulator. However, if we can accurately predict, for instance, 90% of the requests at the cost of a fraction of simulationtime, then the trade-off may be worth the accuracy loss in scenarioswhere simulation speed is a limiting factor.3It is clear now that the latency distribution for most memory requests is concentrated in a very small range. But there can still betens of numeric values in that small range. These numeric valuescreate noises to prevent the model from converging. For example,some requests have the latency of 20 cycles, which is exactly theminimum cycles it takes to complete a row buffer hit. But requestsof 21, 22, 23, and all the way to 30 cycles also represents row bufferhit conditions, because if it is not a row buffer hit, then the minimum latency will be 20 tRCD, which is well over 30 cycles. Allthe variations of 20 cycles are caused by reasons such as bus contention, or rank switching, but they are still essentially row bufferhits, and therefore they should all be classified as one categoryinstead of 10 individual numbers.As we stated in Section 3, the dominating factor of the latencyof a memory request is the DRAM states. For instance, a row bufferhit results in 20 cycles latency; a request to an idled bank takes35 cycles; a row buffer miss takes 50 cycles; a request blocked byrefresh operations can take 400 cycles. These are far more influential than one or two cycles of bus contention. Plus, these smallernumbers are very specific to the DRAM protocol and are thus notportable/universal. Therefore we propose to classify requests intothese collective categories as opposed to individual values.PROPOSITIONSDifferent from analytic models that provide a high level analysis,which we discussed in Section 2, the statistical models here meanto provide an on-the-fly DRAM timing for each request based on a“trained” statistical or machine learning model.The foundation of why such a statistical model would work onDRAM is that: DRAM banks only have a finite number of states. The timing of each DRAM request has already been largelydictated by the DRAM states when it arrives at the controller. Our observation shows most DRAM request latencies fallinto a very few latency buckets, indicating that this behavioris likely the result of the previous two points.And we will expand each of the claims one by one as follows.DRAM banks only have a finite number of states: a DRAMbank can be modeled as a state machine: it can be in idle, open,refreshing, or low power states. Although there are typically thousands of rows that can be opened or closed, what matters to aspecific request to a bank is whether the row of that request is openor not, so it will reduce to 2 states in this regard. Similarly, whilethere can be multiple banks in a rank and even multiple ranks in a4 PROPOSED MODEL4.1 Classification
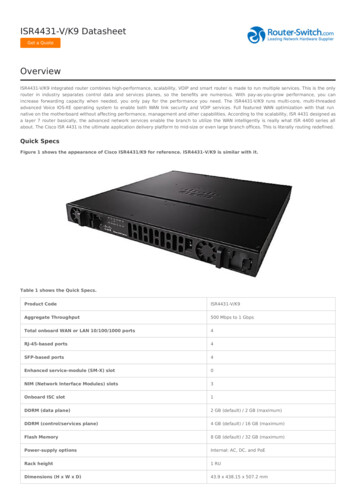
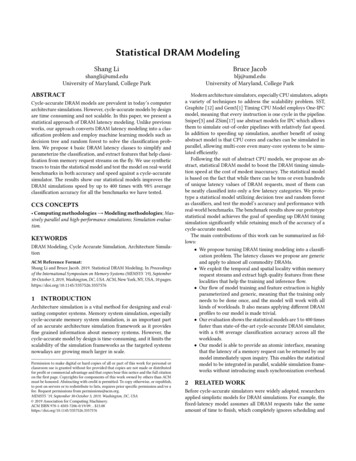
Statistical DRAM ModelingMEMSYS ’19, September 30-October 3, 2019, Washington, DC, USAexample, the refresh counter marks cycle 7200, 14400, .etc asrefresh cycles for rank 0, and if a request arrives at cycle 7201,then it will be regarded as arriving during a refresh. Nowby no means our reference refresh timestamps can matchesprecisely the real refresh cycle in a cycle accurate simulation,but it is a good approximation for the impact of refresh.Based on how DRAM works, we propose the following latencyclasses and their corresponding latency number in DRAM timingparameters: idle: this class of latency occurs when the memory requestgoes to an idle or precharged DRAM bank, requires an activation (ACT), and then read/write. row-hit: this class of latency occurs when the memory request happens to goes to a DRAM page that was left openby some previous memory requests. row-miss this class of latency occurs when the memoryrequest goes to the a DRAM bank that has a different pageopened by previous memory requests. Therefore, to completethis request, the controller must precharge the bank, thenactivate, and then read/write. refresh this class of latency occurs when the memory request is delayed by a refresh operation. Depending on whetherthe request comes before the refresh or during the refresh,the latency in this class may vary.RequestRAddr CycleConfiguration0x120 shCounterBank QBank QBank Q (0)Op Rank Bank Row CycleR000x110200Update Bank Qafter extractionExtraction LogicWe do not seek to reproduce the exact latency as cycle accurate simulation, but extrapolate an appropriate latency numberbased on DRAM timing parameters. We will further explain this inSection 4.2.4.2Opsame-row-last near-ref . num recent bankFeatures10.1Latency RecoveryOnce we have latency classes in hand, combined with DRAM timingparameters, we can recover their latency into approximate DRAMcycles. By doing this we can avoid relying on any specific numbersbut rather have a portable generic model. For example, we cansimply plug in a DRAM profile with timing parameters to obtainlatency numbers for that profile, and if we want latency numbersfor a different profile, we simply plug in another DRAM profilewithout having to retrain the whole model.We specify how we recover a latency cycle number from eachlatency class as follows: idle: the minimum latency of this class is a row access followed by a column access. In DRAM parameters it is typically tRCD tCL BL/2. Note there are some variances.For instance, read or write operations may have differenttRCD, tCL values, and for GDDR the burst cycles can beBL/4 as well. row-hit: the minimum latency of this class is simply thetime of a column access. In DRAM parameters it is typically tCMD tCL BL/2. Again, there are protocol specificvariances like the idle class. row-miss: the minimum latency of this class is a full rowcycle. In DRAM parameters it is typically tRP tRCD tCL BL/2. refresh: We use a refresh counter similar to the refresh counters in DRAM controller, to provide timestamps of when eachrank should refresh. We only use the timestamps as references to determine whether a request arrives right before arefresh or during a refresh. If the request comes right beforethe refresh, then we estimate the latency as tRFC tRCD tCL BL/2. If the request arrives during the refresh cycle, e.g.n cycles after the reference refresh clock (n tRFC), thenwe estimate the latency as tRFC n tRCD tCL BL/2. ForFigure 1: Feature extraction diagram. We use one request asan example to show how the features are extracted.4.3Dynamic Feature ExtractionTo train a statistical or machine learning model, we need “features”that provides distinctive information about the latency classes.As we know, the latency of each memory request is largelydependent on the DRAM states, which are the results of previousmemory requests. For example, a previous request opened a pagewhen the DRAM bank was idle, then a following request that goesto the same bank same row can take that advantage. So the featureswe are looking for here should come from the address streams,especially the previous requests, and we need to be able to extractfeatures dynamically from these address streams.There are two aspects of extracting features from address streams,temporal features and spatial features. Temporal features reflectthe potential dependency between requests. For example, a previous request that is 5 cycles ahead should have more impact on thetiming of the current request than another previous request 5000cycles ahead. The difficulty is how to translate the timing intervalsinto useful features. Again we cannot rely on specific values because there would be too many features to be useful. But instead,we use generic DRAM parameters to classify how far or near is aprevious request. For example, we consider a request “near” if itwas arrived within tRC cycles, the intuition is that in tRC cycles,which represents the full row cycle, the DRAM can be activatedand then precharged by a request, which renders that DRAM stateunchanged to a following request outside of tRC cycles. Anotherline we draw here is the “far” line, which uses the number of tRFC,which is the number of cycles it takes to do a refresh. It may implya reset state for the DRAM.
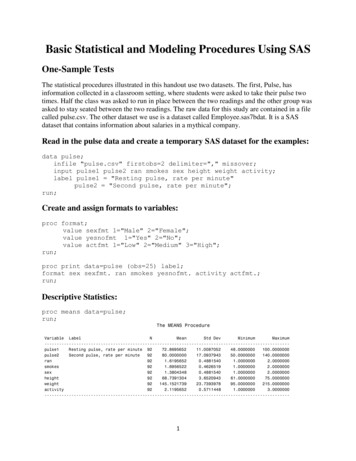
MEMSYS ’19, September 30-October 3, 2019, Washington, DC, USAShang Li and Bruce JacobTable 1: Features with DescriptionsFeatureValuesDescriptionwhether the last requestthat goes to same bank has the same row(as this one)whether the last request to thesame bank added recently (tRC)whether the last request to thesame bank added long ago (tRFC)operation(read/write)operation of last request to the same bankwhether there is a refresh sincelast request to the same r this cycle is near a refresh cyclesame-row-previntnumber of previous requests withsame row to the same -allintnumber of requests added recentlyto the same banknumber of recent requests addedrecently to the same ranknumber of recent requests addedrecently to all ranksSpatial features need to reflect the structures of DRAM, in particular, banks and rows, because the state of each bank is the mostdetermining factor for the incoming DRAM request. For example,if we are trying to predict the timing of one request, the previousrequests that go to the same bank weigh more than the previousrequests go to any other banks. And same as temporal features, wedon’t need to identify each bank and row by their specific banknumber, but instead we identify them by “same row”, “same bank”,“same rank”(but different bank), or “different rank”. We can evaluatea request with previous requests on these fields easily once theyhave their physical addresses translated to DRAM addresses(rank,bank, row, column). And to simplify and facilitate feature extraction,we maintain a request queue for each bank and put requests intoeach bank queue after the address translation. Unlike the queuesin DRAM controllers, this bank queue is not actively managed andis strictly FIFO with a maximum length imposed for performanceoptimization.Combining the temporal features with spatial features, we canhave features coded with both temporal feature and spatial feature.For instance, num recent bank feature counts the number ofprevious requests that go to the same bank and that are recent. Wepropose a list of features in Table 1; these features can give hintson the possible state that the DRAM banks are in and how DRAMcontrollers can make scheduling decisions etc.The feature extraction using one request as an example is shownin Figure 1.4.4Intuitionkey factor for the mostrecent bank staterelevancy of the last requestto the same bankrelevancy of the last requestto the same bankfor potential R/W schedulingfor potential R/W schedulingrefresh reset thebank to idlelatency can be reallyhigh if it’s near a refreshif there is same rowrequest then OOOmay be possiblecontention/queuingin the bankcontentioncontentionModel TrainingHaving the features and classes ready, we now put pieces togetherand build the training flow shown in Figure 2. We use synthetictraces as training data, and use a cycle accurate DRAM simulator,DRAMsim3, to provide ground truth. The beauty of using synthetictraces is that we can use a small amount of synthetic traces torepresent a wide range of real world workloads. For example, wecan control the inter-arrival timings of the synthetic traces to reflectto intensity of workloads; we can also generate contiguous accessstreams and random access streams and interleave them to coverall types of memory access patterns of real workloads. Plus, wealso don’t have to worry about the contamination of testing datasetwhen we test the model with real workloads.We run the synthetic traces through DRAMsim3 with a DRAMconfiguration file as usual. To mark the ground truth, we modifiedDRAMsim3 so that it generates a trace output that can be usedfor training. Because the DRAMsim3 knows exactly what happensto each request inside its controller, it can precisely classify therequests into any of the categories we proposed in Section 4.1. Andonce the requests are classified, we run them through the featureextraction to obtain features. Finally, we run the features alongwith the classes into a model to obtain a model.There are many machine learning models that can potentiallyhandle this particular classification problem and we are not goingto test every one of them as it is out of the scope of this thesis. In
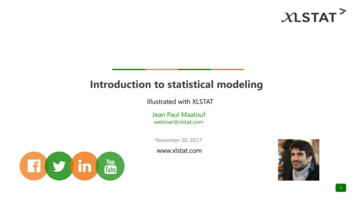
Statistical DRAM ModelingMEMSYS ’19, September 30-October 3, 2019, Washington, DC, USAConfiguration(tRC, ycle rank bankcycle addr opsame-row-last near-ref .Class00x123 Ridle210x234 Widle.idle.00x1F R100x2E W.op Class110.row000.YesNoidleYesNo.Figure 2: Model Training Flow Diagramthis study we start with simple and efficient models like decisiontree[15] and random forest[11] for this study: These models are simple, intuitive, and explainable, whichis quite important for prototyping work like this: it helps tobe able to look at the model to examine and debug. The an ensemble tree model mimics how a DRAM controllerworks naturally, but instead of doing it in a series of cycles,the decision tree makes the decision instantly. The simplicity of these models makes both training and inference fast, the later is crucial for simulations performance.As far as hyperparameter tuning goes, while decision tree modelis relatively simple, there are still many hyper-parameters to tune.Luckily the model is not hard to train, and it does not take muchtime to go through many parameters. We tried several differentapproaches(including brute force), and they all work decently. Butwhat we have found that produced best accuracy is Stratified Kfold Cross Validation[10]. Stratification samples help reduce theimbalance of classes in our training dataset, especially the refreshclass that is much rarer than other classes. K-fold Cross Validationdivides the training data sets into k folds, and for each fold, uses it astest set and the rest k 1 folds as training sets. This further reducesthe bias and overfitting of the model. The details of hyperparametertraining can be found later in Section 5.1.4.5InferenceInference is relatively straightforward, as shown in Figure 3. However, one thing to note is that, if we are to compare the inferenceresults to the results of cycle accurate simulation, we have to usethe same DRAM configuration profile as the cycle accurate simulation. Otherwise we are not required to use the same DRAMconfiguration profiles.In implementation, the entire inference process only takes onefunction call combining the request cycle, address, and operation(read/write), and the inference function returns the number ofcycles that the request is going to take to complete.This is great relief from the cycle accurate interface where thefrontend has to always stay synchronized with the DRAM model.It allows much more flexible integration into other frameworks.4.6Other Potential ModelsThe innovation of this work is to translate what is an essentiallytime-series problem into a non-time-series problems. We are awareof that there are models that work on time-series problem. Some ofthe temporal features in the data are easy to extract, whereas if weuse models to automatically extract features, it will be costly when itcomes to training. Additionally, our approach preserves portabilityand model reusability when it comes to different DRAM profiles,which we believe is not easy to preserve in other models. That beingsaid, we certainly look forward to other efficient implementationsof this problem.same-row-last near-ref . last-opFront End(trace orCPU sim)RequestFeatureExtractioncycle addr opConfiguration(tRC, tRFC.)00x1F RNum Cycles(30)LatencyRecovery10.Features"idle"Yes NoClassificationYesNoFigure 3: Model Inference Flow Diagram05 EXPERIMENTS & EVALUATION5.1 HyperparametersWe use the Scikit-learn[14] package to train our model, which contains a set of tools and models that are readily available. The hyperparameters we use for training the decision tree model is shown inTable 2. We use the Strati f iedShu f f leSplit module to conduct agrid search on the these hyperparameters to find the best fittingmodel.On top of these hyperparameters, we also use k f old 5 forK-fold cross validation. The end result is that there are a total of5400 5 27000 models to train. Fortunately, each model trainsquickly and the training can be distributed to multiple cores/threads
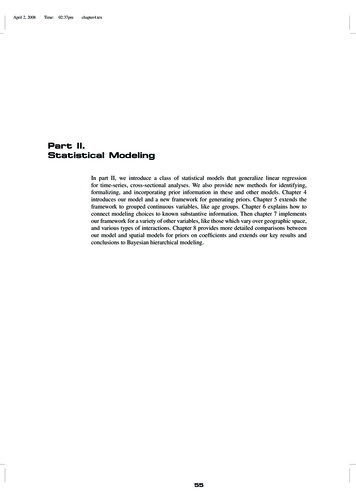
MEMSYS ’19, September 30-October 3, 2019, Washington, DC, USAShang Li and Bruce JacobTable 2: Hyperparameters explored for the decision tree model.HyperparameterValuesmax-depthNone, 3, 5, 8, 10min-samples-leaf5, 20, 20, 30, 0.1, 0.2min-samples-split5, 10, 20, 0.05, 0.1min-weight-fraction-leaf0, 0.05, 0.1max-featuresauto, 0.2, 0.5, 0.8random state1, 3, 5in parallel. It takes less than a minute to train and evaluate all 27000models using a 4-core desktop CPU.The best hyperparameters are automatically selected based onaccuracy. The values of the “best” hyperparameters are listed inTable 3. The best accuracy is 96.76% (for all cross-validation data).ExplanationMax depth of any path in the decision tree(“None” means unlimited)Min number of samples needed to create a leaf nodein the tree. Float number means ratio.Min number of samples to create a split in the tree.Float number means ratio.Min weighted fraction of the sum total of weightsrequired to be at a leaf node.Max number of features to consider. Auto meanssquare root of number of features.Help train reproducible model.Decision Treenum recent rankref after lastTable 3: Hyperparameter Values of Best random stateValueNone20500.83As for the hyperparameters of random forest model, the defaultparameters provided by Scikit-learn package works out of the box,trains in seconds, and produces an accuracy as good as the decisiontree model. Therefore we did not explore the hyperparameters ofrandom forest model.5.2Feature ImportanceWe analyze the trained models and see how they treat the featuresdifferently. To better visualize the importance of features, we clipthe least important features into one category(“others”), and plotthe pie chart as Figure 4.The two models handles different features differently, with thetwo most important features the same: same row last and re f a f terr last, contributing to more than 50% combined. It can alsobe seen that the distribution of importance is more balanced in therandom forest model than the decision tree model.5.3BenchmarksTo comprehensively test the trained model, we evaluate our modelagainst cycle-accurate DRAMsim3 with memory traces of realworld benchmarks. We use a subset of SPEC CPU2017 benchmarks[2] that are most representative according to [13], this allows us to13.8%near ref27.3%7.8% is last far3.0%1.3% others46.8%same row lastRandom Forestsame row prevnum recent allnear ref16.4% 9.9%8.8%7.5%27.7%ref after last29.8%otherssame row lastFigure 4: Feature importance in percentage for decision treeand random foresttest benchmarks with different memory characteristics. These SPECbenchmarks are bwaves r, cactuBSSN r, deepsjeng r, fotonik3d r,gcc r, lbm r, nab r, mcf r, x264 r, and xalancbmk r. We also include ST REAM, which is very bandwidth sensitive, and ram lat, anLMBench-like memory benchmark that is latency sensitive. Thesebenchmarks will show us the full spectrum of memory characteristics and behaviors.5.4AccuracyWe run all the benchmarks mentioned in Section 5.3 with cycleaccurate, out-of-order Gem5 CPU along with DRAMsim3, and thiswill provide us the golden standard for our accuracy tests. A address trace for each of the benchmark is generated as the input tothe statistical models, this allows the statistical model and cycleaccurate model to have exactly the same inputs to work with. Foreach request we also record its latency class and latency value incycles labeled by DRAMsim3 so that we can use it for comparisonwith the statistical models.Note that there are two aspects of accuracy, classification accuracy, which represents how many requests the statistical modelcan correctly classify according to the cycle accurate models; andlatency accuracy, which is the numeric latency values of the requestproduced by the statistical models.
Statistical DRAM ModelingMEMSYS ’19, September 30-October 3, 2019, Washington, DC, USAFirst we look at classification accuracy for decision tree andrandom forest models, as shown in Figure 5 and Fi
type a statistical model utilizing decision tree and random forest as classifiers, and test the model’s accuracy and performance with real-world benchmarks. The benchmark results show our prototype statistical model achieves the goal of speeding up DRAM timing simulation significantly whi