Transcription
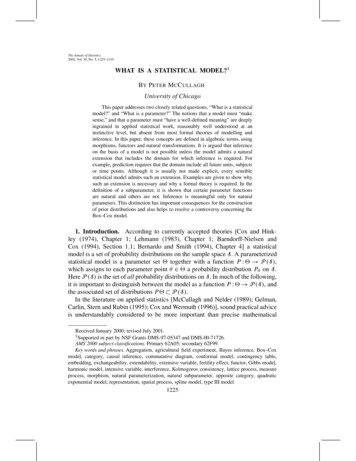
1Model Population Analysisfor Statistical Model ComparisonHong-Dong Li1, Yi-Zeng Liang1 and Qing-Song Xu21Collegeof Chemistry and Chemical Engineering, Central South University, Changsha,2School of Mathematic Sciences, Central South University, Changsha,P. R. China1. IntroductionModel comparison plays a central role in statistical learning and chemometrics.Performances of models need to be assessed using a given criterion based on whichmodels can be compared. To our knowledge, there exist a variety of criteria that can beapplied for model assessment, such as Akaike’s information criterion (AIC) [1], Bayesianinformation criterion (BIC) [2], deviance information criterion (DIC),Mallow’s Cp statistic,cross validation [3-6] and so on. There is a large body of literature that is devoted to thesecriteria. With the aid of a chosen criterion, different models can be compared. Forexample, a model with a smaller AIC or BIC is preferred if AIC or BIC are chosen formodel assessment.In chemometrics, model comparison is usually conducted by validating different models onan independent test set or by using cross validation [4, 5, 7], resulting in a single value, i.e.root mean squared error of prediction (RMSEP) or root mean squared error of crossvalidation (RMSECV). This single metrics is heavily dependent on the selection of theindependent test set (RMSEP) or the partition of the training data (RMSECV). Therefore, wehave reasons to say that this kind of comparison is lack of statistical assessment and also atthe risk of drawing wrong conclusions. We recently proposed model population analysis(MPA) as a general framework for designing chemometrics/bioinformatics methods [8].MPA has been shown to be promising in outlier detection and variable selection. Here wehypothesize that reliably statistical model comparison could be achieved via the use ofmodel population analysis.2. Model population analysis2.1 The framework of model population analysisModel population analysis has been recently proposed for developing chemometricsmethods in our previous work [8]. As is shown in Figure 1, MPA works in three steps whichare summarized as (1) randomly generating N sub-datasets using Monte Carlo sampling (2)building one sub-model on each sub-dataset and (3) statistically analyzing some interestingoutput of all the N sub-models.www.intechopen.com
4Chemometrics in Practical ApplicationsFig. 1. The schematic of MPA. MCS is the abbreviation of Monte Carlo Sampling.2.1.1 Monte Carlo sampling for generating a sub-datasetSampling plays a key role in statistics which allows us to generate replicate sub-datasetsfrom which an interested unknown parameter could be estimated. For a given dataset (X, y),it is assumed that the design matrix X contains m samples in rows and p variables incolumns, the response vector y is of size m 1. The number of Monte Carlo samplings is setto N. In this setting, N sub-datasets can be drawn from N Monte Carlo samplings with orwithout replacement [9, 10], which are denoted as (Xsub, ysub)i, i 1, 2, 3, N.2.1.2 Establishing a sub-model using each sub-datasetFor each sub-dataset (Xsub, ysub)i, a sub-model can be constructed using a selected method,e.g. partial least squares (PLS) [11] or support vector machines (SVM) [12]. Denote the submodel established as fi (X). Then, all these sub-models can be put into a collection:C (f1(X), f2(X), f3(X), , fN(X))www.intechopen.com(1)
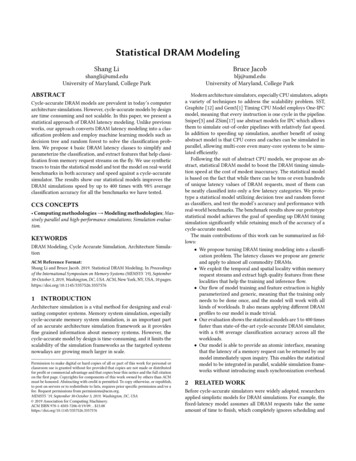
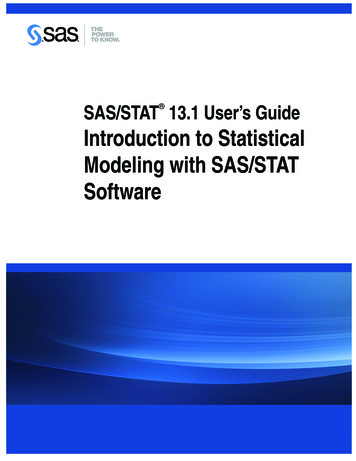
Model Population Analysis for Statistical Model Comparison5All these N sub-models are mutually different but have the same goal that is to predict theresponse value y.2.1.3 Statistically analyzing an interesting output of all the sub-modelsThe core of model population analysis is statistical analysis of an interesting output, e.g.prediction errors or regression coefficients, of all these sub-models. Indeed, it is difficult togive a clear answer on what output should be analyzed and how the analysis should bedone. Different designs for the analysis will lead to different algorithms. As proof-ofprinciple, it was shown in our previous work that the analysis of the distribution ofprediction errors is effective in outlier detection [13].2.2 Insights provided by model population analysisAs described above, Monte Carlo sampling serves as the basics of model population analysisthat help generate distributions of interesting parameters one would like to analyze.Looking on the surface, it seems to be very natural and easy to generate distributions usingMonte Carlo sampling. However, here we show by examples that the distribution providedby model population analysis can indeed provide very useful information that givesinsights into the data under investigation.2.2.1 Are there any outliers?Two datasets are fist simulated. The first contains only normal samples, whereas there are 3outliers in the second dataset, which are shown in Plot A and B of Figure 2, respectively. Foreach dataset, a percentage (70%) of samples are randomly selected to build a linearregression model of which the slope and intercept is recorded. Repeating this procedure1000 times, we obtain 1000 values for both the slope and intercept. For both datasets, theintercept is plotted against the slope as displayed in Plot C and D, respectively. It can beobserved that the joint distribution of the intercept and slope for the normal dataset appearsto be multivariate normally distributed. In contrast, this distribution for the dataset withoutliers looks quite different, far from a normal distribution. Specifically, the distributions ofslopes for both datasets are shown in Plot E and F. These results show that the existence ofoutliers can greatly influence a regression model, which is reflected by the odd distributionsof both slopes and intercepts. In return, a distribution of a model parameter that is far froma normal one would, most likely, indicate some abnormality in the data.2.2.2 Are there any interfering variables?In this study, we first simulate a design matrix X of size 50 10, the response variable Y issimulated by multiplying X with a 10-dimensional regression vector. Gussian noises withstandard deviation equal to 1 are then added to Y. That is to say, all the variables in Xare ”true variables” that collectively predict Y. This dataset (X, Y) is denoted SIMUTRUE.Then another design matrix F is simulated of size 50 10. Denote the combination of X andF as Z [X F]. This dataset (Z, Y) is called SIMUINTF, which contains variables that are notpredictive of Y. For both datasets, we randomly choose 70% samples to first build aregression model which is then used to make predictions on the remaining 30% samples,resulting in a RMSEP value. Repeating this procedure 1000 times, we, for both datasets,www.intechopen.com
6Chemometrics in Practical ApplicationsFig. 2. A simulation study illustrating the use of model population analysis to detectwhether a dataset contains outliers. Plot A and Plot B shows the data simulated without andwith outliers, respectively. 1000 linear regression models computed using 1000 sub-datasetsrandomly selected and the slope and intercept are presented in Plot C and D. Specifically,the distribution of slope for these two simulated datasets are displayed in Plot E and Plot F.www.intechopen.com
Model Population Analysis for Statistical Model Comparison7Fig. 3. The distribution of RMSEPs using the variable set that contains only “true variables”(upper panel) and the variable set that includes not only “true variables” but also“interfering variables” (lower panel).obtain 1000 RMSEP values, of which the distributions are given in Figure 3. Clearly, thedistribution of RMSEP of the SIMUINTF is right shifted, indicating the existence of variablesthat are not predictive of Y can degrade the performance of a regression model. We call thiskind of variables “interfering variables”. Can you tell whether a dataset contains interferingvariables for a real world dataset? Curious readers may ask a question like this. Indeed, wecan. We can do replicate experiments to estimate the experimental error that could serve asa reference by which it is possible to judge whether interfering variables exist. For example,if a model containing a large number of variables (with true variables included) shows alarge prediction error compared to the experimental error, we may predict that interferingvariables exist. In this situation, variable selection is encouraged and can greatly improvethe performance of a model. Actually, when interfering variables exist, variable selection is amust. Other methods that use latent variables like PCR or PLS cannot work well becauselatent variables have contributions coming from interfering variables.2.3 Applications of model population analysisUsing the idea of model population analysis, we have developed algorithms that addressthe fundamental issues in chemical modeling: outlier detection and variable selection. Forwww.intechopen.com
8Chemometrics in Practical Applicationsoutlier detection, we developed the MC method [13]. For variable selection, we developedsubwindow permutation analysis (SPA) [14], noise-incorporated subwindow permutationanalysis (NISPA) [15] and margin influence analysis (MIA) [16]. Here, we first give a briefdescription of these algorithms, aiming at providing examples that could help interestedreaders to understand how to design an algorithm by borrowing the framework of modelpopulation analysis.As can be seen from Figure 1, These MPA-based methods share the first two steps that are(1) generating N sub-datasets and (2) building N sub-models. The third step “statisticalanalysis of an interesting output of all these N sub-models” is the core of model populationanalysis that underlines different methods. The key points of these methods as well asanother method Monte Carlo uninformative variable elimination (MCUVE) that alsoimplements the idea of MPA are summarized in Table 1. In a word, the distribution frommodel population analysis contains abundant information that provides insight into thedata analyzed and by making full use of these information, effective algorithms can bedeveloped for solving a given problem.Methods*MC methodSPANISPAMIAMCUVEWhat to statistically analyzeDistribution of prediction errors of each sampleDistribution of prediction errors before and after each variable ispermutedDistribution of prediction errors before and after each variable ispermuted with one noise variable as referenceDistribution of margins of support vector machines sub-modelsDistribution of regression coefficients of PLS regression sub-models*: The MC method, SPA, NISPA, MIA and MCUVE are described in references [13], [14], [15] [16] and[27].Table 1. Key points of MPA-based methods.2.4 Model population analysis and bayesian analysisThere exist similarities as well as differences between model population analysis andBayesian analysis. One important similarity is that both methods consider the parameter ofinterest not as a single number but a distribution. In model population analysis, we generatedistributions by causing variations in samples and/or variables using Monte Carlosampling [17]. In contrast, in Bayesian analysis the parameter to infer is first assumed to befrom a prior distribution and then observed data are used to update this prior distributionto the posterior distribution from which parameter inference can be conducted andpredictions can be made [18-20]. The output of Bayesian analysis is a posterior distributionof some interesting parameter. This posterior distribution provides a natural link betweenBayesian analysis and model population analysis. Taking Bayesian linear regression (BLR)[20] as an example, the output can be a large number of regression coefficient vectors thatare sampled from its posterior distribution. These regression coefficient vectors actuallyrepresent a population of sub-models that can be used directly for model populationanalysis. Our future work will be constructing useful algorithms by borrowing merits ofboth Bayesian analysis and model population analysis.www.intechopen.com
Model Population Analysis for Statistical Model Comparison92.5 Model population analysis and ensemble learningEnsemble learning methods, such as bagging[21], boosting [22] and random forests [23],have emerged as very promising strategies for building a predictive model and thesemethods have found applications in a wide variety of fields. Recently, a new ensembletechnique, called feature-subspace aggregating (Feating) [24], was proposed that was shownto have nice performances. The key point of these ensemble methods is aggregating a largenumber of models built using sub-datasets randomly generated using for examplebootstrapping. Then ensemble models make predictions by doing a majority voting forclassification or averaging for regression. In our opinion, the basic idea of ensemble learningmethods is the same as that in model population analysis. In this sense, ensemble learningmethods can also be formulated into the framework of model population analysis.3. Model population analysis for statistical model comparisonBased on model population analysis, here we propose to perform model comparison byderiving an empirical distribution of the difference of RMSEP or RMSECV between twomodels (variable sets), followed by testing the null hypothesis that the difference of RMSEPor RMSECV between two models is zero. Without loss of generality, we describe theproposed method by taking the distribution of difference of RMSEP as an example. Weassume that the data X consists of m samples in row and p variables in column and thetarget value Y is an m-dimensional column vector. Two variable sets, say V1 and V2, selectedfrom the p variables, then can be compared using the MPA-based method described below.First, a percentage, say 80%, from the m samples with variables in V1 and V2 is randomlyselected to build two regression models using a preselected modeling method such as PLS[11] or support vector machines (SVMs) [12], respectively. Then an RMSEP value can becomputed for each model by using the remaining 20% samples as the test set. Denote thetwo RMSEP values as RMSEP1 and RMSEP2, of which the difference can be calculated asD RMSEP1-RMSEP2(2)By repeating this procedure N, say 1000, times, N D values are obtained and collected into avector D. Now, the model comparison can be formulated into a hypothesis test problem as:Null hypothesis: the mean of D is zero.Alternative hypothesis: the mean of D is not zero.By employing a statistical test method, e.g. t-test or Mann-Whitney U test [25], a P value canbe computed for strictly assessing whether the mean of D is significantly different from zero(P 0.05) or not (P 0.05). If P 0.05, the sign of the mean of D is then used to compare whichmodel (variable set) is of better predictive performance. If P 0.05, we say two models havethe same predictive ability.4. Results and discussions4.1 Comparison of predictive performances of variables subsetsThe corn NIR data measured on mp5 instrument is used to illustrate the use of the proposedmethod (http://software.eigenvector.com/Data/index.html). This data contain NIR spectrawww.intechopen.com
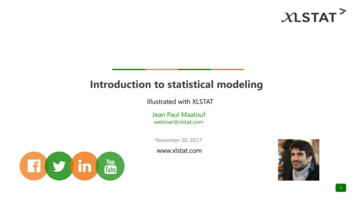
10Chemometrics in Practical Applicationsmeasured at 700 wavelengths on 80 corn samples. The original NIR spectra are shown inFigure 4. The chemical property modeled here is the content of protein. As wasdemonstrated in a large body of literature [26-30], variable selection can improve thepredictive performance of a model. Here we would like to investigate whether the gain inpredictive accuracy using variable subsets identified by variable selection methods 0-0.11200140016001800wavelength200022002400Fig. 4. Original near infrared spectra of corn on the mp5 instrument.Uninformative variable elimination (UVE) is a widely used method for variable selection inchemometrics [26]. Its extended version, Monte Carlo UVE (MCUVE), was recentlyproposed [27, 31]. Mimicking the principle of “survival of the fittest” in Darwin’s evolutiontheory, we developed a variable selection method in our previous work, called competitiveadaptive reweighted sampling (CARS) [8, 28, 32, 33], which was shown to have the potentialto identify an optimal subset of variables that show high predictive performances. Thesource codes of CARS are freely available at [34, 35].In this study, MCUVE and CARS is chosen to first identify two variable sets, named V1 andV2, respectively. The set of the original 700 variables are denoted as V0. Before data analysis,each wavelength of the original NIR spectra is standardized to have zero mean and unitvariance. Regarding the pretreatment of spectral data, using original spectra, mean-centeredwww.intechopen.com
11Model Population Analysis for Statistical Model 0.101200140016001800wavelength200022002400Fig. 5. Comparison of selected wavelengths using MC-UVE (red circles) and CARS (bluedots). The green line denotes the mean of the 80 corn NIR spectra.spectra or standardized spectra indeed would lead to different results. But the difference isusually not big according to our experience. The reason why we choose standardization is toremove the influence of each wavelength’s variance on PLS modeling because thedecomposition of spectrum data X using PLS depends on the magnitude of covariancebetween wavelengths and the target variable Y. The number of PLS components areoptimized using 5-fold cross validation. For MCUVE, the number of Monte Carlosimulations is set to 1000 and at each simulation 80% samples are selected randomly to builda calibration model. We use the reliability index (RI) to rank each wavelength and thenumber of wavelengths (with a maximum 200 wavelengths allowed) is identified using 5fold cross validation. Using MCUVE, 115 wavelengths in 5 bands (1176-1196nm, 15081528nm, 1686-1696nm, 1960-2062nm and 2158-2226nm) are finally selected and shown inFigure 5 as red circles. For CARS, the number of iterations is set to 50. Using CARS,altogether 28 variables (1188, 1202, 1204, 1396, 1690, 1692, 1710, 1800, 1870, 2048, 2050, 2052,2064, 2098, 2102, 2104, 2106, 2108, 2166, 2168, 2238, 2270, 2382, 2402, 2434, 2436, 2468 and2472 nm) are singled out and these variables are also shown in Figure 5 as blue dots.Intuitively, MCUVE selects 5 wavelength bands while the variables selected by CARS aremore diverse and scattered at different regions. In addition, the Pearson correlationsvariables selected by both methods are shown in Figure 6.www.intechopen.com
12Chemometrics in Practical ApplicationsFig. 6. The Pearson pair-wise correlations of variables selected using MCUVE (115 variables,left) and CARS (28 variables, right).We choose PLS for building regression models. For the MPA-based method for modelcomparison, the number of Monte Carlo simulations is set to 1000 and at each simulation60% samples are randomly selected as training samples and the rest 40% work as testsamples. The number of PLS components is chosen based on 5-fold cross validation. In thissetting, we first calculated 1000 values of RMSEP0, RMSEP1 and RMSEP2 using V0, V1 andV2, respectively. The distributions of RMSEP0, RMSEP1 and RMSEP2 are shown in Figure 7.The mean and standard deviations of these three distributions are 0.169 0.025 (full spectra),0.147 0.018 (MCUVE) and 0.108 0.015 (CARS). On the whole, both variable selectionmethods improve the predictive performance in terms of lower prediction errors andsmaller standard deviations. Looking closely, the model selected by CARS has smallerstandard deviation than that of MCUVE. The reason may be that CARS selected individualwavelengths and these wavelengths display lower correlations (see Figure 6) than thosewavelength bands selected by MCUVE. The lower correlation results in better modelstability which is reflected by smaller standard deviations of prediction errors. Thereforefrom the perspective of prediction ability, we recommend to adopt methods that selectindividual wavelengths rather than continuous wavelength bands.Firstly, we compare the performance of the model selected by MCUVE to the full spectralmodel. The distribution of D values (MCUVE – Full spectra) is shown in Plot A of Figure 8.The mean of D is -0.023 and is shown to be not zero (P 0.000001) using a two-side t test,indicating that MCUVE significantly improves the predictive performance. Of particularnote, it can be observed that a percentage (83.1%) of D values are negative and theremaining (16.9%) is positive, which indicates model comparison based on a single split ofthe data into a training set and a corresponding test set may have the potential risk ofdrawing a wrong conclusion. In this case, the probability of saying that MCUVE does notimprove predictive performances is about 0.169. However, this problem can be solved bythe proposed MPA-based method because the model performance is tested on a largenumber of sub-datasets, rendering the current method potentially useful for reliablywww.intechopen.com
Model Population Analysis for Statistical Model Comparison13Fig. 7. Distributions of root mean squared errors of prediction (RMSEP) from 1000 test sets(32 samples) randomly selected from the 80 corn samples using full spectra and variablesselected by MCUVE and CARS, respectively.statistical model comparison. With our method, we have evidence showing that theimprovement resulting from MCUVE is significant.Fig. 8. The distributions of D values. The P values of t test for these three distributions are8.36 10-120, 0 and 0, respectively.www.intechopen.com
14Chemometrics in Practical ApplicationsFurther, the performance of the model selected by CARS is compared to the full spectralmodel. The distribution of D values (CARS – Full spectrum) is shown in Plot B of Figure 8.The mean of D is -0.061 which is much smaller that that from MCUVE (-0.023). Using a twoside t test, this mean is shown to be significantly different from zero (P 0), indicating thatthe improvement over the full spectral model is significant. Interestingly, it is found that allthe D values are negative, which implies the model selected by CARS is highly predictiveand there is little evidence to recommend the use of a full spectral model, at least for thisdataset.Finally, we compare the models selected by MCUVE and CARS, respectively. Thedistribution of D values (CARS – MCUVE) is shown in Plot C of Figure 8. The mean of Dvalues is -0.039. Using a two-side t test, this mean is shown to be significantly different fromzero (P 0), indicating that the improvement of CARS over MCUVE is significant. We findthat 98.9% of D values are negative and only 1.1% are positive, which suggests that there is asmall probability to draw a wrong conclusion that MCUVE performs better than CARS.However, with the help of MPA, this risky conclusion can be avoided, indeed.Summing up, we have conducted statistical comparison of the full spectral model and themodels selected by MCUVE and CARS based on the distribution of D values calculatedusing RMSEP. Our results show that model comparison based on a single split of the datainto a training set and a corresponding test set may result in a wrong conclusion and theproposed MPA approach can avoid drawing such a wrong conclusion thus providing asolution to this problem.4.2 Comparison of PCR, PLS and an ECR modelIn chemometrics, PCR and PLS seem to be the most widely used method for building acalibration model. Recently, we developed a method, called elastic component regression(ECR), which utilizes a tuning parameter α [0,1] to supervise the decomposition of X-matrix[36], which falls into the category of continuum regression [37-40]. It is demonstratedtheoretically that the elastic component resulting from ECR coincides with principalcomponents of PCA when α 0 and also coincides with PLS components when α 1. In thiscontext, PCR and PLS occupy the two ends of ECR and α (0,1) will lead to an infinitenumber of transitional models which collectively uncover the model path from PCR to PLS.The source codes implementing ECR in MATLAB are freely available at [41]. In this section,we would like to compare the predictive performance of PCR, PLS and an ECR model withα 0.5.We still use the corn protein data described in Section 4.1. Here we do not consider all thevariables but only the 28 wavelengths selected by CARS. For the proposed method, thenumber of Monte Carlo simulations is set to 1000. At each simulation 60% samples selectedrandomly are used as training samples and the remaining serve as test samples. The numberof latent variables (LVs) for PCR, PLS and ECR (α 0.5) is chosen using 5-fold crossvalidation.Figure 9 shows the three distributions of RMSEP computed using PCR, PLS and ECR (α 0.5). The mean and standard deviations of these distributions are 0.1069 0.0140,0.1028 0.0111 and 0.0764 0.0108, respectively. Obviously, PLS achieves the lowestprediction errors as well as the smallest standard deviations. In contrast, PCR performs thewww.intechopen.com
Model Population Analysis for Statistical Model Comparison15worst. As a transitional model that is between PCR and PLS, ECR with α 0.5 achieves themedium level performance.Fig. 9. The distributions of RMSEP from PCR, PLS and an ECR model with α 0.5Fig. 10. The distributions of D values. The P values of t test for these three distributions are0, 0 and 0, respectively.www.intechopen.com
16Chemometrics in Practical ApplicationsThe distributions of D values are displayed in Figure 10. The means of these threedistributions are -0.0041 (Plot A), -0.0305 (Plot B) and -0.0264 (Plot C), respectively. Using atwo-side t test, it is shown that all these three distributions of D values have a mean valuethat is significant not zero with P values equal to 0 , 0 and 0 for Plot A, Plot B and Plot C. Toconclude, this section provides illustrative examples for the comparison of differentmodeling methods. Our example demonstrates that PLS (an ECR model associated with α 1) performs better than PCR (an ECR model associated with α 0) and a specific transitionalECR model associated with α 0.5 has the moderate performance.4.3 Comparison of PLS-LDA models before and after variable selectionPartial least squares-linear discriminant analysis (PLS-LDA) is frequently used inchemometrics and metabolomics/metabonomics for building predictive classificationmodels and/or biomarker discovery [32, 42-45]. With the development of modern highthroughput analytical instruments, the data generated often contains a large number ofvariables (wavelengths, m/z ratios etc). Most of these variables are not relevant to theproblem under investigation. Moreover, a model constructed using this kind of data thatcontain irrelevant variables would not be likely to have good predictive performance.Variable selection provides a solution to this problem that can help select a small number ofinformative variables that could be more predictive than an all-variable model.In the present work, two methods are chosen to conduct variable selection. The first is t-test,which is a simple univariate method that determines whether two samples from normaldistributions could have the same mean when standard deviations are unknown butassumed to be equal. The second is subwindow permutation analysis (SPA) which was amodel population analysis-based approach proposed in our previous work [14]. The maincharacteristic of SPA is that it can output a conditional P value by implicitly taking intoaccount synergistic effects among multiple variables. With this conditional P value,important variables or conditionally important variables can be identified. The source codesin Matlab and R are freely available at [46].We apply these two methods on a type 2 diabetesmellitus dataset that contains 90 samples (45 healthy and 45 cases) each of which ischaracterized by 21 metabolites measured using a GC/MS instrument. Details of this datasetcan be found in reference [32].Using t-test, 13 out of the 21 variables are identified to be significant (P 0.01). For SPA, weuse the same setting as described in our previous work [14]. Three variables are selectedwith the aid of SPA. Let V0, V1 and V2 denote the sets containing all the 21 variables, the 13variables selected by t-test and the 3 variables selected by SPA, respectively. To run theproposed method, we set the number of Monte Carlo simulations to 1000. At eachsimulation 70% samples are randomly selected to build a PLS-LDA model with the numberof latent variables optimized by 10-fold cross validation. The remaining 30% samplesworking as test sets on which the misclassification error is computed.Figure 11 shows the distributions of misclassification errors computed using these threevariable sets. The mean and standard deviations of these distributions are 0.065 0.048 (allvariables), 0.042 0.037 (t-test) and 0.034 0.034 (SPA), respectively. It can be found that themodels using selected variables have lower prediction errors as well as higher stability interms of smaller standard deviations, indicating that variable selection can improve thewww.intechopen.com
Model Population Analysis for Statistical Model Comparison17Fig. 11. The distributions of misclassification error on 1000 test sets using all variables andvariables selected by t test and SPA, respectively.performance of a classification model. The reason why SPA performs better than t-test isthat synergistic effects among multiple variables are implicitly taken into account in SPAwhile t-test only considers univariate associations.Fig. 12. The distributions of D values. The P values of t test for these three distributions are1.66 10-46, 1.02 10-57 and 1.27 10-8.www.intechopen.com
18Chemometrics in Practical ApplicationsWe conducted pair-wise comparison of performances of the three variable sets descri
Model Population Analysis for Statistical Model Comparison 5 All these N sub-models are mutually different but have the same goal that is to predict the response value y . 2.1.3 Statistically analyzing an inter esting output of all the sub-models The core of model population analysis is sta