Transcription
Register online at www.chappellseminars.comJumpstart: Wireshark 101 (02/09/10)Notes:Wireshark Jumpstart: Wireshark 101Live Online Seminar – www.chappellseminars.comPresenter: Laura Chappell, Founder of Chappell University and w me: www.twitter.com/LauraChappellRead my blog at chappellseminars.comThe phone rings multiple lines at one time never a good sign. The users arecomplaining about network performance again. They never call to say thenetwork is doing great today – they don’t remember the numerous days whenthe network supported their every whim. No. They only call to complain. Beingan IT support person is a thankless job.In this live online seminar, Laura Chappell explains and demonstrates the keytasks using Wireshark, the world’s most popular network analyzer.This event is sponsored by US! Yep – we didn’t open this to sponsorshipbecause we want to tell you about the All Access Pass at chappellU.com. Chappell University – All Rights Reserved1
Register online at www.chappellseminars.comJumpstart: Wireshark 101 (02/09/10)Notes:I have lots of resources online: Follow me on Twitter (laurachappell) Read my weekly blog (linked at chappellseminars.com) Sign up for the weekly Newsletter (chappellseminars.com/newsletter.html) Check out the Wireshark Weekly Tips (www.wiresharktraining.com/tips.html) Watch some of the videos I uploaded to SecurityTube.netCheck out the other online seminars and keep learning even if it is an hour at a time. The schedule isonline at chappellseminars.com/schedule.html.Upcoming courses include:Top 10 Reasons Your Network is Slow [Recorded Version Available]WLAN Analysis 101Wireshark Jumpstart [Recorded Version Available]Internet Investigations: Traceback to a HostAnalyzing and Improve Network Throughput [Recorded Version Available]Hacked Hosts: Network Forensics [Recorded Version Available]Trace File Analysis #2: HTTPTrace File Analysis #3: All TCP Chappell University – All Rights Reserved2
Register online at chappellseminars.com!Jumpstart: Wireshark 101 (02/09/10)Notes:The Wireshark BookOver 800 pages of tips, tricks and techniques to troubleshoot and secure your networks moreefficiently using Wireshark, the world’s most popular network analyzer.The book will be available through Chappell University, Wireshark University and all themajor online booksellers worldwide. Chappell University – All Rights Reserved3
Contents iContents at a GlanceChapter 1: The World of Network Analysis . 1Chapter 2: Introduction to Wireshark . 23Chapter 3: Capture Traffic . 79Chapter 4: Create and Apply Capture Filters . 109Chapter 5: Define Global and Personal Preferences . 127Chapter 6: Colorize Traffic . 153Chapter 7: Define Time Values and Interpret Summaries . 167Chapter 8: Interpret Basic Trace File Statistics . 187Chapter 9: Create and Apply Display Filters . 215Chapter 10: Follow Streams and Reassemble Data. 239Chapter 11: Customize Wireshark Profiles . 255Chapter 12: Save, Export and Print Packets . 269Chapter 13: Use Wireshark’s Expert System. 285Chapter 14: TCP/IP Analysis Overview . 301Chapter 15: Analyze Domain Name System (DNS) Traffic . 313Chapter 16: Analyze Address Resolution Protocol (ARP) Traffic . 331Chapter 17: Analyze Internet Protocol (IPv4) Traffic. 343Chapter 18: Analyze Internet Control Message Protocol (ICMP) Traffic. 361Chapter 19: Analyze User Datagram Protocol (UDP) Traffic . 377Chapter 20: Analyze Transmission Control Protocol (TCP) Traffic . 387Chapter 21: Graph IO Rates and TCP Trends . 417Chapter 22: Analyze Dynamic Host Configuration Protocol (DHCP) Traffic . 443Chapter 23: Analyze Hypertext Transfer Protocol (HTTP) Traffic . 459Chapter 24: Analyze File Transfer Protocol (FTP) Traffic . 493Chapter 25: Analyze Email Traffic . 511Chapter 26: Introduction to 802.11 (WLAN) Analysis . 527Chapter 27: Introduction to Voice over IP (VoIP) Analysis . 563Chapter 28: Baseline “Normal” Traffic Patterns . 587Chapter 29: Find the Top Causes of Performance Problems . 599Chapter 30: Network Forensics Overview . 615Chapter 31: Detect Scanning and Discovery Processes . 629Chapter 32: Analyze Suspect Traffic . 665Chapter 33: Effective Use of Command-Line Tools . 697Appendix A: Resources on the Book DVD . 731Index – LCLC slugs. 770Wireshark Network Analysis - The Official Wireshark Certified Network Analyst Study Guide
Register online at www.chappellseminars.comJumpstart: Wireshark 101 (02/09/10)Notes:These are the areas we will discuss in today’s seminar. What is Wireshark? I’ll show you a diagram of the elements of Wireshark.Placing the Analyzer. Do this right and save yourself loads of time.Capture and Display Filters. Focus on specific types of traffic.Spotting Problems. Let the Expert Info Composite window guide you.Basic Traffic Graphs: a picture is worth a thousand packets!Overview of Command-Line Tools. Sometimes you need to go command-line.Q & A. I’ll get to as many questions as time permits.So let’s get started. Chappell University – All Rights Reserved4
Register online at www.chappellseminars.comJumpstart: Wireshark 101 (02/09/10)Notes:Too often I am called onsite to troubleshoot a network after everyone has pulled their hairout. It boggles the mind. Why didn’t these people put an analyzer on the network and look atthe traffic?The packets never lie!Wireshark is a FIRST RESPONDER tool. Network slow? Get the trace! Can’t connect? Get thetrace! System behaving strangely? Get the trace!Network analysis can always tell you WHERE the problem is, but it cannot always tell youWHY the problem is happening. Chappell University – All Rights Reserved5
Register online at chappellseminars.com!Jumpstart: Wireshark 101 (02/09/10)Notes:When you are capturing traffic off the network using Wireshark, you are likely using one ofthree possible drivers.WinPcap driverUsed on Windows hosts running Wireshark.AirPcap driverUsed to capture WLAN traffic on a Windows host.Libpcap driverUsed to capture traffic on a *nix host.The first filter applied is the Capture filter. If you apply a capture filter for all broadcast traffic,that is what will be passed up to the capture engine. You can’t go back and get packets thatwere filtered out from view using capture filters, so use these sparingly. Chappell University – All Rights Reserved6
Register online at chappellseminars.com!Jumpstart: Wireshark 101 (02/09/10)Notes:You do not need WinPcap, AirPcap or Libpcap in order to open up trace files. Those driversare used to capture traffic on the network.When you open a trace file, you are using the wiretap library which supports numerous tracefile formats including trace file formats used by Network General Sniffer, WildpacketsOmniPeek, Snoop and more.Select File Open and click the down arrow to the right of File Type to see the list ofrecognized file types. Chappell University – All Rights Reserved7
Register online at chappellseminars.com!Jumpstart: Wireshark 101 (02/09/10)Notes:Dissectors, plugins and display filters are applied once the packets are passed up either bythe capture engine or the wiretap library into the core engine.Dissectors/plugins interpret the contents of the packet and are a key component ofWireshark enabling you to ‘read’ packets and see interpreted fields.The display filters enable you to select which packets to view based on specific criteria thatyou define. Display filters do not affect the trace file itself – they only affect which packetsyou view.The GIMP ToolKit (commonly referred to as GTK ) provides the graphical interface forWireshark. GTK was initially developed for and used by GIMP, the GNU Image ManipulationProgram. It is used by a large number of applications including the GNU project's GNOMEdesktop.Select Help About Wireshark Folders to find where the various Wireshark files arelocated. Starting in Wireshark v1.2, the locations listed are hyperlinked so you can quicklyopen folders. Chappell University – All Rights Reserved8
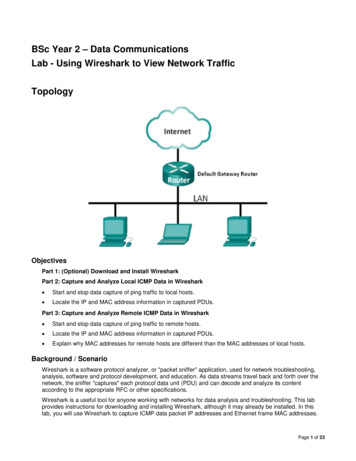
Register online at www.chappellseminars.comJumpstart: Wireshark 101 (02/09/10)Notes:Place the Analyzer Appropriately: Switched networks can causes the analyst grief – blockingthe traffic from easy view. We’ll go through four ways to capture wired network traffic and afew ways to capture WLAN traffic next. Hey – if you can’t see the packets, you are blind tothe problem.Create Baselines: Baselines are sample trace files of traffic when life was good this will beon your ‘To Do’ list if not.Filter on Specific Conversations or Types of Traffic: If Fred is complaining about his webbrowsing speeds you could start with a filter on just Fred’s HTTP/HTTPS traffic.Look for “Hot” Problems: Pay attention to Wireshark’s Expert Info Composite information.Create Key Graphs: A picture is worth a thousands words. In this case, an IO graph is worth athousand packets. Chappell University – All Rights Reserved9
Register online at www.chappellseminars.comJumpstart: Wireshark 101 (02/09/10)Notes:Unless you are the IT slave at an old school that still supports hubs, you are likely working in aswitched environment.Love ‘em or hate ‘em, switches are necessary network traffic cops. From the analyst’sperspective, however, they reduce visibility by limiting the forwarding traffic of traffic fromunnecessary paths or segments.Switches forward four types of packets by default: Broadcasts (MAC-layer broadcasts)Multicasts (MAC-layer multicasts) – if configured to do soTraffic to/from the connected host’s MAC addressTraffic to unknown MAC addresses (I hope you never see this)We’d be blind to Fred’s traffic to the server if we placed the analyzer off the switch as shownin the graphic.So what can we do what CAN we do?! Chappell University – All Rights Reserved10
Register online at www.chappellseminars.comJumpstart: Wireshark 101 (02/09/10)Notes:The first thing we can do (although one of my least-desired options) is just run Wireshark offFred’s machine.Yeah it’s an easy solution, but filled with risks we typically don’t want to alter the systemthat is having problems. Network analysis is a passive, non-invasive process. I often compareit to an x-ray machine – “oh look your foot is broken in two places no more Dancing withthe Stars for you!” Imagine if the x-ray machine was embedded in your foot to find theproblem – ouch.I also detest the idea of showing Fred that his system can run Wireshark. Fred is, after all, the“User from Hell” and in this case, ignorance is bliss his ignorance is my bliss.But sometimes that is the only feasible option. Start Wireshark running in the background(maybe with a nice ring buffer – we’ll discuss that later in this class) and tell Fred to ‘do hisstuff’ and show you what he’s experiencing.Be sure to uninstall Wireshark afterwards! Chappell University – All Rights Reserved11
Register online at www.chappellseminars.comJumpstart: Wireshark 101 (02/09/10)Notes:This option only works on half-duplex networks.A stinkin’ old hub can save your hide!Hubs are stupid all they know are 1s and 0s and they forward every bit in every direction(except back they way the bits came in). By placing a hub along the path between Fred andthe switch and plugging my analyzer into the hub, I get to see all Fred’s traffic.Watch out for those 10/100/1000 hubs though. If you have a speed mismatch on theconnecting devices that hub may act as a switch between the different speed devices.Test this first before you need it. Connect two hosts and your analyzer to a hub. Make sureyou can see the devices pinging each other. There are a lot of ‘hubs’ that are cross-dressers –they are actually switches. There’s no truth in advertising these days (especially in the techworld). Chappell University – All Rights Reserved12
Register online at www.chappellseminars.comJumpstart: Wireshark 101 (02/09/10)Notes:If you are working on a full-duplex network, a hub ain’t gonna cut the mustard (aka “won’t work” formy international attendees).To tap into a full-duplex network, you’ll need a full-duplex tap. Simply connect it up just as you didthe hub and away you go! Uh except for one thing There are many variations of full-duplex tap out there. The main differentiator is, of course, speed(10/100/1000) and port type (copper/fiber). Past that, you also have non-aggregating taps andaggregating taps.Non-Aggregating TapsThese taps have two output ports and do not combine the full-duplex streams in each direction. Youneed to hang two analyzers off these taps to see bi-directional communication. Use File Merge orthe command-line mergecap utility to combine multiple trace files.Aggregating TapsWell worth the money. These taps combine the bi-directional data and forward it out one monitorport (or two if you have a regenerating that and want to place something else – maybe a Snort box –off the extra port).RECOMMENDED READING: Net Optics wrote up a great paper on capturing traffic using a tap vs.spanning a switch. Get the paper at d-spanports.pdf. Chappell University – All Rights Reserved13
Register online at chappellseminars.com!Jumpstart: Wireshark 101 (02/09/10)Notes:This is the whitepaper that I refer to in the class – it’s very well written and helpsdifferentiate between using a tap to capture your traffic or spanning a switch port.After the seminar you will be taken to the survey – if you want the Best Practices Guide, letus know in the survey.Best Practices Guide Basic best practices Types of taps – aggregating, regenerating taps, link aggregation taps, etc. Advance best practices Chappell University – All Rights Reserved14
Register online at www.chappellseminars.comJumpstart: Wireshark 101 (02/09/10)Notes:Easy, eh?Port A connects to the switch. Port B connects to the target. Port C connects to your analyzer.There are a lot of variations possible when you’re looking for a tap.Hmmm but what’s the chance a company is going to let me disconnect their server fromthe network to install my full-duplex tap? Not likely so that’s when I go the next route Chappell University – All Rights Reserved15
Register online at www.chappellseminars.comJumpstart: Wireshark 101 (02/09/10)Notes:Non-manageable switches are great for home networks – they DO NOT, however, belong onthe corporate network.All of your switches should have the ability to do port spanning (aka port mirroring). Portspanning enables you to have a copy of all network traffic flowing from another switch portdown your switch port. It’s relatively passive, but not totally passive as you did reconfigurethe switch – and if the switch is the problem, such reconfiguration may ‘solve the problem’or give the switch enough of a kick in the behind to get it working properly most likely onlyuntil you have critical network traffic again – then it will fail again.DON’T GET ME STARTED on ‘port sampling’. What good is it to see only a piece of an x-rayresult? Aargh!Make sure you test out your spanning commands and ensure your switch spans portsproperly. Even the highest and mightiest of switch manufacturers seems to have stumbledfrom time to time in implementing this necessary feature. Chappell University – All Rights Reserved16
Register online at www.chappellseminars.comJumpstart: Wireshark 101 (02/09/10)Notes:Oh yeah wireless!Ok here’s the scoop. You can just select your wireless adapter to begin monitoring traffic –it most likely will let you see your traffic. But uh what about Fred’s traffic? Most NICswon’t go into full monitor mode and allow you to see other folk’s traffic.This is where a Windows host has an advantage (amazing to hear myself say that ). CACETechnologies (where Gerald Combs, creator of Wireshark, and Loris Degioanni and GianlucaVarenni, creators of WinPcap, work) has AirPcap adapters.These three AirPcap adapters should be connected to your system via USB hub most likely.With the AirPcap aggregating driver you can now see all the traffic on three channelssimultaneously. Just too cool. CACE also has WiFi Pilot now that bundles with Megageek’sWi-Spy adapter for spread spectrum analysis (I demonstrate this adapter live in the “Top 10Reasons Your Network is Slow” class – check it out).DISCOUNT CODE FOR AIRPCAP ADAPTERS: wsu210 – order at cacetech.com. Chappell University – All Rights Reserved17
Register online at chappellseminars.com!Jumpstart: Wireshark 101 (02/09/10)Notes:These are the functions that I consider key when you are analyzing networks: Choosing the InterfaceCapture FilteringCapturing to File SetsCapturing with a Ring BufferAltering the Time ColumnDisplay Filtering (new auto-complete)Using the Expert Info CompositeDefining ProfilesReassembling StreamsI will cut down the time spent on slides so I can get into the demo process a.s.a.p. in thistraining. Chappell University – All Rights Reserved18
Register online at chappellseminars.com!Jumpstart: Wireshark 101 (02/09/10)Notes:You have many options when starting your capture.You could just capture a single file and (a) manually stop the capture or (b) set a stop trigger.You could capture a file set that you (a) manually stop or (b) stops based on a trigger.To control the number of trace files created you can use a ring buffer which is a FIFO (first in, first out)buffer.Triggers for Multiple FilesNext file every x kilobytes, megabytes, gigabytes (careful of file size)Next file every x seconds, minutes, hours, days (again watch the size)Ring buffer with x filesStop capture after x filesStop Triggers after x packets after x kilobytes, megabytes, gigabytes (you know the warning) after x seconds, minutes, hours, days (yup same thing) Chappell University – All Rights Reserved19
All Access Pass Special Event: New WiresharkFeatures2/8/2010Notes:These are some of the cool new features available in the upcoming Wireshark 1.4 version.If you are an All Access Pass member, a video on these new functions is going up in the 00Chappell Seminar Series folder.Need more information on the All Access Pass, visit www.chappellU.com.Copyright 2010 Chappell University20
Register online at www.chappellseminars.comJumpstart: Wireshark 101 (02/09/10)Notes:Here are some of the things to know:Examining the InterfacesSelect Capture Interfaces to see the active interfaces and check out the interface details, start capturing rightaway or set up your capture options.Capture FiltersMake a ‘Not Me’ capture filter to filter out your traffic from your trace files. You don’t want your email or webbrowsing session to be captured when you are working on Fred’s network problems. The syntax for a “Not Me”capture filter is not ether host 00:21:97:40:74:d2 (with your MAC address).Set the Time CorrectlyUse Edit Time Display Format Seconds Since Previous Displayed Packet to see the delta time from the end ofone packet to the end of the next. Now you can sort the time column to see large gaps in time!Listen to the ExpertSelect Analyze Expert Info Composite to identify possible problems seen in the trace file. Expand the findingsto locate specific packets in the trace.Check the IO RateSelect Statistics IO Graph to note when the IO rate drops. Click anywhere on the IO graph to locate that areain the trace. Chappell University – All Rights Reserved21
Register online at www.chappellseminars.comJumpstart: Wireshark 101 (02/09/10)Notes:Here are some of the things I’m going to demonstrate (continued):Measure PainLearn to measure time between packets spread throughout the trace. Select the start point and right click.Choose Set Time Reference (toggle). You might be prompted for the time format change. Scroll down to thenext time measurement and the time column now shows you the time from the Time Referenced packet to thisone. You can set multiple Time Reference packets in the trace if desired.Right-Click FilteringIn my example, I want to find out if the trace includes BOTH the original and the retransmitted TCP packet (finda retransmission packet). Inside the TCP header, I right clicked the TCP Sequence Number field and said Prepareas a Filter (just so I can look at the filter before it gets applied). When you apply the filter I will learn if I amupstream (before packet loss occurs) or downstream (after packet loss has occurred) on the network.Custom ColumnsTime permitting I also wanted to show you how to add a column for the TCP Window Size field value toWireshark’s summary pane. Click the field to see the field name in the status bar at the bottom of theWireshark window. This field is called tcp.window size. Now select Edit Preferences Columns New [name:WinSize]. In the Format area, select Custom. A new blank window shows up on the right of the Formatfield. Type in your field name, tcp.window size. Click OK and now look at your summary window (you mightneed to scroll to the right to see your new column). Cool! Chappell University – All Rights Reserved22
Register online at www.chappellseminars.comJumpstart: Wireshark 101 (02/09/10)Notes:Now what?! Here’s a quick list of ‘to do’ items for you after this class.1. C’mon upgrade to Wireshark: There’s NO REASON to be working with the old Ethereal software –it’s outdated and end-of-lifed. Get to www.wireshark.org and update to the latest version ofWireshark.2. Test analyzer placement: Make sure you feel comfortable with your capture options – hubbing out,tapping out, WLAN AirPcaps, spanning, etc.3. Baseline your network traffic: Know what’s normal. Take baselines of host startup processes,connection to the key network devices, shutdown, etc.4. Learn to filter (capture AND display): Work with both types of filters. Become a filter guru to saveyourself loads of time when analyzing network problems.5. Don’t ignore the Expert Info: Always give a nod to the Expert Info Composite findings – verify thealerts listed by looking at the trace in-depth.6. Learn TCP/IP at packet level: Installing and configuring a TCP/IP network is entirely different fromanalyzing the traffic. Get to know TCP/IP inside and out – that includes ARP, IP, TCP, UDP, DHCP,ICMP, HTTP, POP, SMTP, etc. Check out the three trace analysis courses at chappellseminars.com.7. Watch for the new Wireshark Network Analysis book for documented techniques on analyzingwired and wireless networks. Chappell University – All Rights Reserved23
Register online at www.chappellseminars.comJumpstart: Wireshark 101 (02/09/10)Notes:Now we move on to live Q & A.Remember to follow me on Twitter and check out my blog.Check out the other online seminars and keep learning even if it is an hour at a time.Upcoming courses at ChappellSeminars.com include:Top 10 Reasons Your Network is Slow [Recorded Version Available]WLAN Analysis 101Wireshark Jumpstart [Recorded Version Available]Internet Investigations: Traceback to a HostAnalyzing and Improve Network Throughput [Recorded Version Available]Hacked Hosts: Network Forensics [Recorded Version Available]Trace File Analysis #2: HTTPTrace File Analysis #3: All TCP [Recorded Version Available] Chappell University – All Rights Reserved24
Register online at www.chappellseminars.comJumpstart: Wireshark 101 (02/09/10)Notes:Well thanks much for attending the online live seminar.You can help us guide the content, length, pricing and format of these courses by sendingyour thoughts to me at laura@chappellseminars.com or writing something in the Contact Uspage at www.chappellseminars.com.Now I ask a favor Please help us reach out to the IT community to let them know about these online seminars. Chappell University – All Rights Reserved25
network is doing great today –they don’t remember the numerous days when the network supported their every whim. No. They only call to complain. Being an IT support person is a thankless job. In this live online seminar, Laura Chappell explains and demonstrates the key tasks using Wireshark, th