Transcription
Copyright Wireshark University 1Wireshark 101Essential Skills for Network AnalysisStudent Manual2nd EditionAlways ensure you have proper authorizationbefore you listen to and capture network traffic.Protocol Analysis Institute, Inc59 Damonte Ranch Parkway, #B340Reno, Nevada 89521 USAwww.packet-level.comWireshark raining.comStudent Manual: Wireshark 101: Essential Skills for Network Analysis (2nd Edition) ! www.wiresharktraining.com
Copyright Wireshark University 2Copyright 2016, Protocol Analysis Institute, Inc., dba Chappell University and Wireshark University. All rightsreserved. No part of this Student Manual, or related materials, including interior design, cover design, and contentsof the Student Manual, All Access Pass web site, www.lcuportal2.com, may be reproduced or transmitted in any form,by any means (electronic, photocopying, recording, or otherwise) without the prior written permission of thepublisher.To arrange bulk purchase discounts for sales promotions, events, training courses, or other purposes, please contactChappell University via email (info@chappellU.com), phone (1-408-378-7841), or mail (59 Damonte Ranch Parkway,#B340, Reno, NV 89521).This Student Manual and course are based on the book, “Wireshark 101: Essential Skills for Network Analysis,” availableworldwide in print and electronic version. For more information, visit www.wiresharkbook.com.Distributed worldwide for Chappell University through Protocol Analysis Institute, Inc. Protocol Analysis Institute,Inc. is the exclusive educational materials developer for Chappell University.For general information on Chappell University or Protocol Analysis Institute, Inc., including information oncorporate licenses, updates, future titles, or courses, contact the Protocol Analysis Institute, Inc., at 408/3787841 orsend email to info@chappellU.com.Trademarks. All brand names and product names used in this Student Manual or mentioned in this course are tradenames, service marks, trademarks, or registered trademarks of their respective owners. Wireshark and the “fin” logoare registered trademarks of the Wireshark Foundation.Limit of Liability/Disclaimer of Warranty. The author and publisher have used their best efforts in preparing thisStudent Manual and the related materials used in this Student Manual. Protocol Analysis Institute, Inc., ChappellUniversity, and the author(s) make no representations or warranties of merchantability of fitness for a particularpurpose. Protocol Analysis Institute, Inc., and Chappell University assume no liability for any damages caused byfollowing the instructions or using the techniques or tools listed in this Student Manual or related materials used inthis course. Protocol Analysis Institute, Inc., Chappell University, and the author(s) make no representations orwarranties that extend beyond the descriptions contained in this paragraph. No warranty may be created or extendedby sales representatives or written sales materials. The accuracy or completeness of the information provided hereinand the opinions stated herein are not guaranteed or warranted to produce any particular result and the advice andstrategies contained herein may not be suitable for every individual. Protocol Analysis Institute, Inc., ChappellUniversity, and author(s) shall not be liable for any loss of profit or any other damages, including without limitation,special, incidental, consequential, or other damages.Copy Protection. In all cases, reselling, renting, or duplication of this Student Manual and related materials used inthis training course without explicit written authorization is expressly forbidden. We will find you, ya know. So don’tsteal or plagiarize this Student Manual or related materials.Student Manual: Wireshark 101: Essential Skills for Network Analysis (2nd Edition) ! www.wiresharktraining.com
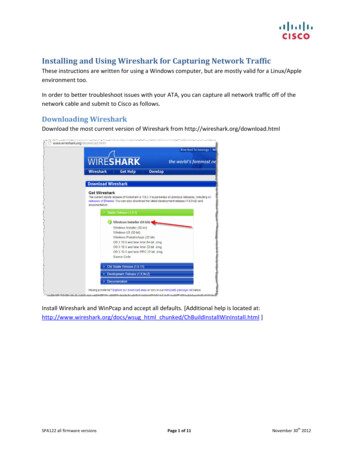
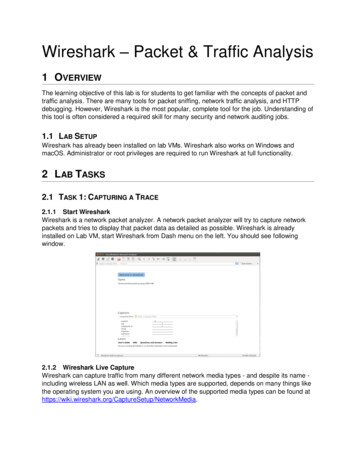
!Copyright Wireshark University 3Lab 1: Use Packets to Build a Picture of a NetworkWhen you are analyzing traffic, try to get a feel for the network layout from what you can learn in thepackets. Who is sending the packets? Who are the targets? What are their MAC and IP addresses? Ifmultiple hosts talk through a device, it is likely a router. Switches are transparent, but you must assumethat clients go through switches to reach a router.In this lab you will examine the MAC and IP addresses to build a picture of a portion of a network. Inaddition, you will look at the Protocol column to determine what applications are running on varioushosts. Red text indicates that we just learned this information from the current frame.Frame 1Launch Wireshark, click the File Open buttongeneral101.pcapng to open this file.on the main tool bar and double-click onExamine the Packet List pane. Frame 1 uses IPv6. Look in the Ethernet and IP headers for this frame inthe Packet Details pane (shown below). This appears to be an IPv6 multicast (note the IPv6mcastdesignation in the destination Ethernet address field).Student Manual: Wireshark 101: Essential Skills for Network Analysis (2nd Edition) ! www.wiresharktraining.com
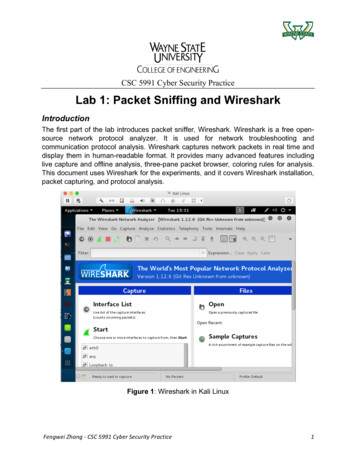
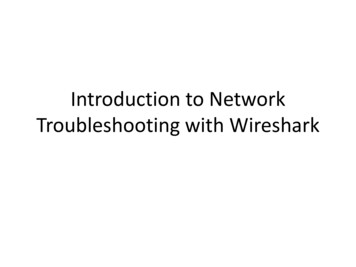
Copyright Wireshark University 4Frame 2Frame 2 is an ARP packet. Look inside the Ethernet header then inside the ARP portion of the packet.This ARP request is sent to locate the MAC address of the Target IP Address.Frame 3Frame 3 is a TCP handshake packet to the HTTP port. Again, look in the Ethernet header and IP header tobuild your picture of the network. Since the target has not responded, we really can’t say the target isthere. We will mark it with a question mark until we see it talk on the network.Student Manual: Wireshark 101: Essential Skills for Network Analysis (2nd Edition) ! www.wiresharktraining.com
Copyright Wireshark University 5Student Manual: Wireshark 101: Essential Skills for Network Analysis (2nd Edition) ! www.wiresharktraining.com
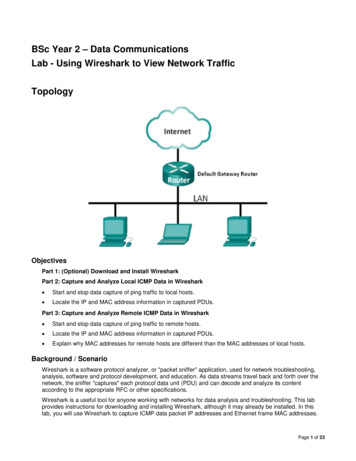
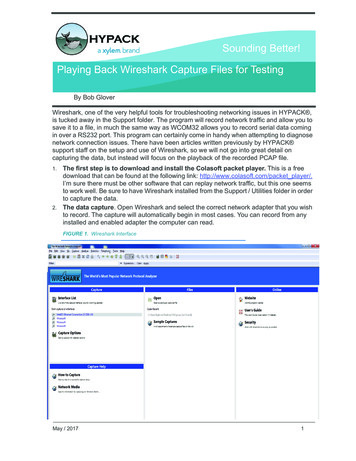
Copyright Wireshark University 6Frame 4Frame 4 is the reply to frame 3. We can now draw in the new HTTP server in our diagram. Look at thesource MAC address in frame 4. It comes from the router, not the source server.Remember that routers strip off the received MAC header and apply a new MAC header. The new MACheader contains the address of the router’s interface on this network as the new source MAC address andthe address of the destination device as the new destination MAC address. This is how a router forwardsa packet. On your local network, you may see traffic from many different IP addresses come from theMAC address of the local router.Frame 5 finishes the TCP 3-way handshake.Student Manual: Wireshark 101: Essential Skills for Network Analysis (2nd Edition) ! www.wiresharktraining.com
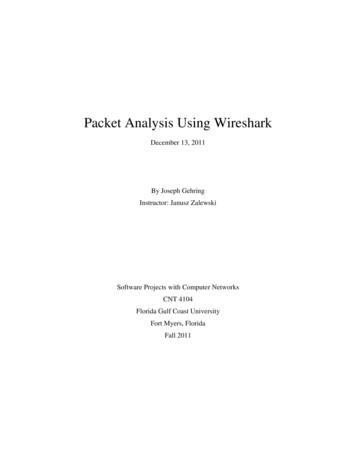
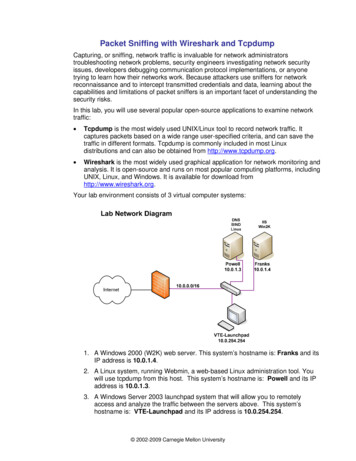
Copyright Wireshark University 7Frame 6Frame 6 is a Dropbox LAN Sync Discovery Protocol (DB-LSB-DISC) packet from our client. This packet issent to the broadcast address.Frame 7Frame 7 is another TCP handshake packet, but we have a new source and destination. We can now drawin a new source MAC and IP address and a new destination IP address. We must wait for the target tosend a packet before we say it is definitely there.Student Manual: Wireshark 101: Essential Skills for Network Analysis (2nd Edition) ! www.wiresharktraining.com
Copyright Wireshark University 8Frame 8Frame 8 is the answer from the HTTP server (199.59.150.9). We now know that this server is talking on thewire. Frame 9 is the final piece of the TCP handshake.Frame 10Student Manual: Wireshark 101: Essential Skills for Network Analysis (2nd Edition) ! www.wiresharktraining.com
Copyright Wireshark University 9Frame 10 indicates that the other local host is trying to connect to another server. This time the target isport 443, the HTTPS port.Frame 11Frame 11 is a response from the target. We can now assume the target is running. Frame 12 finishes theTCP handshake and our drawing of the network we discovered just by looking at these first few packetsin the trace file.Student Manual: Wireshark 101: Essential Skills for Network Analysis (2nd Edition) ! www.wiresharktraining.com
Copyright Wireshark University 10As you can see, lots of different conversations are occurring simultaneously. We can build a picture of thenetwork based on the packets we see. Building an image of a network based on traffic is a common taskused in analysis.Student Manual: Wireshark 101: Essential Skills for Network Analysis (2nd Edition) ! www.wiresharktraining.com
Copyright Wireshark University 11!Lab 2: Capture and Classify Your Own Background Traffic (Optional) –NOTE Sparklines not WorkingTake a moment and capture your own background as we did in this section. When you complete yourcapture, perform some research on the resulting trace file to see if you can characterize all the traffic to/from your machine when you are not touching the keyboard.Step 1:Close all applications except for Wireshark and any normal background applications that runon your machine.Step 2:Click the Capture OptionsStep 3:Select the interface that sees active traffic.Step 4:Click Start. Let the capture run for at least five minutes (longer if you can wait).Step 5:Click the Stop Capture buttonbutton on the main toolbar.on the main toolbar.Spend some time going through the trace file to identify the applications that run in thebackground on your machine. Focus on the Protocol column and the Info column.If you don’t recognize the application, perform some research on the IP addresses that yoursystem communicates with. Most likely you will also see broadcast or multicast traffic fromother hosts on your network.Step 6:To save this file, click the Save buttonon the main toolbar, navigate to the target directory,and name your file background1.pcapng.Recognizing your own background traffic will help you remove this from consideration when looking forunusual communications. Consider saving trace files of your “normal” traffic to refer to whentroubleshooting.Student Manual: Wireshark 101: Essential Skills for Network Analysis (2nd Edition) ! www.wiresharktraining.com
Copyright Wireshark University 12!Lab 3: Open a Network Monitor .cap FileIn this lab you will use Wireshark’s Wiretap Library to open a file captured with Microsoft’s NetworkMonitor1 .Step 1:Click the File Open buttonon the main toolbar.Step 2:Navigate to your trace file directory and click on http-winpcap101.cap. Wireshark looks insidethe trace file to identify what tool was used to capture the traffic, as shown below. Althoughthis file was captured with Microsoft’s Network Monitor (NetMon) v3.4, Wireshark marks itas NetMon v2 because that is the format v3.4 saves in.Step 3:Click Open. Once the file is open, select File Save As and click the drop down menu arrownext to Files of Type. Select Wireshark – pcapng (*pcapng;*.pcapng.gz;*.ntar;*.ntar.gz) andname the file httpwinpcap101.pcapng.Wireshark can recognize and open trace files created with most other industry tools. Once open, the factthat this trace file was captured with Network Monitor is transparent to you.1Microsoft Network Monitor was replaced with Microsoft Message Analyzer, but Message Analyzer can still savetrace files in the native Network Monitor .cap format.Student Manual: Wireshark 101: Essential Skills for Network Analysis (2nd Edition) ! www.wiresharktraining.com
!Copyright Wireshark University 13Lab 4: Add the HTTP Host Field as a ColumnDuring a browsing session, an HTTP client sends requests for HTTP objects to one or more HTTP servers.In each of the requests, the client specifies the name or the IP address of the target HTTP server. This canbe very revealing.Note: All frames from 24.6.173.220 will appear with a black background and red foreground if Wireshark is set tovalidate IP header checksums. You will ensure this feature is disabled in Lab 5.Step 1:Click the File Open buttonon the main toolbar and open httpdisney101.pcapng.Step 2:First we will hide the Time to Live column (if you created one while following along with theprevious section of this book). Right-click the Time to Live column heading and uncheck thatcolumn in the drop-down menu. If you want to see that column again later, simply right-clickon any column heading and click it in the column list to enable it.Step 3:Scroll down in the Packet List pane and select frame 15.Step 4:The Packet Details pane shows the contents of frame 15. Click the in front of HypertextTransfer Protocol to expand this section of the frame.Step 4:Right-click on the Host line (which contains www.disney.com\r\n) and select Apply asColumn. Your new Host column appears to the left of the Info column. You can click and dragthe right-hand edge of the column to widen or narrow the column.Step 5:Click on the Host column heading twice to sort the column from high to low.Step 6:Click the Go to First buttonto jump to the top of the sorted trace file. You can now easilysee all the hosts to which the client sent requests, as shown below.Step 7:Lab Clean-up Right-click on your new Host column heading and select Hide Column. If youwant to view this column again, right-click any column heading and select DisplayedColumns Host (http.host).Adding and sorting columns are two key tasks that can shorten your analysis time significantly. Why gosearching through thousands of packets when you can have Wireshark quickly gather and display theinformation you need?Student Manual: Wireshark 101: Essential Skills for Network Analysis (2nd Edition) ! www.wiresharktraining.com
Copyright Wireshark University 14Lab 5: Set Key Wireshark Preferences (IMPORTANT LAB)2Wireshark offers several key preference settings to enhance your analysis sessions. In this lab you will useEdit Preferences on the main menu and the right-click method to view and change the preferencesettings.These are the settings we will view and alter in this lab: Display filters that Wireshark will rememberRecently opened files that Wireshark will rememberEthernet, IP, UDP, and TCP checksum validationsTCP Calculate conversation timestamps settingTCP Track number of bytes in flight settingTCP Allow subdissector to reassemble TCP streams settingNote: Your Wireshark system should retain all of these settings through the rest of this course with theexception of the TCP Allow subdissector to reassemble TCP streams setting, which you will work with duringvarious labs.Step 1:Open http-pcaprnet101.pcapng.Step 2:Select Edit Preferences on the main menu.Step 3:Change both the filter entries and recent files settings to 30.These two settings allow you to quickly recall more of your recent filter settings and openedfiles.Step 4:Click OK. This automatically applies and saves your settings in this Default profile and closesthe Preferences window.Next we will use the right-click method to check and change the Ethernet, IP, UDP, and TCPsettings.We will begin by disabling the Ethernet checksum validation (which is enabled by default).Next, we will ensure IP, UDP, and TCP checksum validations are disabled 3. These threechecksum validations should already be disabled unless you updated Wireshark whileretaining previous settings.2The remaining labs in this course assume you have successfully completed this lab.3Most systems support checksum offloading. If Wireshark obtains a copy of an outbound frame before thechecksum values have been calculated, it will mark the checksums invalid. This is a false positive when capturingtraffic directly on a host that supports checksum offloading.Student Manual: Wireshark 101: Essential Skills for Network Analysis (2nd Edition) ! www.wiresharktraining.com
Copyright Wireshark University 15Step 5:With frame 1 selected in the Packet List pane, right-click on the Ethernet II section of thePacket Details pane and hover over the Protocol Preferences option on the drop-down menu.If this setting is enabled (checked), click on the Validate the Ethernet checksum if possiblesetting to disable it.Student Manual: Wireshark 101: Essential Skills for Network Analysis (2nd Edition) ! www.wiresharktraining.com
Copyright Wireshark University 16Step 6:With frame 1 still selected in the Packet List pane, right-click on the Internet Protocol sectionof the Packet Details pane and hover over the Protocol Preferences option on the drop-downmenu. If this setting is enabled (checked), click on the Validate the IPv4 checksum if possiblesetting to disable it.Step 7:Again, in frame 1, right-click the User Datagram Protocol section of the Packet Details paneand hover over the Protocol Preferences option from the drop-down menu. Uncheck Validatethe UDP checksum if possible setting if it is currently enabled.Step 8:Select frame 5 in the Packet List pane. Right-click the Transmission Control Protocol sectionof the Packet Details pane and, under Protocol Preferences, disable the Validate the TCPchecksum if possible setting if it is currently enabled.Student Manual: Wireshark 101: Essential Skills for Network Analysis (2nd Edition) ! www.wiresharktraining.com
Copyright Wireshark University 17Step 9:Since Wireshark closes the TCP protocol settings menu after you select an option, you mustright-click again on the Transmission Control Protocol section of the Packet Details pane toreview or change the following additional settings. Disabled: Allow subdissector to reassemble TCP streamsEnabled: Track number of bytes in flightEnabled: Calculate conversation timestampsStudent Manual: Wireshark 101: Essential Skills for Network Analysis (2nd Edition) ! www.wiresharktraining.com
Copyright Wireshark University 18Step 10:Now let’s see how a few of these settings affect the packet displays. Click on frame 8 in httppcaprnet101.pcapng. Expand the Transmission Control Protocol line, the SEQ/ACK analysis,and Timestamps section in the Packet Details pane.We can see that Wireshark is not validating the TCP checksum and that 287 bytes of data havebeen sent, but not acknowledged. In addition, we can see that this frame arrived about 20milliseconds (0.020 seconds) after the first frame of the TCP conversation (also referred to asthe TCP stream) and 778 microseconds (0.000778 seconds) after the previous frame of thisTCP conversation.You can easily use the right-click method to change protocol preferences, such as tracking time in eachTCP conversation and the number of unacknowledged bytes in a conversation. There are many otherapplication and protocol preference settings that can be set in either the Preferences window or throughthe right-click method.Student Manual: Wireshark 101: Essential Skills for Network Analysis (2nd Edition) ! www.wiresharktraining.com
!Copyright Wireshark University 19Lab 6: Create a New Profile Based on the Default ProfileProfiles enable you to work with customized settings to be more efficient when analyzing traffic. In thislab you will create a new profile called “wireshark101.” You will base it on your Default profile to ensureany previously created settings will be copied over to your new profile.Step 1:Right-click on the Profile column in the Status Bar and select Manage Profiles. (It does notmatter what profile is currently listed in the Profile column.)Step 2:Select Default from the list of available profiles and click the Copywireshark101 and press Enter. Click OK.button. Type the nameWireshark now displays your new profile in the Status Bar.In Lab 6 we worked with some key preference settings (such as Track number of bytes in flightand Calculate conversation timestamps) in the Default profile. Since your new profile is based onthe Default profile, these preference settings are also set in your wireshark101 profile.Wireshark remembers the last profile used when it is restarted. To change to another profile, click on theProfile area of the Status Bar and select another profile.Student Manual: Wireshark 101: Essential Skills for Network Analysis (2nd Edition) ! www.wiresharktraining.com
!Copyright Wireshark University 20Lab 7: Import a DNS/HTTP Errors ProfileOnce you’ve created that fabulous profile that detects various types of HTTP or DNS problems perhaps,consider installing that profile on your other Wireshark systems. Since Wireshark bases profiles on textfiles, this is a simple process.Step 1:The sample profile (httpdnsprofile101v2.zip) is located in the Supplements directory of yourStudent USB stick. This new profile’s directory and contents are zipped into a single file.Step 2:Select Help About Wireshark Folders. Double-click on your personal configuration folderto examine the directory structure.Step 3:As mentioned earlier, Wireshark creates a profiles directory when you build your first customprofile (as you did in Lab 7). If you do not see a profiles directory at this point, you canmanually create one or return to and complete Lab 7. Open the profiles directory.Step 4:Extract the httpdnsprofile101v2.zip file contents into this profiles directory. You should see anew directory called HTTP-DNS Errors. Look inside this new directory to see the Wiresharkconfiguration files included in this profile.Step 5:Return to Wireshark and click on the Profile column on the Status Bar. You should see the newprofile listed. Click on the HTTP-DNS Errors profile to examine this new profile.Student Manual: Wireshark 101: Essential Skills for Network Analysis (2nd Edition) ! www.wiresharktraining.com
Copyright Wireshark University 21Step 6:Open dns-nmap101.pcapng while working in your HTTP-DNS Errors profile. You should seesome interesting colors in the trace file and two new buttons in the display filter area.Step 7:Lab Clean-up Click the Profile column on the Status Bar and select your wireshark101profile. You will continue to enhance the wireshark101 profile in upcoming Sections of thiscourse.Remember that profiles are simply a collection of configuration text files. It is easy to move singleelements of a profile or entire profiles to other machines. If you work with a troubleshooting team,consider creating common Wireshark profiles that the entire team can use.Some configuration text files, such as the recent configuration file, contain directorypaths. This may generate Wireshark startup errors when you move these types ofconfiguration files to another system that does not have the same directory paths inplace. You could either avoid moving these files to another system or edit the relevantconfiguration files to match the directory structure of the target system.Student Manual: Wireshark 101: Essential Skills for Network Analysis (2nd Edition) ! www.wiresharktraining.com
!Copyright Wireshark University 22Lab 8: Spot Path and Server Latency ProblemsLet’s practice using these two columns to detect latency. In this lab you will set the Time column toSeconds Since Previous Displayed Packet and add the TCP Delta column.You may have some of these columns set already if you followed along with the previous section.Step 1:Open http-slow101.pcapng.Step 2:Right-click the Length column heading unselect the Length column to hide it. This providesmore room for your new column.Step 3:Select View Time Display Format Seconds Since Previous Displayed Packet. Click onyour Time column heading twice to sort from high to low. Click the First Packet buttonthe main toolbar. We can see some very high delays in this trace file.Now let’s see what happens when we add and work with a column that depicts TCPconversation timestamps.Step 4:Click on the No. (Number) column heading to return the trace file to its default sort order.Scroll up or click the Go to First buttonon the main toolbar to go to frame 1.Student Manual: Wireshark 101: Essential Skills for Network Analysis (2nd Edition) ! www.wiresharktraining.comon
Copyright Wireshark University 23Step 5:Right-click the TCP header in the Packet Details pane of frame 1 and select Expand Subtrees.Scroll down and right-click on the Time since previous frame in this TCP stream and selectApply as Column. You now have a new column in the Packet List pane, as shown below.Step 6:Right-click on the new column and select Edit Column. Type TCP Delta in the Title area andclick OK.As we sort on the TCP Delta column, keep in mind the types of traffic that can contain“normal delays” as listed in Don’t Get Fooled – Some Delays are Normal on page 88.Student Manual: Wireshark 101: Essential Skills for Network Analysis (2nd Edition) ! www.wiresharktraining.com
Copyright Wireshark University 24Step 7:Click on your new TCP Delta column heading and drag the column to the right of the existingTime column. Click twice on your new TCP Delta column heading to sort from high to low.Since there are multiple TCP conversations intertwined in this trace file, this TCP Deltacolumn gives an accurate display of latency times in the trace file.In the image below, we scrolled to the right to view more of the Info column (our Time columnis no longer in view).Do you see anything in common with the top delays in the traffic? There are several very largedelays before the HTTP server said “OK.” You can probably imagine that the user wouldcomplain about terrible performance when browsing to this web site.Step 8:Lab Clean-up Click once on the No. (Number) column heading to sort from low to high. Thisis the original sorting order of trace files.Right-click on the TCP Delta column heading and unselect that column from the list to hide it.If you want to view this column again later, you can right-click on any column heading andselect it from the column list.Look at the TCP delta times in your web browsing sessions, network logins, or email traffic. Get a feel forthe round trip latency times from your client to numerous hosts.Student Manual: Wireshark 101: Essential Skills for Network Analysis (2nd Edition) ! www.wiresharktraining.com
This Student Manual and course are based on the book, “Wireshark 101: Essential Skills for Network Analysis,” available worldwide in print and electronic version. For more information, visit www.wiresharkbook.com. Distributed worldwide for Chappell University through Protocol Analysis Institute, Inc. Protocol Analysis Institute,