Transcription
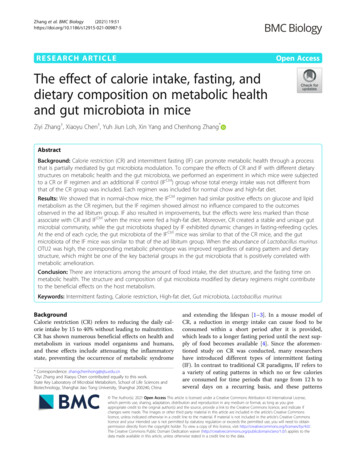
Zhang et al. BMC Biology(2021) EARCH ARTICLEOpen AccessThe effect of calorie intake, fasting, anddietary composition on metabolic healthand gut microbiota in miceZiyi Zhang†, Xiaoyu Chen†, Yuh Jiun Loh, Xin Yang and Chenhong Zhang*AbstractBackground: Calorie restriction (CR) and intermittent fasting (IF) can promote metabolic health through a processthat is partially mediated by gut microbiota modulation. To compare the effects of CR and IF with different dietarystructures on metabolic health and the gut microbiota, we performed an experiment in which mice were subjectedto a CR or IF regimen and an additional IF control (IFCtrl) group whose total energy intake was not different fromthat of the CR group was included. Each regimen was included for normal chow and high-fat diet.Results: We showed that in normal-chow mice, the IFCtrl regimen had similar positive effects on glucose and lipidmetabolism as the CR regimen, but the IF regimen showed almost no influence compared to the outcomesobserved in the ad libitum group. IF also resulted in improvements, but the effects were less marked than thoseassociate with CR and IFCtrl when the mice were fed a high-fat diet. Moreover, CR created a stable and unique gutmicrobial community, while the gut microbiota shaped by IF exhibited dynamic changes in fasting-refeeding cycles.At the end of each cycle, the gut microbiota of the IFCtrl mice was similar to that of the CR mice, and the gutmicrobiota of the IF mice was similar to that of the ad libitum group. When the abundance of Lactobacillus murinusOTU2 was high, the corresponding metabolic phenotype was improved regardless of eating pattern and dietarystructure, which might be one of the key bacterial groups in the gut microbiota that is positively correlated withmetabolic amelioration.Conclusion: There are interactions among the amount of food intake, the diet structure, and the fasting time onmetabolic health. The structure and composition of gut microbiota modified by dietary regimens might contributeto the beneficial effects on the host metabolism.Keywords: Intermittent fasting, Calorie restriction, High-fat diet, Gut microbiota, Lactobacillus murinusBackgroundCalorie restriction (CR) refers to reducing the daily calorie intake by 15 to 40% without leading to malnutrition.CR has shown numerous beneficial effects on health andmetabolism in various model organisms and humans,and these effects include attenuating the inflammatorystate, preventing the occurrence of metabolic syndrome* Correspondence: zhangchenhong@sjtu.edu.cn†Ziyi Zhang and Xiaoyu Chen contributed equally to this work.State Key Laboratory of Microbial Metabolism, School of Life Sciences andBiotechnology, Shanghai Jiao Tong University, Shanghai 200240, Chinaand extending the lifespan [1–3]. In a mouse model ofCR, a reduction in energy intake can cause food to beconsumed within a short period after it is provided,which leads to a longer fasting period until the next supply of food becomes available [4]. Since the aforementioned study on CR was conducted, many researchershave introduced different types of intermittent fasting(IF). In contrast to traditional CR paradigms, IF refers toa variety of eating patterns in which no or few caloriesare consumed for time periods that range from 12 h toseveral days on a recurring basis, and these patterns The Author(s). 2021 Open Access This article is licensed under a Creative Commons Attribution 4.0 International License,which permits use, sharing, adaptation, distribution and reproduction in any medium or format, as long as you giveappropriate credit to the original author(s) and the source, provide a link to the Creative Commons licence, and indicate ifchanges were made. The images or other third party material in this article are included in the article's Creative Commonslicence, unless indicated otherwise in a credit line to the material. If material is not included in the article's Creative Commonslicence and your intended use is not permitted by statutory regulation or exceeds the permitted use, you will need to obtainpermission directly from the copyright holder. To view a copy of this licence, visit http://creativecommons.org/licenses/by/4.0/.The Creative Commons Public Domain Dedication waiver ) applies to thedata made available in this article, unless otherwise stated in a credit line to the data.
Zhang et al. BMC Biology(2021) 19:51include daily time-restricted feeding, alternate-day fasting and 5:2 intermittent fasting (fasting for 2 days eachweek) [5–10]. Based on a meta-analysis of previous studies, IF exerts metabolic effects similar to those of CR,such as improving glucose metabolism by lowering insulin resistance [5, 11–14]. To effectively apply CR and IFin clinical practice, a strict comparison of the impacts ofthese dietary regimens with different dietary compositions is needed.Although preclinical studies and clinical trials haveshown that IF has broad-spectrum benefits for manyhealth conditions, following CR or IF for long periods isa major challenge in the application of fasting-based interventions for the treatment of metabolic syndromes inhumans [11, 15]. Further understanding the processesthat link IF with broad health benefits might help us develop targeted pharmacologic therapies that mimic theeffects of IF without the need to substantially alter an individual’s feeding habits. The mechanisms underlyingthe metabolism-modifying efficacy of CR and/or IF involve complicated pathways, and the gut microbiota isconsidered one of the important mediators of interactionbetween these dietary regimens and host metabolism[16]. It has been established that the total amount offood consumed, the dietary composition, and the eatingpattern affect metabolism by regulating the gutmicrobiome. Previous studies have revealed that bothshort- and long-term CR significantly change the gutmicrobiota structure, and only 2 weeks of CR intervention induced the establishment of a Lactobacillus-dominant microbial community in the mouse gut, whichdecreased the levels of circulating microbial antigensand systemic inflammatory markers such as tumornecrosis factor alpha (TNF-α) [17–20]. In obese humanadolescents, a 1-year CR period significantly reduces theFirmicutes to Bacteroidetes ratio and enriched beneficialmicroorganisms such as Bacteroides, Roseburia, Faecalibacterium, and Clostridium XIVa [21]. As an alternativeto CR, recent studies have shown that IF also exerts asignificant effect on the gut microbiota. The results froma study on the prevention of retinopathy in db/db miceshowed an increased level of Firmicutes and reducedVerrucomicrobia and Bacteroidetes after IF intervention[22]. Another study revealed that IF increases the gutbacterial richness and altered its composition and relatedmetabolic pathways [23]. Microbiota-depleted micetreated with antibiotics show resistance to the bodyweight loss and decrease in the blood glucose level induced by CR [24]. Under an every-other-day fasting regimen, white adipose tissue exhibited beigeing in thecontrol group and not in the microbiota-depleted groups[24, 25]. The above-mentioned findings indicate that thegut microbiota is a key intermediary factor. Therefore,the specific similarities and differences in the impact onPage 2 of 14the gut microbiota between these two dietary regimenswith similar health effects need to be further studied.The gut microbiota responds rapidly to dietarychanges. In both rodents and humans, modifying the intake of dietary macronutrients significantly altered thegut microbiome within a single day [26–28]. Our previous research found that the gut microbiota of mice became markedly different from that of the mice in thenormal chow group after only 2 days of reduced calorieintake [17]. In the case of the IF regimen, the metabolism of the host is different in the fasting and refeedingstages. Ketogenesis occurs during the fasting period,while glucose level rises after eating resumes, and thus,the energy supply shifts from ketones to glucose [7].However, there have been a very limited number ofstudies that have focused on differences in gut microbiota between fasting days and refeeding days in thecycle of IF [23, 25, 29].To compare the health improvement effects of CR andIF and their effects on the gut microbiota and to identifythe specific members in the microbial community thatrespond to these dietary interventions, we designed experiments in which mice were subjected to the CR or IFregimen with normal chow or a high-fat diet. In humans,the three most widely studied intermittent-fasting regimens are alternate-day fasting, 5:2 intermittent fasting,and daily time-restricted feeding [6, 7]. We then usedthe classic 5:2 IF regimen, which refers to 2-day fastingfollowed by 5-day free feeding [30]. Because previousstudies have shown that mice consume too much foodduring the refeeding days in IF, an additional IF control(IFCtrl) group was established to further control the caloric intake in our study. The total energy intake of theIFCtrl group was not different from that of the CR group.We showed that among mice given normal chow, theIFCtrl regimen exerted similar positive effects on glucoseand lipid metabolism as the CR regimen, but the IF regimen had almost no influence compared with the outcomes observed in the ad libitum group. However, whenthe mice were fed a high-fat diet, IF also resulted in improvements, but these improvements were less markedthan those observed in the CR and IFCtrl groups.Moreover, CR created a stable and unique gut microbial community in the mice fed the normal chow andthose fed the high-fat diet, whereas the gut microbiota shaped by IF exhibited dynamic changes duringthe fasting-refeeding cycles. At the end of each cycle,the gut microbiota of the IFCtrl mice was similar tothat of the CR mice, and the gut microbiota of the IFmice was similar to that of the ad libitum group. Wealso identified the members of the gut microbiotathat respond to the various dietary regimens, whichmight be associated with the observed improvementsin metabolic phenotypes.
Zhang et al. BMC Biology(2021) 19:51Page 3 of 14ResultsThe effect of the three dietary regimens on thephysiology and metabolism of normal chow-fed miceTo investigate the effect of the three dietary regimens onphysiology and metabolism in normal chow-fed mice, 8week-old male C57BL/6 J mice were randomly assignedto four groups: (1) the control group (NC AL) receiveda normal chow diet ad libitum, (2) the calorie-restrictedgroup (NC CR) was fed 70% of the ad libitum intakeevery day, (3) the group subjected to the IF regimen(NC IF) had a 2-day (days 1–2) fasting period followedby a 5-day (days 3–7) ad libitum feeding period weekly,and (4) the group subjected to the IFCtrl regimen (NC IFCtrl) had a 2-day fasting period followed by a 5-daydaily feeding period in which they consumed the NC AL daily intake amount (normal amounts of food)weekly to prevent overeating on refeeding days(Additional file 1).On average, in the 11-week trial, compared with theNC AL group, NC IF mice consumed dramaticallymore energy in the first 4 days after refeeding (days 3–6)and ate slightly less on the last refeeding day (day 7;Fig. 1a, b). In all eleven fasting-refeeding cycles, the totalenergy consumption in NC IF mice was 92.7% of thatin the NC AL group, and the total energy intakes ofthe NC CR group and NC IFCtrl group were approximately equivalent, which were approximately 75% of thatin NC AL mice (Fig. 1c). Compared to their ad libitumcounterparts, the NC CR and NC IFCtrl mice hadsignificantly lower body weights (Fig. 1d and Additional file 2), decreases in the weight of epididymalwhite adipose tissue (EpiWAT) and the mean size oflipid droplets in EpiWAT, and lower serum cholesterollevels (Fig. 2a–e and Additional file 3, 4). However, therewas no significant difference in body weight, adipose tissue, or serum cholesterol between the NC IF and NC abcdFig. 1 Energy intake and body weight in NC-fed mice. a Daily energy intake of NC-fed groups. W, week. b Average energy intake of the NC IFgroup during the 11-week intervention compared with that of the NC AL group. c Cumulative energy intake and d body weights of NC-fedgroups after 11 weeks of intervention on day 7 of week 11. Data are presented as the mean S.E.M. For each group, n 6–7. Data were analyzedusing the unpaired t test (two-tailed) in b and c. Data were analyzed using one-way ANOVA followed by Tukey post hoc test in d. *P 0.05,**P 0.01, ***P 0.001, ****P 0.0001
Zhang et al. BMC Biology(2021) 19:51abcdefhiPage 4 of 14gjkFig. 2 Metabolic parameters of NC-fed mice. a Epididymal fat mass as a percentage of body weight in NC-fed mice. b Mean lipid droplet area ofadipocytes and representative HE-stained histological sections of EpiWAT. c Inguinal fat mass as a percentage of body weight in NC-fed mice. dMean lipid droplet area of adipocytes and representative HE-stained histological sections of IngWAT. e Serum cholesterol level. f Serumadiponectin level. g Serum leptin level. h Fasting blood glucose. i Areas under the curve (AUC) of serum glucose in the oral glucose tolerancetest (OGTT). j Fasting serum insulin. k AUC of serum insulin in the OGTT. Mice were tested after 11 weeks of intervention on day 7 of week 11.Data are presented as the mean S.E.M. For each group, n 6–7. Data were analyzed using one-way ANOVA followed by Tukey’s post hoc test.*P 0.05, **P 0.01, ***P 0.001, ****P 0.0001AL mice. Furthermore, NC CR and NC IFCtrl micehad significantly reduced fasting blood glucose levelsand enhanced glucose tolerance, while the NC IFgroup had similar levels of these parameters as the NC AL mice (Fig. 2h–i and Additional file 5). Unlike theabove parameters, the level of serum adiponectin wassignificantly increased in all the mice from the NC CR,NC IF, and NC IFCtrl groups compared to the ad libitum control group (Fig. 2f). None of the three dietary interventions based on normal chow affected serum leptinor insulin secretion (Fig. 2g, j and k and Additionalfile 5). In previous studies, glucose and lipid metabolismin mice with 30% caloric restriction of normal chow wassignificantly improved compared to that in their adlibitum counterparts [17, 19, 31]. Here, we showed thatthe NC IFCtrl regimen had similar positive effects onglucose and lipid metabolism as NC CR, but the NC IF regimen only significantly increased the level of serumadiponectin and enhanced glucose tolerance comparedto the outcomes observed in the ad libitum group.Dynamic changes in the gut microbiota during thefasting-refeeding cycleTo determine how the gut microbiota was modulated bythese three interventions, fecal samples were collectedfrom all the mice at day 7 of week 9 and day 2, day 3,day 7 of week 10, and the gut microbiota was analyzedthrough 16S rRNA gene V3-V4 region sequencing.
Zhang et al. BMC Biology(2021) 19:51Principal coordinate analysis (PCoA) based on BrayCurtis distance showed changes in the overall structureof the gut microbiota during the week (Fig. 3a). The gutmicrobiota in the NC AL or NC CR group was relatively stable during the week, and the gut microbiota ofthe CR group diverged significantly from that of the ALgroup mainly along the axis of the first principal component (PC1) (P 0.01, permutational multivariate analysisof variance (PerMANOVA) test with 9999 permutations,Additional file 6). At day 7 of week 9 (the beginning ofthe fasting-refeeding cycle), the structure of the gutmicrobiota in the NC IF group was very similar to thatin the NC AL group, while that in the NC IFCtrlgroup was close to that in the NC CR group. Notably,fasting had a dramatic influence on the gut microbiotain both the NC IF and NC IFCtrl groups. The gutmicrobiota was not significantly different between thesetwo groups after two days of fasting (day 2) and wasmuch closer to that of the NC AL group along the axisof PC1 (Fig. 3a and Additional file 6, 7). After 1 day ofrefeeding (day 3), the gut microbiota greatly changed inthese two groups and was similar to that in the NC CRgroup. After a 5-day refeeding period (day 7), the gutmicrobiota in the NC IF and NC IFCtrl groups changed back to that observed at day 7 of the last week.Based on the PCoA and PerMANOVA test, the gutmicrobiota of the NC-fed mice could be separated into 4clusters: (1) the “AL cluster” included all time points ofthe NC AL group and day 7 for the two consecutiveweeks of the NC IF group; (2) the “CR cluster” included all time points of the NC CR group and day 7for the two consecutive weeks of the NC IFCtrl group;(3) the “Fasting cluster” included day 2 of the NC IFand NC IFCtrl groups; (4) the “Refeeding cluster” included day 3 of the NC IF and NC IFCtrl groups,which was confirmed by the Sparse Partial Least SquaresDiscriminant Analysis (sPLS-DA) model (classificationerror rate is 0.02, Fig. 3b and Additional file 8). Forty-sixoperational taxonomic units (OTUs) were identified asfeatures that discriminated the samples among 4 clustersin the sPLS-DA model (Fig. 3c, Additional file 9). Then,we constructed a coabundance network of these 46 keyOTUs based on the Spearman correlation coefficientsacross all groups and time points and clustered theminto seven coabundance groups (CAGs) (Fig. 3c–e).Compared to the NC AL group, CAG5 was significantly enriched and CAG3, CAG4, CAG6, and CAG7were significantly reduced in NC CR mice (Fig. 3c, e,Additional file 10). OTU2 in the genus Lactobacillus wasthe predominant phylotype in CAG5 and showed astrongly negative correlation with the four CAGs thatdecreased in the CR mice (Fig. 3c–e). Most of the OTUsin CAG3 and CAG4 were in Muribaculaceae andbelonged to Bacteroidetes, while most of the OTUs inPage 5 of 14CAG6 and CAG7 were in Ruminococcaceae and Lachnospiraceae from Firmicutes. These OTU-level alterations induced by CR are consistent with the findings ofprevious studies [17, 19]. On day 7 of the last week, thecharacteristics of these bacteria in NC IF mice weresimilar to NC AL mice, while those in NC IFCtrl micewere similar to the NC CR group (Fig. 3c, e). The 2day fasting changed all of the CAGs in both the NC IFand NC IFCtrl groups, including an increase in CAG1,CAG2, CAG4, and CAG7 and a decrease in CAG3,CAG5, and CAG6 (Fig. 3c, e). In these two fastinggroups, CAG2 mainly contained Bacteroides OTU3,CAG4 was mainly constructed by Alloprevotella OTU11,and Muribaculacea OTU16 became the most abundantbacterial group, while CAG5, containing LactobacillusOTU2, was dramatically reduced to a level significantlylower than that in NC AL mice. After 1 day of refeeding, most of the seven CAGs decreased, but CAG5 significantly increased in the NC IF and NC IFCtrlgroups, even reaching a similar level as that in the NC CR group (Fig. 3c, e). After a 5-day refeeding period(day 7), the relative abundance of all the CAGs in theNC IF and NC IFCtrl groups changed back to that atday 7 of the last week (Fig. 3c, e).Considered together, our results showed alterations inthe structure and components of the gut microbiota induced by three dietary interventions, suggesting that thegut microbiota in NC IF and NC IFCtrl mice exhibiteddynamic cyclical changes. Moreover, at the end of thefasting-refeeding cycle (also the beginning of the nextcycle), the characteristics of the gut microbiota was justin parallel with the similar positive effects of NC CRand NC IFCtrl but the rare effect of NC IF on healthimproving.The effect of three dietary regimens on physiology andmetabolism in mice fed a high-fat dietTo evaluate the effect of various eating regimens on theintake of different dietary components, we performedthe same dietary treatments in mice fed a high-fat diet(60% energy from fat). Eight-week-old male C57BL/6 Jmice were then subjected to one of four eating regimens(HF AL, HF CR, HF IF or HF IFCtrl) for 11 weeks.The change in food consumption and energy intake inHF CR, HF IF or HF IFCtrl mice on each day of 1week fasting-refeeding cycle was similar to that in micewith normal chow compared to their respective ad libitum groups (Fig. 4). Remarkably, the reduction in totalcalorie intake in HF IF mice was approximately 17.5%,which was more than twice that in NC IF mice. At theend of the trial, the body weight of three interventiongroups was significantly lower than that in the HF ALgroup, while those in the HF CR and HF IFCtrl groupswere also significantly lower than that in the HF IF
Zhang et al. BMC Biology(2021) 19:51Page 6 of 14Fig. 3 The gut microbiota structural alterations associated with the three dietary intervention regimens in NC-fed mice. a Principal coordinateanalysis (PCoA) based on the Bray-Curtis distances. b Microbiota responding to different interventions based on the sPLS-DA model. All samplesfrom the NC-fed mice at four time points of week 10 were included for discrimination. c Heat map of the 46 OTU-level phylotypes identified askey variables for differentiation among the 4 clusters in the gut microbiota of NC-fed mice by sPLS-DA. The color of the spots represents therelative abundance (normalized and log2-transformed) of the OTU in each sample. The OTUs were organized by Spearman’s correlation analysisbased on their relative abundances (left side of heat map). OTU ID numbers and the taxa of the OTUs are shown along the right side of the heatmap. d Coabundance network illustrating the interactions among the 46 key OTUs responding to three dietary intervention regimens in the NCfed mice. The OTUs were clustered into 7 coabundance groups (CAGs) by PerMANOVA when P was 0.01. Different colors and shapes of nodesrepresent different CAGs and phyla, respectively. The lines between two nodes represent the correlations between the nodes they connect, withthe color saturation and line width indicating the correlation magnitude: red represents a positive correlation, and blue represents a negativecorrelation. Only lines corresponding to correlations with a magnitude greater than 0.4 were drawn. e Heat map of the relative abundance ofeach CAG on day 7 of week 9 and day 2, day 3, and day 7 of week 10. The color of the spots represents the total relative abundance (normalizedand log2-transformed) of all OTUs in each CAG from each group of NC-fed mice. In all graphs, for each group and each time point, n 6–7. W,week; D, day
Zhang et al. BMC Biology(2021) 19:51Page 7 of 14abcdFig. 4 Energy intake and body weight in HF-fed mice. a Daily energy intake of HF-fed groups. W, week. b Average energy intake of the HF IFgroup during the 11-week intervention compared with that of the HF AL group. c Cumulative energy intake and d body weight of the HF-fedgroups after 11 weeks of intervention on day 7 of week 11. Data are presented as the mean S.E.M. For each group, n 6–7. Data were analyzedusing the unpaired t test (two-tailed) in b and c. Data were analyzed using one-way ANOVA followed by Tukey post hoc test in d. *P 0.05,**P 0.01, ***P 0.001, ****P 0.0001group (Fig. 4d and Additional file 11). Moreover, allthree dietary interventions also attenuated the excessiveaccumulation of white adipose tissue and the disruptionof glucose and lipid metabolism caused by HF feeding,while the effect of HF IF was less notable than those ofthe HF CR and HF IFCtrl conditions (Fig. 5 and Additional file 12, 13).Three intervention regimens with a high-fat diet alteredthe gut microbiotaThe overall structure of the gut microbiota of HF-fedmice at day 7 in week 9 and day 2, day 3, and day 7 inweek 10 was also profiled. The PCoA score plot of theBray-Curtis distance based on OTU data showed thatthe overall structures of the gut microbiota in the HF AL and HF CR groups were relatively stable and thatthe gut microbiota in the HF CR group wassignificantly different from that in the HF AL group(Fig. 6a and Additional file 14). Moreover, the gutmicrobiota in HF IF and HF IFCtrl mice exhibited dynamic cyclical changes, but the trajectory was differentfrom that in NC IF and NC IFCtrl mice. The gutmicrobiota of the HF IF and HF IFCtrl groups at day7 of week 9 was very similar to that of the HF CRgroup and then dramatically changed in the same direction during fasting (day 2). After refeeding, their gutmicrobiota gradually shifted back to that at day 7 of thelast week. The gut microbiota of HF IF and HF IFCtrlmice at all time points was more similar to that of HF CR mice than that of HF AL mice (Additional file 15).Then, we also used sPLS-DA models to identify thefeatures of the gut microbiota in HF AL and HF CRmice or HF IF and HF IFCtrl mice on fasting days(classification error rate is 0.01, Fig. 6b and
Zhang et al. BMC Biology(2021) 19:51Page 8 of 14abcdefghijkFig. 5 Metabolic parameters of HF-fed mice. a Epididymal fat mass as a percentage of body weight in HF-fed mice. b Mean lipid droplet area ofadipocytes and representative HE-stained histological sections of EpiWAT. c Inguinal fat mass as a percentage of body weight in HF-fed mice. dMean lipid droplet area of adipocytes and representative HE-stained histological sections of IngWAT. e Serum cholesterol level. f Serumadiponectin level. g Serum leptin level. h Fasting blood glucose. i Areas under the curve (AUC) of serum glucose in the oral glucose tolerancetest (OGTT). j Fasting serum insulin. k AUC of serum insulin in the OGTT. Mice were tested after 11 weeks of intervention on day 7 of week 11.Data are presented as the mean S.E.M. For each group, n 6–7. Data were analyzed using one-way ANOVA followed by Tukey’s post hoc test.*P 0.05, **P 0.01, ***P 0.001, ****P 0.0001Additional file 16), and 42 OTUs were identified as features of the sPLS-DA model (Fig. 6c, Additional file 17).We next constructed a coabundance network of these42 key OTUs based on the Spearman correlation coefficients across all groups and time points and clusteredthem into six coabundance groups (CAGs) (Fig. 6c–e).Compared with the HF AL group, the HF CRgroup exhibited a decreased abundance of CAG1 andCAG2 and an increased abundance of CAG3, CAG5,and CAG6 (Fig. 6e, Additional file 18). In the fastingperiod, the abundance of CAG1, CAG2, and CAG3 significantly decreased in the HF IF and HF IFCtrlgroups, while CAG4, CAG5, and CAG6 increased. Notably, compared to the gut microbiota in mice fed withnormal chow, the OTUs in CAG1 and CAG2 weresignificantly promoted by a high-fat diet, and treatmentwith CR, IF, or IFCtrl could decrease these bacteria.Moreover, consistent with its behavior in mice fed withnormal chow, the Lactobacillus OTU2 (belonging toCAG3) was the predominant bacterium in the HF CR,HF IF, and HF IFCtrl groups but was almost eradicated after fasting. The most abundant OTUs in CAG5were Bacteroides OTU3, Alloprevotella OTU11, andMuribaculacea OTU16, which were the main membersof CAG2 and CAG4 in mice fed with normal chow. Although this CAG in high-fat-fed mice was significantlyenriched by fasting, refeeding with a high-fat diet didnot reduce its abundance rapidly, indicating that thechange tendency of this CAG was different betweenmice fed with high-fat and normal chow diets.
Zhang et al. BMC Biology(2021) 19:51Page 9 of 14Fig. 6 The structure of the gut microbiota altered by the three dietary intervention regimens in HF-fed mice. a PCoA based on the Bray-Curtisdistances. b Microbiota responding to different interventions based on the sPLS-DA model. Samples from the HF AL and HF CR groups at fourtime points and the HF IF and HF IFCtrl groups at day 2 of week 10 were included for discrimination. c Heat map of the 42 OTU-levelphylotypes identified as key variables for differentiation among the 3 clusters in the gut microbiota of HF-fed mice by sPLS-DA. The color of thespots represents the relative abundance (normalized and log2-transformed) of the OTU in each sample. The OTUs were organized by Spearman’scorrelation analysis based on their relative abundances (left side of heat map). OTU ID numbers and the taxa of the OTUs are shown along theright side of the heat map. d Coabundance network illustrating the interactions among the 42 key OTUs responding to three dietary interventionregimens in the HF-fed mice. The OTUs were clustered into 6 CAGs by PerMANOVA when P was 0.01. Different colors and shapes of nodesrepresent different CAGs and phyla, respectively. The lines between two nodes represent the correlations between the nodes they connected,with the color saturation and line width indicating the correlation magnitude: red represents a positive correlation, and blue represents anegative correlation. Only lines corresponding to correlations with a magnitude greater than 0.4 were drawn. e Heat map of the relativeabundance of each CAG on day 7 of week 9 and day 2, day 3, and day 7 of week 10. The color of the spots represents the total relativeabundance (normalized and log2-transformed) of all OTUs in each CAG from each group of HF-fed mice. In all graphs, for each group at eachtime point, n 6–7. W, week; D, day
Zhang et al. BMC Biology(2021) 19:51Overall, these results indicated distinct changes in thegut microbiota in HF-fed mice in response to our threetypes of interventions. For HF CR mice, calorie restriction created a stable and unique gut microbial community. For HF IF and HF IFCtrl mice, their gutmicrobiota had a similar trajectory that changes with thefasting-refeeding cycle.DiscussionIn the current study, we showed that CR and IFCtrl hadsimilar positive effects on glucose and lipid metabolism inmice fed normal chow, but compared to the ad libitumgroup, the IF group only exhibited improvements in bloodglucose contr
include daily time-restricted feeding, alternate-day fast-ing and 5:2 intermittent fasting (fasting for 2days each week) [5–10]. Based on a meta-analysis of previous stud-ies, IF exerts metabolic effects similar to those of CR, such as improving glucose metabolism by lowering insu-