Transcription
AN INTRODUCTION FOR HEALTH AND SOCIAL SCIENCEThis accessible book is essential reading for those looking for a short andsimple guide to basic data analysis. Written for the complete beginner, the bookis the ideal companion when undertaking quantitative data analysis for the firsttime using SPSS.The book uses a simple example of quantitative data analysis that would betypical to the health field to take you through the process of data analysis stepby step. The example used is a doctor who conducts a questionnaire survey of30 patients to assess a specific service. The data from these questionnaires isgiven to you for analysis, and the book leads you through the process requiredto analyse this data.Handy screenshots illustrate each step of the process so you can try out theanalysis for yourself, and apply it to your own research with ease.Topics covered include:Questionnaires and how to analyse themCoding the data for SPSS, setting up an SPSS database and entering the dataDescriptive statistics and illustrating the data using graphsCross-tabulation and the Chi-square statisticCorrelation: examining relationships between interval dataExamining differences between two sets of scoresReporting the results and presenting the dataQuantitative Data Analysis Using SPSS is the ideal text for any students inhealth and social sciences with little or no experience of quantitative dataanalysis and statistics.Pete Greasley is a lecturer at the School of Health Studies,University of Bradford, UK.Cover design: Mike StonesQUANTITATIVE DATA ANALYSIS USING SPSS GreasleyQUANTITATIVE DATAANALYSIS USING SPSSQUANTITATIVE DATAANALYSIS USING SPSSAN INTRODUCTIONFOR HEALTH AND SOCIAL SCIENCEPete Greasley
Quantitative Data AnalysisUsing SPSS
Quantitative DataAnalysis Using SPSSAn Introduction for Health &Social SciencePete Greasley
Open University PressMcGraw-Hill EducationMcGraw-Hill HouseShoppenhangers RoadMaidenheadBerkshireEnglandSL6 2QLemail: enquiries@openup.co.ukworld wide web: www.openup.co.ukand Two Penn Plaza, New York, NY 10121-2289, USAFirst published 2008Copyright Pete Greasley 2008All rights reserved. Except for the quotation of short passages for the purpose ofcriticism and review, no part of this publication may be reproduced, stored in aretrieval system, or transmitted, in any form or by any means, electronic,mechanical, photocopying, recording or otherwise, without the prior writtenpermission of the publisher or a licence from the Copyright Licensing AgencyLimited. Details of such licences (for reprographic reproduction) may be obtainedfrom the Copyright Licensing Agency Ltd of Saffron House, 6–10 Kirby Street,London EC1N 8TS.A catalogue record of this book is available from the British LibraryISBN-10: 0 335 22305 2 (pb) 0 335 22306 0 (hb)ISBN-13: 978 0335 22305 3 (pb) 978 0335 22306 0 (hb)Library of Congress Cataloging-in-Publication DataCIP data applied forTypeset by RefineCatch Limited, Bungay, SuffolkPrinted in the UK by Bell and Bain Ltd, Glasgow
ContentsIntroduction1 A questionnaire and what to do with it: types of data andrelevant analyses1.1 The questionnaire1.2 What types of analyses can we perform on this questionnaire?1.2.1 Descriptive statistics1.2.2 Relationships and differences in the data1.3 Summary1.4 Exercises1.5 Notes2 Coding the data for SPSS, setting up an SPSS database andentering the data2.1 The dataset2.2 Coding the data for SPSS2.3 Setting up an SPSS database2.3.1 Defining the variables2.3.2 Adding value labels2.4 Entering the data2.5 Exercises2.6 Notes3 Descriptive statistics: frequencies, measures of centraltendency and illustrating the data using graphs3.1 Frequencies3.2 Measures of central tendency for interval variables3.3 Using graphs to visually illustrate the data3.3.1 Bar charts3.3.2 Histograms3.3.3 Editing a chart3.3.4 Boxplots3.3.5 Copying charts and tables into a Microsoft Worddocument3.3.6 Navigating the Output Viewer3.4 Summary3.5 Ending the SPSS session3.6 Exercises3.7 Notes4 Cross-tabulation and the chi-square statistic4.1 Introduction4.2 Cross-tabulating data in the questionnaire4.3 The chi-square statistical 052565758586061616163
viQuantitative Data Analysis Using SPSS4.44.54.64.74.8Levels of statistical significanceRe-coding interval variables into categorical variablesSummaryExercisesNotes67697373755 Correlation: examining relationships between interval data7777777880828384855.1 Introduction5.2 Examining correlations in the questionnaire5.2.1 Producing a scatterplot in SPSS5.2.2 The strength of a correlation5.2.3 The coefficient of determination5.3 Summary5.4 Exercises5.5 Notes6 Examining differences between two sets of scores6.1 Introduction6.2 Comparing satisfaction ratings for the two counsellors6.2.1 Independent or related samples?6.2.2 Parametric or non-parametric test?6.3 Comparing the number of sessions for each counsellor6.4 Summary6.5 Exercises6.6 Notes7 Reporting the results and presenting the data8686888888951001011027.1 Introduction7.2 Structuring the report7.3 How not to present data103103103107Concluding remarksAnswers to the quiz and exercisesGlossaryReferencesIndex109110130133135
IntroductionI remember reading somewhere that for every mathematical formula, includedin a book, the sales would be reduced by half. So guess what, there are noformulas, equations or mathematical calculations in this book. This is apractical introduction to quantitative data analysis using the most widelyavailable statistical software – SPSS (Statistical Package for the Social Sciences).The aim is to get students and professionals past that first hurdle of dealingwith quantitative data analysis and statistics.The book is based upon a simple scenario: a local doctor has conducted a briefpatient satisfaction questionnaire about the counselling service offered at hishealth centre. The doctor, having no knowledge of quantitative data analysis,sends the data from 30 questionnaires to you, the researcher, for analysis.The book begins by exploring the types of data that are produced from thisquestionnaire and the types of analysis that may be conducted on the data.The subsequent chapters explain how to enter the data into SPSS and conductthe various types of analyses in a very simple step-by-step format, just as aresearcher might proceed in practice.Each of the chapters should take about an hour to complete the analysis andexercises. So, in principle, the basic essentials of quantitative data analysisand SPSS may be mastered in a matter of just six hours of independent study.The chapters are listed below with a brief synopsis of their content. Chapter 1 A questionnaire and what to do with it: types of data and relevantanalyses. The aim of this chapter is to familiarize yourself with thequestionnaire and the types of analyses that may be conducted on thedata. Chapter 2 Coding the data for SPSS, setting up an SPSS database and enteringdata. In this chapter you will learn how to code the data for SPSS, set up anSPSS database and enter the data from 30 questionnaires. Chapter 3 Descriptive statistics: frequencies, measures of central tendency andvisually illustrating data using graphs. In this chapter you will use SPSS toproduce some basic descriptive statistics from the data: frequencies for categorical data and measures of central tendency (the mean, median andmode) for interval level data. You will also learn how to produce and editcharts to illustrate the data analysis, and to copy your work into a MicrosoftWord file. Chapter 4 Cross-tabulation and the chi-square statistic. In this chapter youwill learn about cross-tabulation for categorical data, a statistical test (chisquare) to examine associations between variables, and the concept of statistical significance. You will also learn how to re-code interval data intocategories. Chapter 5 Correlation: examining relationships between interval data. In this
2Quantitative Data Analysis Using SPSSchapter you will learn about scatterplots and correlation to examine thedirection and strength of relationships between variables. Chapter 6 Examining differences between two sets of scores. In this chapteryou will learn about tests which tell us if there is a statistically significantdifference between two sets of scores. In so doing you will learn aboutindependent and dependent variables, parametric and non-parametricdata, and independent and related samples.There is also a final concluding chapter which provides advice on how tostructure the report of a quantitative study and how not to present data.The approachQuantitative data analysis and statistics is often a frightening hurdle for manystudents in the health and social sciences, so my primary concern has beento make the book as simple and accessible as possible. This quest for simplicitystarts with the fact that the student has only one dataset to familiarizethemselves with – and that dataset itself is very simple: a patient satisfactionquestionnaire consisting of just five questions.The questionnaire is, however, designed to yield a range of statistical analysesand should hopefully illustrate the potentially complex levels of analyses thatcan arise from just a few questions. This will also act as a warning to studentswho embark upon research projects involving complex designs without fullyappreciating how they will actually analyse the data. My advice to studentswho are new to research is always to ‘keep it simple’ and, where possible, todesign the study according to the statistics they understand.I have taken a pragmatic approach to quantitative data analysis which meansthat I have focused on the practicalities of doing the analyses rather thanruminating on the theoretical underpinnings of statistical principles. Andsince actually doing the analyses requires knowledge of appropriate statisticalsoftware, I have chosen to illustrate this using the most widely availableand comprehensive statistical package in universities: SPSS. Thus, by the endof this book you should not only be able to select the appropriate statisticaltest for the data, you should also be able to conduct the analysis and producethe results using SPSS.The scope of the bookI have set a distinct limit to the level of analysis which I think is appropriatefor an introductory text. This limit is the analyses of two variables – known asbi-variate analyses. In my experience of teaching health and social sciencestudents, most of whom are new to quantitative data analysis and statistics,this is sufficient for an introduction.Also, I did not want to scare people off with a more imposing tome coveringthings like logistic regression and factorial ANOVA. There are many other bookswhich include these more advanced statistics, some of which are listed in thereferences. This book is designed to get people started with quantitative data
Introduction3analysis using SPSS; as such it may provide a platform for readers to consultthese texts with more confidence.The audience: health and social sciencesAs an introduction to quantitative data analysis, this book should be relevantto undergraduates, postgraduates or diploma level students undertaking afirst course in quantitative research methods. I have used these materials toteach students from a variety of backgrounds including health, social sciencesand management.It may be particularly relevant for students and professionals in health andsocial care, partly due to the subject matter (a patient satisfaction questionnaire about counselling) and the examples used throughout the text, butalso due to the design of the materials. Many students and professionals inhealth and social care are studying part-time or by distance learning, or perhaps undertaking short courses in research methods. This means that theiropportunities for attendance are often limited and courses need to be designedto cater for this mode of study, for example, attendance for one or two days at atime.It is with these students in mind that these materials should also be suitablefor independent study. After the introductory chapter outlining the types ofdata and analyses, the book continues with step-by-step instructions for conducting the analysis using SPSS. Furthermore, the practical approach shouldsuit professionals who may wish to develop their own proposals and conducttheir own research but have limited time to delve into the theoretical details ofstatistical principles.In health studies the emphasis on evidence-based practice has reinforcedthe need for professionals to not only understand and critically appraise theresearch evidence but also to conduct research in their own areas of practice.This book should provide professionals with a basic knowledge of theprinciples of quantitative research along with the means to actually design andconduct the analysis of data using SPSS.For lecturersThis book is an organized course divided into six chapters/sessions whichmay be delivered as a combination of lectures and practical sessions on SPSS.I have delivered this course in three ways:1 First, as a series of five weekly lectures and practical sessions (two–threehours) for the first half of a postgraduate module on quantitative andqualitative data analysis.The first session primarily consists of a lecture introducing the questionnaire, the dataset and relevant analyses (Chapter 1) before moving on toenter the data (Chapter 2). Thereafter, each of the remaining four sessionsconsists of an introductory lecture discussing the analysis in subsequentchapters (descriptive statistics and graphs, cross-tabulation and chi-square,
4Quantitative Data Analysis Using SPSScorrelation, examining differences in two sets of scores) before movingonto SPSS to conduct the analyses and exercises in each chapter. In the finalsession I also include discussion of writing up the results and reportingmore generally (Chapter 7).For a full module of 10–11 sessions this book could either be supplemented by additional materials covering more advanced analyses (e.g.,ANOVA and regression analysis) or students could design (and conduct)their own study (in groups) based upon the analyses covered in the book.2 A one/two day course for a postgraduate module on Research Methods. Thisstarts with formal lecture introducing the questionnaire, the dataset andrelevant analyses (Chapter 1), and then students (in pairs) work throughthe materials at their own pace, continuing with independent study. Thepractical sessions may be interspersed with brief lectures reviewing thetypes of analyses.3 A half-day workshop on SPSS. Again, this begins with a brief introductionto the questionnaire, the dataset and types of analyses, with guided instruction on specific exercises from each of the chapters. Though it has to be saidthat a half day is not really sufficient time to cover the materials (in myview, and according to the student evaluations!) This is especially the casefor students with little prior knowledge of statistics.Where an assignment has been set for the course, students have been askedto produce a report for the doctor who requested the analysis. This requiresstudents to write a structured report in which the ‘most relevant analyses’ arepresented along with some discussion of the results, critical reflections on thesurvey and recommendations for further research.Getting a copy of SPSSSPSS, as noted above, is the most widely used software for the statisticalanalysis of quantitative data. It is available for use at most universities wherestaff and students can usually purchase their own copy on cd for 10– 20. Thelicence, which expires at the end of each year, can be renewed by contactingthe supplier at the university who will provide the necessary ‘authorization’code.AcknowledgementsThanks to all the students who have endured evolving versions of this text, tothe publishing people for coping with the numerous figures and screenshots,and to Wendy Calvert (proof-reader extraordinaire).
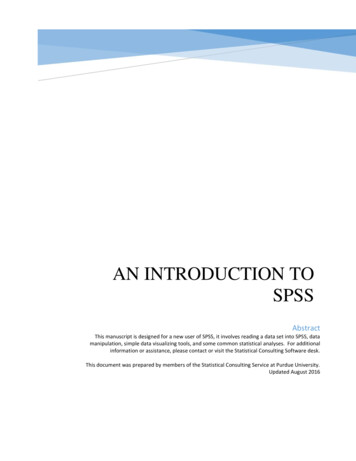
1A questionnaire and what todo with it: types of data andrelevant analysesThe aim of this chapter is to familiarize yourself with the questionnaireand the types of analyses that may be conducted on the data before we goonto SPSS. By the end of the chapter you should be familiar with: types of dataand levels of measurement; frequencies and cross-tabulation; measures ofcentral tendency; normal and skewed distributions of data; correlation andscatterplots; independent and dependent variables.1.1 The questionnaireA local general practice (family practice or health centre for those outside theUK) has been offering a counselling service to patients for over a year now. Thedoctor at the practice refers patients to a counsellor if they are suffering frommild to moderate mental health issues, like anxiety or depression.1The doctor decided that he wanted to evaluate the service by gathering someinformation about the patients referred for counselling and their satisfactionwith the service. So, he designed a brief questionnaire and sent it to everypatient who attended for counselling over the year. The doctor had referred30 patients to the service and was delighted to find that all 30 returned thequestionnaire.But then he realized he had a bit of a problem – he did not know how to analysethe data! That is when he thought of you. So, with a polite accompanying letterappealing for help, he sends you the 30 completed questionnaires for analysis.A copy of the questionnaire is provided in Figure 1.1.The first thing you notice is that he has collected some basic demographic dataabout the gender and age of the patients. Then you see that he has askedwhether they saw the male or female counsellor – that might be interesting interms of satisfaction ratings: perhaps one received higher ratings than theother? He has also collected information about the number of counsellingsessions conducted for each patient because, he tells you in the letter, the counsellors are supposed to offer ‘brief therapy’ averaging six sessions. Are they bothabiding by this? Finally, you see that patients were asked to rate their satisfaction with the service on a seven point scale. Will the ratings depend on the sexor age of the patient? Perhaps they would be related to the number of counselling sessions or, as noted above, which particular counsellor the patient saw.Well, you think, that is not too bad – at least it is simple. But what sorts ofanalysis can you do on this questionnaire? (See Box 1.1 for a brief discussionof some questionnaire design issues.)
6Quantitative Data Analysis Using SPSSFigure 1.1 Counselling service: patient satisfaction questionnaireBox 1.1 Questionnaires: some design issuesWhile this is not the place for a full discussion of questionnaire design issues, there aresome cardinal rules that should be briefly noted.First, make sure the questions are clear, brief and unambiguous. In particular avoid‘double questions’, for example: ‘Was the room in which the counselling took placequiet and comfortable? Well, it was comfortable but there was a lot of noise from thenext room . . .’Second, make sure that the questionnaire is easy to complete by using ‘closedquestions’ with check boxes providing the relevant options that respondents can simplytick. So, you should avoid questions like: ‘Q79: Please list all the times you felt anxious,where you were, who you were with, and what you’d had to eat the night before’.The more you think through the options before, the less work there will be later whenit comes round to analysing the data. As Robson (2002: 245) points out: ‘The desire touse open-ended questions appears to be almost universal in novice survey researchers,but is usually extinguished with experience . . .’ Piloting the questionnaire, which isimportant to check how respondents may interpret the questions, can also providesuggestions for closed alternatives.There are some occasions, however, when ‘open questions’ are necessary to provideuseful information. For example, the question about level of satisfaction with theservice may have benefited from a comments box to allow patients to expand on issuesrelating to satisfaction. An alternative strategy may have been to use more scales tomeasure different dimensions of satisfaction (for example, relating to the counsellor, theroom in which counselling was conducted, the referral procedure, etc.)Another issue is the design of the scale used to measure satisfaction. The doctor mighthave used a more typical Likert-type format where the respondent indicates the extentto which they agree or disagree with a statement:
A questionnaire and what to do with it7I was satisfied with the nglyagree䊐䊐䊐䊐䊐Notice that there are only five options here (and they are labelled). The format you usewill depend on the context and the level of sensitivity you require, which may result in aseven or nine point scale. Also notice that whatever the length of the scale, there is anoption for a ‘neutral’ or ‘undecided’ response.In the counselling questionnaire you may also notice that the question asking for theage of patients may have provided a list of age groupings, for example, 20–9, 30–9.Although categories can make the questionnaire easier to complete, and moreanonymous (some people may not like to specify their age because it may help toidentify them), my advice would be to gather the precise ages where possible becauseyou can convert them into any categories you want later; the same principle applies tonumber of counselling sessions.A full discussion of questionnaire design issues would require a chapter unto itself.For further reading Robson (2002) provides a relatively succinct chapter with guidanceon design and other issues.1.2 What types of analyses can we perform on this questionnaire?1.2.1 Descriptive statisticsDescriptive statistics provide summary information about data, for example,the number of patients who are male or female, or the average age of patients.There are three distinct types of data that are important for statistical analysis:Types of data (or levels of measurement)1 Interval or Ratio: This is data which takes the form of a scale in which thenumbers go from low to high in equal intervals. Height and weight areobvious examples. In our data this applies to age, number of counsellingsessions and patient satisfaction ratings.2 Ordinal: This is data that can be put into an ordered sequence. For example,the rank order of runners in a race – 1st, 2nd, 3rd, etc. Notice that this givesno information on how much quicker 1st was than 2nd or 2nd was than3rd. So, in a race, the winner may have completed the course in 20 seconds,the runner-up in 21 seconds, but third place may have taken 30 seconds.Whereas there is only one second difference between 1st and 2nd, there arenine seconds difference between second and third. Do we have any of thistype of data in our sample? No we do not (though see Box 1.2 for furtherdiscussion).3 Categorical or nominal: This is data that represents different categories,rather than a scale. In our data this applies to: sex (male or female) andcounsellor (John or Jane). So, if we were assigning numbers to these categories, as we will be doing, they do not have any order as they would have
8Quantitative Data Analysis Using SPSSin a scale: if we were to code male as 1 and female as 2, this does not implyany order to the numbers – it is just an arbitrary assignment of numbersto categories.Making a distinction between these levels of measurement is importantbecause the type of analysis we can perform on the data from the questionnairedepends on the type of data – as illustrated in Table 1.1.Table 1.1 Type of data and appropriate descriptive statisticsType of dataDescriptive statisticsCategorical data:Interval/ratio data:Frequencies, cross-tabulation.Measures of central tendency: mean, median, mode.We will now examine each of these in turn.Box 1.2 Types of data & levels of measurementWhereas this brief review is really all we need to know for our questionnaire data,there is in fact a lot more to say about types of data and levels of measurement. Forexample, although I have grouped interval and ratio data together, as many textbooksdo (e.g., Bryman and Cramer 2001: 57), there is much debate about the differencesbetween true interval data and that provided in rating scales.In our questionnaire, age and counselling sessions are ratio data because there is a truezero point and we know that someone who is 40 years is twice as old as someone whois 20 years; similarly, we know that 12 counselling sessions is four times as many asthree; we know the ratio of scores. The problem with interval data is that, while theintervals may be equal we cannot be sure that the ratio of scores is equal. For example,if we were measuring anxiety on a scale of 0–100, should we maintain that a personwho scored 80 had twice as much anxiety as a person who scored 40? (Howell1997: 6.)This issue could be raised about our satisfaction ratings: can we really be sure that apatient who circles 6 is twice as satisfied as a person who circles 3, or three times assatisfied as a person who circles 2? It is for this reason that some analysts would treatthis as ordinal data – like the rank order of runners in a race – 1st, 2nd, 3rd, etc.described above. But clearly, our satisfaction rating scale is more than ordinal, and sincethe numerical intervals in the scale are presented as equal (assuming equal intervalsbetween the numbers) we might say they ‘approximate’ interval data.For those who wish to delve further into this debate about whether rating scalesshould be treated as ordinal or interval data see Howell (1997) or the recent articles inMedical Education by Jamieson (2004) and Pell (2005).Descriptive statistics for categorical dataFrequencies. Probably the first thing a researcher would do with the data fromour questionnaire is to ‘run some frequencies’. This simply means that wewould look at the numbers and percentages for our categorical questions,
A questionnaire and what to do with it9which we might hereafter refer to as ‘variables’ (because the data may varyaccording to the patient answering the question: male/female, old/young, satisfied or not satisfied etc.) How many males/females were referred for counselling? Are they similarproportions? Were there more males or females? How many patients were seen by John and how many were seen by Jane?Did they both see a similar number of patients?Cross-tabulation. The next step might be to cross-tabulate this data to gainmore specific information about the relationship between these two variables.For example, imagine that we had collected this information for 200 patientsand, from our frequencies analysis on each variable, we found the followingresults:Table 1.2 Sex of %100%Table 1.3 Counsellor seen by 00%While these tables tell us that 50 per cent of patients were male, and that eachcounsellor saw 50 per cent of patients, they do not inform us about the relationship between the two variables: were the male and female patients equallydistributed across the two counsellors or, at the other extreme, did all thefemale patients see Jane and all the male patients see John? In order to find thisout we need to cross-tabulate the data. It might produce the following table:Table 1.4 Cross-tabulation of gender and 00100100200In this example we can see that there were 100 male and 100 female patients(row totals). We can also see that the counsellors saw an equal number ofpatients: 100 saw John and 100 saw Jane (column totals). However, this crosstabulation table also shows us that patients were not equally distributedacross the two counsellors: whereas 80 per cent of males saw John, 80 per centof females saw Jane. If the patients were randomly distributed to each of the
10Quantitative Data Analysis Using SPSScounsellors you would expect a similar proportion seeing each of thecounsellors. So in this hypothetical example it would appear that there issome preference for male patients to see a male counsellor, and for femalesto see a female counsellor.This might be important information for the doctor. For example, if one ofthe counsellors was intending to leave and the doctor needed to employanother counsellor, this might suggest is it necessary to ensure a male and afemale counsellor are available to cater for patient preferences.Descriptive statistics for interval data: Measures of central tendencyHaving ‘run frequencies’ and cross-tabulated our categorical variables, wewould next turn to the other variables that contain interval data: age, numberof counselling sessions and satisfaction ratings. If we wanted to producesummary information about these items it would be more useful to providemeasures of central tendency: means, medians or modes.The Mean. The arithmetic mean is the most common measure of centraltendency. It is simply the sum of the scores divided by the number of scores.So, to calculate the mean in the following example, we simply divide the sumof the ages by the number of patients: 355/11 32. Thus, the mean age of thepatients is 32 years.Table 1.5 Calculating the mean Sum355The Median. The median is another common measure of central tendency. It isthe midpoint of an ordered distribution of scores. Thus, if we order the age ofpatients from lowest to highest it looks like this:Table 1.6 Finding the median The median is simply the middle number, in this case 31.If you have an even number of cases – with no singular middle number thenyou just take the midpoint between those two numbers:Table 1.7 Finding the median age in an even number of casesPati
4.4 Levels of statistical significance 67 4.5 Re-coding interval variables into categorical variables 69 4.6 Summary 73 4.7 Exercises 73 4.8 Notes 75 5 Correlation: examining relationships between interval data 77 5.1 Introduction 77 5.2 Examining correlations in the questionnaire 77 5.2.1 Producing a scatterplot in SPSS 78 5.2.