Transcription
SPSS BasicsØ Tutorial 1: SPSS WindowsThere are six different windows that can be opened when using SPSS. The following will givea description of each of them.The Data EditorThe Data Editor is a spreadsheet in which you define your variables and enter data. Each rowcorresponds to a case while each column represents a variable. The title bar displays thename of the open data file or "Untitled" if the file has not yet been saved. This window opensautomatically when SPSS is started.The Output NavigatorThe Output Navigator window displays the statistical results, tables, and charts from theanalysis you performed. An Output Navigator window opens automatically when you run aprocedure that generates output. In the Output Navigator windows, you can edit, move,delete and copy your results in a Microsoft Explorer-like environment.1
The Pivot Table EditorOutput displayed in pivot tables can be modified in many ways with the Pivot Table Editor.You can edit text, swap data in rows and columns, add color, create multidimensional tables,and selectively hide and show results.The Chart EditorYou can modify and save high-resolution charts and plots by invoking the Chart Editor for acertain chart (by double-clicking the chart) in an Output Navigator window. You can changethe colors, select different type fonts or sizes, switch the horizontal and vertical axes, rotate3-D scatterplots, and change the chart type.The Text Output EditorText output not displayed in pivot tables can be modified with the Text Output Editor. You canedit the output and change font characteristics (type, style, color, size).The Syntax EditorYou can paste your dialog box selections into a Syntax Editor window, where your selectionsappear in the form of command syntax.Ø Tutorial 2: Starting A SPSS Session1. Logon to your Polaris account.2. Select Programs from the Start menu.3. Select Scientific from the Programs drop down menu.4. Select SPSS 7.5 from the Scientific drop down menu.Ø Tutorial 3: Getting Help on SPSSqLocating Topics in the Help Menu1. Select Topics from the Help Menu on the Data Editor.2. Select the Contents tab. This will give a set of books to look under for the requiredinformation.qSearching for Information in the Help Menu1. Select Topics from the Help menu.2. Select the Index tab.3. Type a word in the text box describing the information to search for. This will give a list ofheadings on the desired information.Ø Tutorial 4: Ending A SPSS Session1. Select Exit SPSS from the File menu on the Data Editor.2
Creating and Manipulating Data in SPSSWhen creating or accessing data in SPSS, the Data Editor window is used.Ø Tutorial 1: Creating a New Data SetThere are three steps that must be followed to create a new data set in SPSS. The followingtutorial will list the steps needed and will give an example of creating a new data set.STEP 1: Defining Variables in a New Data SetVariables are defined one at a time using the Define Variable dialog box. This box assignsdata definition information to variables. To access the Define Variable dialog box, doubleclick on the top of a column where the word var appears or select Define Variable from theData menu.Variable Name: This field describes the name of the variable being defined. To change thename, place the cursor in this field and type the name. The variable namemust begin with a letter of the alphabet and cannot exceed 8 characters.Spaces are not allowed within the variable name. Each variable name mustbe unique.Type: This field describes the type of variable that is being defined.To change this field, click on the Type button. This will open the Define VariableType: dialog box. Select the appropriate type of data. When done, click on the Continuebutton.Variable Label: There are two types of variable labels:1. Variable Label: A name for the variable that can be up to 120 characterslong and can include spaces (which variable names cannot). If a variablelabel is entered, the label will be printed on charts and reports instead ofthe name, making them easier to understand.3
2. Value Label: Provides a key for translating numeric data.To change the variable label, click on the Labels button. This will open theDefine Labels: dialog box. Enter the appropriate information into the fields.When done, click on the Continue button.Missing Values:This field indicates which subset of the data will not be included in the dataset. To change this field, click on the Missing Values button. This willopen the Define Missing Values: dialog box. Enter the appropriateinformation into the fields. When done, click on the Continue button.Alignment: This field indicates column alignment and width. To change this field, click on theColumn Format button. This will open the Define Column Format: dialog box.Enter the appropriate information into the fields. When done, click on theContinue button.STEP 2: Entering Data in a New Data SetOnce all of the variables are defined, enter the data manually (assuming that the data is notalready in an external file). The data is typed into the spreadsheet one cell at a time. Eachcell represents an observation.When information is typed into a cell, it appears in the edit area at the top of the window. Theinformation is entered into the cell when the active cell is changed. The mouse and the tab,enter, and cursor keys can be used to enter data.To indicate a cell that does not have a data value, a period is entered. A period representsthe system-missing value.4
STEP 3: Saving a New Data SetWork performed on a data set only lasts during the current session. To retain the current dataset, it must be saved to a file.1. Select Save from the File menu. The Save Data As dialog box opens.2. From the Save as Type drop-down list, select SPSS (*.sav).3. From the Save in drop-down list, select the path where the file will be saved.4. In the File name box, enter a name for the file. SPSS automatically adds the extension.sav.5. Click Save.ProblemThe following data regarding a person’s name, age and weight must be entered into a dataset using 5180130Solution1. Double click on the top of the first column in the Data Editor window. This will open theDefine Variable dialog box. Type Name in the Variable Name box.2. Select Type in the Change Settings area. This will open the Define Variable Typedialog box. Left click on String.3. Select Continue. This will close the Define Variable Type dialog box and will re-open theDefine Variable dialog box.4. Click OK. This will define the first column as a string variable called Name.5. Double click on the top of the second column. This will open the Define Variable dialogbox. Type Age in the Variable Name box.6. Select Type in the Change Settings area. This will open the Define Variable Typedialog box. Left click on Numeric. In the Width box, set it to 3. In the Decimal Places box,set it to 0.7. Select Continue. This will close the Define Variable Type dialog box and will re-open theDefine Variable dialog box.8. Click OK. This will define the second column as a numeric variable called Age.9. Double click on the top of the third column. This will open the Define Variable dialog box.Type Weight in the Variable Name box.5
10. Select Type in the Change Settings area. This will open the Define Variable Typedialog box. Left click on Numeric. In the Width box, set it to 3. In the Decimal Places box,set it to 0.11. Select Continue. This will close the Define Variable Type dialog box and will re-open theDefine Variable dialog box.12. Click OK. This will define the third column as a numeric variable called Weight.13. Enter the above information into the cells of the spreadsheet. The Data Editor should looklike the following.14. Select Save from the File menu.15. Choose the path where the file will be saved.16. Type temp in the File name box and click Save. SPSS will save this file as temp.sav inthe specified directory.Ø Tutorial 2: Creating a New Data Set From Other File FormatsSPSS is designed to handle a wide variety of formats including: Spreadsheet files created with Lotus 1-2-3 and ExcelDatabase files created with dBASETab-deliminated and other types of ASCII text filesSPSS data files create on other operating systemsSYSTAT data filesThe following tutorial will indicate how to read in a spreadsheet or text file into a data set inSPSS. Examples will be given of each method.6
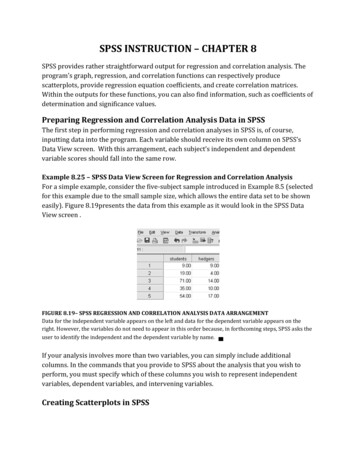
qReading Spreadsheet Files (Lotus 1-2-3 and Excel)ProblemRead the following file, /SPSS/nba.xls, into a SPSS data set.Solution1. From the File menu, select Open. This will open the Open File dialog box.2. Change the path name to your home directory and open the SPSS folder. This iswhere the file to be opened should be.3. Select Excel(*.xls) (or Lotus(*.w*) for Lotus files) from the Files of type box.4. Select nba.xls.5. Click Open. This will open the Opening File Options dialog box. Click on the Readvariable names dialog box. Click OK. This will close the Opening File Options dialogbox and will open nba.xls in the Data Editor. The Output Navigator will also beopened.NOTE:If only a partial file is to be read into SPSS, the following steps are taken. For Lotus files, in the Range box, specify the beginning column letter andnumber followed by two periods followed by the ending column letter andnumber. Ie. A1.C12For Excel files, in the Range box, specify the beginning column letter andnumber followed by a colon followed by the ending column letter andnumber. Ie. A1:C12rowrowrowrow6
Window Output7
qReading Text FilesTwo ways to read a text file are by using freefield or fixed columns.FreefieldThis method is used if the variables are recorded in the same order for each case but notnecessarily in the same column locations.ProblemRead the following file, /SPSS/citydata.txt, into an SPSS data set.Solution1. Select Read ASCII Data from the File Menu. From the Read ASCII Data drop downmenu, choose Freefield. This will open the Define Freefield Variables dialog box.2. Specify the variable name and data type. The following gives a description of each ofthese fields.Name: Variable names must begin with a letter and cannot exceed eight characters.Each variable name must be unique.Data Type: Select a data type.3. Click Add for each separate variable. This will enter the variable name and data typeonto the Defined Variables list.4. Once all variables are defined, click Browse to specify the name of the file to be read.This will open the Define Freefield Variables: Browse dialog box. Change the pathname to your home directory and open the SPSS folder. This is where the file to beopened should be.5. Select citydata.txt and click Open. The Define Freefield Variables dialog box will bereturned.6. Click OK. This will close the Define Freefield Variables dialog box and will opencitydata.txt in the Data Editor.8
Window OutputFixed ColumnsThis method is used if each variable is recorded in the same column location for eachcase in the data file.ProblemRead the following file, /SPSS/nba.txt, into an SPSS data set.Solution1. Select Read ASCII Data from the File Menu. From the Read ASCII Data drop downmenu, choose Fixed Columns. This will open the Define Fixed Variables dialog boxwhich will be used to define each variable.2. Specify the variable name, record, column locations, and data type. The followinggives a description of each of these fields.Name: Variable names must begin with a letter and cannot exceed eight characters.Each variable name must be unique.9
Record: A case can have data on more than one line. The record number indicatesthe line within the case where the variable is located.Start Column/End Column: These specifications indicate the location of the variablewithin the record. The value for the variable can appearanywhere within the range of columns.Data Type: Select a data type.For this problem, the following is a list of the required information.NamePlayerHeightWeightRecord111Column Locations1-34-78-12Data TypeNumeric as isNumeric as isNumeric as is3. When all information is added for a variable, click Add. This will enter the recordnumber, start and end columns, variable name, and data type onto the DefinedVariables list.4. Once all variables are defined, click Browse to specify the name of the file to be read.This will open the Define Fixed Variables: Browse dialog box. Change the path nameto your home directory and open the SPSS folder. This is where the file to be openedshould be.5. Select nba.txt and click Open. The Define Fixed Variables dialog box will be returned.6. Click OK. This will close the Define Fixed Variables dialog box and will open nba.txtin the Data Editor.Window Output10
Ø Tutorial 3: Opening an Existing SPSS Data Set1. Select Open from the File menu. This will open the Open File dialog box.2. From the Files of type drop-down list, select .sav.3. From the Look in drop-down list, select the appropriate drive where the file is located.4. In the File name box, type in the name of the file to be opened.5. Click Open.Ø Tutorial 4: Printing a Data Set1. Highlight the data that will be printed. To print all of the data, ignore this step andcontinue to step 2.2. Select Print from the File menu. The Print dialog box opens. Change the options whereappropriate.3. Click OK.11
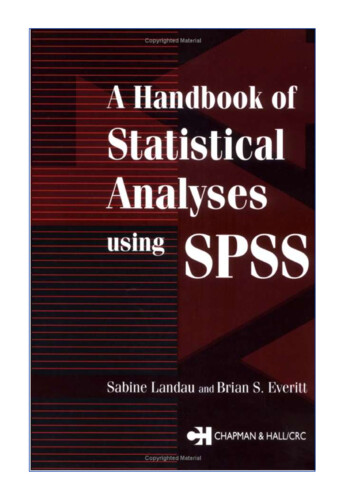
Generating Descriptive Statistics in SPSSThe following tutorials will demonstrate how to generate descriptive statistics in SPSS.Ø Tutorial 1: Mean, Sum, Standard Deviation, Variance, Minimum Value,Maximum Value, and RangeWhen generating these statistics, the Data Editor must be open with the appropriate data setbefore continuing.ProblemUsing the data in the file nba.txt that is located in /SPSS/, determine the mean, sum,standard deviation, variance, minimum value, maximum value, and range for height only.Solution1. From the Statistics menu, select Summarize. From the Summarize drop down menu,select Descriptives. This will open the Descriptives dialog box.2. In the variable list, select the variable height. Left click on the right arrow button betweenthe boxes to move this variable over to the Variable(s) box. To calculate statistics formany variables, simultaneously add variables to the Variable(s) box.3. Click on the Options button. This will open the Descriptives: Options dialog box.Click on mean, sum, standard deviation, variance, minimum value, maximum value, andrange.Click on the Continue button when done.12
4. Click OK. The Descriptives dialog box closes and SPSS activates the Output Navigator toillustrate the statistics.Window OutputØ Tutorial 2: CorrelationTwo or more variables may be included in a correlation matrix. When generating thecorrelation matrix, the Data Editor must be open with the appropriate data set beforecontinuing.ProblemUsing the data in the file nba.txt that is located in /SPSS/, determine the correlation betweena player’s height and weight.Solution1. From the Statistics menu, select Correlate. From the Correlate drop down menu, selectBivariate. This will open the Bivariate Correlations dialog box.2. In the variable list, select height and weight. Left click on the right arrow button betweenthe boxes to move a variable over to the Variable(s) box.3. Select the type of correlation coefficients that will be generated. In this case, usePearson.13
4. Select the test of significance to be used. In this case, use two-tailed.5. Check mark the Flag significant correlations box.6. Click on the Options button. This will open the Bivariate Correlations: Options dialogbox.To display the mean and standard deviation for each variable, select Means andstandard deviations. In this case, this option is not used.To display cross product deviations and covariances for each pair of variables, selectCross-product devations and covariances. In this case, this option will not be used.When done, click the Continue button.7. Click OK. The Bivariate Correlations dialog box closes and SPSS activates the OutputNavigator. The correlation coefficient for each pair of variables is displayed. The numberof cases appears at the bottom.Window Output14
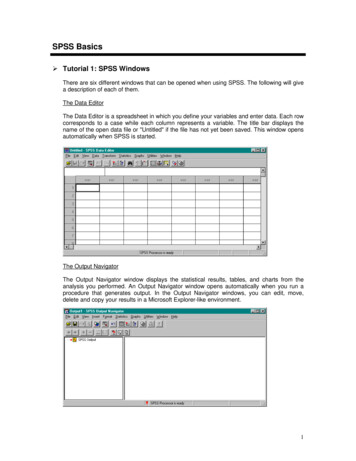
Generating Graphical Statistics in SPSSThe following tutorials introduce how to create scatter plots, histograms, stem and leaf plots, andbox plots using the SPSS Graphs menu located on the Data Editor menu bar.Ø Tutorial 1: How to Generate Scatter PlotsProblemUsing the data in /SPSS/nba.txt, create an x-y plot of a player’s weight versus height.Solution1. From the Graphs menu, select Scatter This will open the Scatterplot dialog box.2. Select the Simple icon and click Define. This will open the Simple Scatterplot dialog box.3. From the variable list, select weight. Left click on the right arrow button between thevariable list and the Y Axis box to move the variable, weight, to this box.4. From the variable list, select height. Left click on the right arrow button between thevariable list and the X Axis box to move the variable, height, to this box.5. Click on the Options button. This will open the Options dialog box.15
To display a report of missing values, select Display groups defined by missing values. Inthis case, this option will not be used.When done, click the Continue button.6. To display titles, subtitles, or footnotes on the histogram, click on the Titles button. Thiswill open the Titles dialog box.In the Line 1 box, type “Scatter Plot Height vs. Weight”.When done, click the Continue button.7. Click OK. The Simple Scatterplot dialog box closes and SPSS activates the OutputNavigator.Window Output16
Ø Tutorial 2: How to Generate a HistogramProblemUsing the data in /SPSS/statdata.txt, create histogram of per capita income.Solution1. From the Graphs menu, select Histogram This will open the Histogram dialog box.2. From the variable list, select income. Left click on the right arrow button between thevariable list and the Variable box to move the variable, income, to this box.3. Select Display normal curve box to show a normal curve on the histogram.4. To display titles, subtitles, or footnotes on the histogram, click on the Titles button. Thiswill open the Titles dialog box.In the Line 1 box, type “Histogram of Per Capita Income”.Click on the Continue button when done.5. Click OK. The Histogram dialog box will close and SPSS activates the Output Navigatorto display the histogram.17
Window OutputØ Tutorial 3: How to Generate a Stem and Leaf PlotProblemUsing the data in /SPSS/statdata.txt, create a stem and leaf plot of per capita income.Solution1. From the Statistics menu, select Summarize. From the Summarize drop-down menu,select Explore This will open the Explore dialog box.2. From the variable list, select income. Left click on the right arrow button between thevariable list and the Dependent List box to move the variable, income, to this box.3. Click on the Statistics button. This will open the Explore: Statistics dialog box.18
To display descriptive statistics, select Descriptives.To display maximum likelihood estimators, select M-estimators.To display cases with the five largest and smallest values, select Outliers.To display percentiles, select Percentiles.In this case, none of these options are used.When done, click on the Continue button.4. In the Display area, select Plots. This will display the specified plot only (i.e. no statisticsare given).5. Click on the Plots button. This opens the Explore: Plots dialog box.Ensure that the Stem-and-leaf box is selected.Click on the Continue button.6. Click on the Options button. This will open the Explore: Options button.To exclude cases that have missing values for any of the variables used in any of theanalyses, select Exclude cases listwise. In this case, this option is used.To exclude cases that have missing values for either or both of the pair of variables in aspecific correlation coefficient, select Exclude cases pairwise.19
However, to treat missing values as a separate category, select Report values.Click the Continue button when done.7. Click OK. This will close the Explore dialog box and SPSS activates the Output Navigatorto display the stem and leaf plot.Window Output20
Ø Tutorial 4: How to Generate a Box PlotProblemUsing the data in the file, /SPLUS/statdata.dat, produce a boxplot of per capita incomeSolution1. From the Graphs menu, select Boxplot This will open the Boxplot dialog box.2. Select the Simple button.3. Select Summaries of separate variables in the Data in Chart Are area.4. Click on the Define button. This will open the Define Simple Boxplot: Summaries ofSeparate Variables dialog box.5. From the variable list, select income. Left click on the right arrow button between thevariable list and the Boxes Represent box to move the variable, income, to this box.6. Click on the Options button. This will open the Options dialog box.To display a report of missing values, select Display groups defined by missing values. Inthis case, this option will not be used.When done, click the Continue button.21
7. Click OK. This will close the Define Simple Boxplot: Summaries of Separate Variablesdialog box and SPSS activates the Output Navigator to display the box plot.Window Output22
Statistical Models in SPSSØ Tutorial 1: Linear RegressionThe Regression submenu on the Statistics menu of the Data Editor provides regressiontechniques. The following tutorial will introduce how to perform linear regression using SPSS.The output contains goodness of fit statistics and the coefficients for the variables.ProblemUsing the data in /SPSS/nba.txt, compute a least squares regression line to investigate if aplayer’s height can predict his weight.Solution1. From the Statistics menu, select Regression. From the Regression drop down menu,select Linear This will open the Linear Regression dialog box.2. From the variable list, select weight. Left click on the right arrow button between thevariable list and the Dependent box to move the variable, weight, to this box.3. From the variable list, select height. Left click on the right arrow button between thevariable list and the Independent(s) box to move the variable, height, to this box.4. Select the method the independent variables are entered into the analysis. From theMethod drop-down menu, there is a choice of enter, stepwise, remove, backward, andforward. In this case, we will use the enter method.5. To limit the analysis to a subset of cases having a particular value for a variable, enterthis variable into the Selection Variable box. In this case, this option is not used.6. Determine the variable that will identify the points on plots. Select the variable and leftclick on the right arrow between the variable list and the Case Labels box. In this case,this option is not used.23
7. To display statistics, click on the Statistics button. This will open the Linear Regression:Statistics dialog box.Select the appropriate statistics to be displayed and click on the Continue button whendone. In this case, this option is not used.8. To display specific plots, click on the Plots button. This will open the LinearRegression: Plots dialog box.From the variable list, select the variable that will be displayed on the Y axis. Left click onthe right arrow button between the variable list and the Y box. Do this also for the X axis.When done, click on the Next button. If more plots are needed, follow the sameprocedure. In this case, this option is not used.When done defining the plots, click on the Continue button.9. To indicate which statistics should be displayed, click on the Save button. This will openthe Linear Regression: Save dialog box.24
Select the appropriate statistics. To save the coefficient statistics, click on the box andindicate the file to which you want them saved. In this case, this option is not used.10. To indicate the stepping method criteria, click the Options button. This will open theLinear Regression: Options dialog box.Select the method to be used. When the selection is made, click on the Continue button.11. Click OK. This will close the Linear Regression dialog box. SPSS activates the OutputNavigator to display the results of the analysis.Window Output25
Ø Tutorial 2: Analysis of VarianceProblemUsing the data in /SPSS/teller1.txt, test if the mean number of customers served per hour byeach of the four tellers is the same.Solution1. From the Statistics menu, select Compare Means. From the Compare Means drop downmenu, select One-Way ANOVA This will open the One-Way ANOVA dialog box.2. From the variable list, select num cus. Left click on the right arrow button between thevariable list and the Dependent List box to move the variable, num cus, to this box.3. From the variable list, select teller. Left click on the right arrow button between thevariable list and the Factor box to move the variable, teller, to this box.4. Click on the Contrasts button. This will open the One-Way ANOVA: Contrasts dialogbox.To partition between-groups sum of squares into polynomial trend components, selectthe Polynomial box and select the highest degree of the polynomial to be modelled. Inthis case, this option will not be used.To enter a numeric coefficient value for each level, click Add. However, the number ofcoefficients must equal the number of groups or the analysis is not performed. Becausethe levels in this problem are already numeric, this option does not need to be used.26
5. Click on the Post Hoc button. This will open the One-Way ANOVA: Post Hoc MultipleComparisons dialog box.If equal variances are assumed between the different factor levels, select the type ofcomparison method to be used.If equal variance are not assumed between the different factor levels, select the type ofcomparison method to be used.To get a description on each of the methods listed, right click on the word. A descriptionwindow will appear.Click the Continue button when done.6. Click on the Options button. This will open the One-Way ANOVA: Options dialog box.To display descriptive statistics, select Descriptive in the Statistics area. In this case,select this option.To exclude cases that have missing values for the variable involved in that test, selectExclude cases analysis by analysis. In this case, select this option.However, to exclude cases that have missing values for any of the variables used in anyof the analyses, select Exclude cases listwise.Click the Continue button when done.7. Click OK. The One-Way ANOVA dialog box closes and SPSS activates the OutputNavigator. The means of the dependent variable for each category of the independentvariable can be found under "Descriptives".27
Window Output28
SPSS Basics Ø Tutorial 1: SPSS Windows There are six different windows that can be opened when using SPSS. The following will give a description of each of them. The Data Editor The Data Editor is a spreadsheet in which you define your variables and enter data. Each row corre