Transcription
A Handbook ofStatistical Analysesusing SPSSSabine LandauandBrian S. EverittCHAPMAN & HALL/CRCA CRC Press CompanyBoca Raton London New York Washington, D.C. 2004 by Chapman & Hall/CRC Press LLC
Library of Congress Cataloging-in-Publication DataLandau, Sabine.A handbook of statistical analyses using SPSS / Sabine, Landau, Brian S. Everitt.p. cm.Includes bibliographical references and index.ISBN 1-58488-369-3 (alk. paper)1. SPSS ( Computer file). 2. Social sciences—Statistical methods—Computer programs. 3.Social sciences—Statistical methods—Data processing. I. Everitt, Brian S. II. Title.HA32.E93 2003519.5d0285—dc222003058474This book contains information obtained from authentic and highly regarded sources. Reprinted materialis quoted with permission, and sources are indicated. A wide variety of references are listed. Reasonableefforts have been made to publish reliable data and information, but the author and the publisher cannotassume responsibility for the validity of all materials or for the consequences of their use.Neither this book nor any part may be reproduced or transmitted in any form or by any means, electronicor mechanical, including photocopying, microfilming, and recording, or by any information storage orretrieval system, without prior permission in writing from the publisher.The consent of CRC Press LLC does not extend to copying for general distribution, for promotion, forcreating new works, or for resale. Specific permission must be obtained in writing from CRC Press LLCfor such copying.Direct all inquiries to CRC Press LLC, 2000 N.W. Corporate Blvd., Boca Raton, Florida 33431.Trademark Notice: Product or corporate names may be trademarks or registered trademarks, and areused only for identification and explanation, without intent to infringe.Visit the CRC Press Web site at www.crcpress.com 2004 by Chapman & Hall/CRC Press LLCNo claim to original U.S. Government worksInternational Standard Book Number 1-58488-369-3Library of Congress Card Number 2003058474Printed in the United States of America 1 2 3 4 5 6 7 8 9 0Printed on acid-free paper 2004 by Chapman & Hall/CRC Press LLC
PrefaceSPSS, standing for Statistical Package for the Social Sciences, is a powerful,user-friendly software package for the manipulation and statistical analysisof data. The package is particularly useful for students and researchers inpsychology, sociology, psychiatry, and other behavioral sciences, containing as it does an extensive range of both univariate and multivariateprocedures much used in these disciplines. Our aim in this handbook isto give brief and straightforward descriptions of how to conduct a rangeof statistical analyses using the latest version of SPSS, SPSS 11. Each chapterdeals with a different type of analytical procedure applied to one or moredata sets primarily (although not exclusively) from the social and behavioral areas. Although we concentrate largely on how to use SPSS to getresults and on how to correctly interpret these results, the basic theoreticalbackground of many of the techniques used is also described in separateboxes. When more advanced procedures are used, readers are referredto other sources for details. Many of the boxes contain a few mathematicalformulae, but by separating this material from the body of the text, wehope that even readers who have limited mathematical background willstill be able to undertake appropriate analyses of their data.The text is not intended in any way to be an introduction to statisticsand, indeed, we assume that most readers will have attended at least onestatistics course and will be relatively familiar with concepts such as linearregression, correlation, significance tests, and simple analysis of variance.Our hope is that researchers and students with such a background willfind this book a relatively self-contained means of using SPSS to analyzetheir data correctly.Each chapter ends with a number of exercises, some relating to thedata sets introduced in the chapter and others introducing further datasets. Working through these exercises will develop both SPSS and statisticalskills. Answers to most of the exercises in the text are provided at 2004 by Chapman & Hall/CRC Press LLC
PSSBook.shtml.The majority of data sets used in the book can be found at the same site.We are grateful to Ms. Harriet Meteyard for her usual excellent wordprocessing and overall support during the writing of this book.Sabine Landau and Brian EverittLondon, July 2003 2004 by Chapman & Hall/CRC Press LLC
DistributorsThe distributor for SPSS in the United Kingdom isSPSS U.K. Ltd.1st Floor St. Andrew’s House, West StreetWokingSurrey, United Kingdom GU21 6EBTel.0845 3450935FAX 01483 719290Email sales@spss.co.ukIn the United States, the distributor isSPSS Inc.233 S. Wacker Drive, 11th floorChicago, IL 60606-6307Tel.1(800) 543-2185FAX 1(800) 841-0064Email sales@spss.com 2004 by Chapman & Hall/CRC Press LLC
ContentsPrefaceDistributors1A Brief Introduction to SPSS1.11.21.31.41.51.61.71.82IntroductionGetting HelpData Entry1.3.1 The Data View Spreadsheet1.3.2 The Variable View SpreadsheetStoring and Retrieving Data FilesThe Statistics Menus1.5.1 Data File Handling1.5.2 Generating New Variables1.5.3 Running Statistical Procedures1.5.4 Constructing Graphical DisplaysThe Output ViewerThe Chart EditorProgramming in SPSSData Description and Simple Inference for ContinuousData: The Lifespans of Rats and Ages at Marriage in theU.S.2.12.22.32.4Description of DataMethods of Analysis.Analysis Using SPSS2.3.1 Lifespans of Rats2.3.2 Husbands and WivesExercises2.4.1 Guessing the Width of a Lecture Hall2.4.2 More on Lifespans of Rats: Significance Tests for ModelAssumptions2.4.3 Motor Vehicle Theft in the U.S.2.4.4 Anorexia Nervosa Therapy2.4.5 More on Husbands and Wives: Exact Nonparametric Tests 2004 by Chapman & Hall/CRC Press LLC
3Simple Inference for Categorical Data: From Belief inthe Afterlife to the Death Penalty and Race3.13.23.33.44Multiple Linear Regression: Temperatures in Americaand Cleaning Cars4.14.24.34.45Description of DataMethods of AnalysisAnalysis Using SPSS3.3.1 Husbands and Wives Revisited.3.3.2 Lifespans of Rats Revisited3.3.3 Belief in the Afterlife3.3.4 Incidence of Suicidal Feelings3.3.5 Oral Contraceptive Use and Blood Clots3.3.6 Alcohol and Infant Malformation3.3.7 Death Penalty VerdictsExercises3.4.1 Depersonalization and Recovery from Depression3.4.2 Drug Treatment of Psychiatric Patients: Exact Tests forTwo-Way Classifications3.4.3 Tics and Gender3.4.4 Hair Color and Eye ColorDescription of DataMultiple Linear RegressionAnalysis Using SPSS4.3.1 Cleaning Cars4.3.2 Temperatures in AmericaExercises.4.4.1 Air Pollution in the U.S.4.4.2 Body Fat4.4.3 More on Cleaning Cars: Influence DiagnosticsAnalysis of Variance I: One-Way Designs; Fecundity ofFruit Flies, Finger Tapping, and Female Social Skills.5.15.25.35.4Description of DataAnalysis of Variance.Analysis Using SPSS5.3.1 Fecundity of Fruit Flies .5.3.2 Finger Tapping and Caffeine Consumption.5.3.3 Social Skills of FemalesExercises.5.4.1 Cortisol Levels in Psychotics: Kruskal-Wallis Test5.4.2 Cycling and Knee-Joint Angles5.4.3 More on Female Social Skills: Informal Assessment ofMANOVA Assumptions 2004 by Chapman & Hall/CRC Press LLC
6Analysis of Variance II: Factorial Designs; Does MarijuanaSlow You Down? and Do Slimming Clinics Work?6.16.26.36.47Analysis of Repeated Measures I: Analysis of VarianceType Models; Field Dependence and a Reverse StroopTask7.17.27.37.48Description of DataRepeated Measures Analysis of VarianceAnalysis Using SPSSExercises7.4.1 More on the Reverse Stroop Task7.4.2 Visual Acuity Data.7.4.3 Blood Glucose LevelsAnalysis of Repeated Measures II: Linear Mixed EffectsModels; Computer Delivery of Cognitive BehavioralTherapy8.18.28.38.49Description of DataAnalysis of VarianceAnalysis Using SPSS6.3.1 Effects of Marijuana Use6.3.2 Slimming ClinicsExercises6.4.1 Headache Treatments6.4.2 Biofeedback and Hypertension6.4.3 Cleaning Cars Revisited: Analysis of Covariance6.4.4 More on Slimming ClinicsDescription of DataLinear Mixed Effects ModelsAnalysis Using SPSSExercises8.4.1 Salsolinol Levels and Alcohol Dependency8.4.2 Estrogen Treatment for Post-Natal Depression8.4.3 More on “Beating the Blues”: Checking the Model forthe Correlation StructureLogistic Regression: Who Survived the Sinking of theTitanic?9.19.29.39.4Description of DataLogistic RegressionAnalysis Using SPSSExercises9.4.1 More on the Titanic Survivor Data9.4.2 GHQ Scores and Psychiatric Diagnosis9.4.3 Death Penalty Verdicts Revisited 2004 by Chapman & Hall/CRC Press LLC
10 Survival Analysis: Sexual Milestones in Women andField Dependency of Children.10.1 Description of Data10.2 Survival Analysis and Cox’s Regression10.3 Analysis Using SPSS10.3.1 Sexual Milestone Times10.3.2 WISC Task Completion Times10.4 Exercises10.4.1 Gastric Cancer10.4.2 Heroin Addicts10.4.3 More on Sexual Milestones of Females11 Principal Component Analysis and Factor Analysis:Crime in the U.S. and AIDS Patients’ Evaluations ofTheir Clinicians11.1 Description of Data11.2 Principal Component and Factor Analysis11.2.1 Principal Component Analysis11.2.2 Factor Analysis11.2.3 Factor Analysis and Principal Components Compared11.3 Analysis Using SPSS11.3.1 Crime in the U.S.11.3.2 AIDS Patients’ Evaluations of Their Clinicians11.4 Exercises11.4.1 Air Pollution in the U.S.11.4.2 More on AIDS Patients’ Evaluations of Their Clinicians:Maximum Likelihood Factor Analysis12 Classification: Cluster Analysis and DiscriminantFunction Analysis; Tibetan Skulls12.1 Description of Data12.2 Classification: Discrimination and Clustering12.3 Analysis Using SPSS12.3.1 Tibetan Skulls: Deriving a Classification Rule .12.3.2 Tibetan Skulls: Uncovering Groups.12.4 Exercises12.4.1 Sudden Infant Death Syndrome (SIDS)12.4.2 Nutrients in Food Data12.4.3 More on Tibetan SkullsReferences 2004 by Chapman & Hall/CRC Press LLC
Chapter 1A Brief Introductionto SPSS1.1 IntroductionThe “Statistical Package for the Social Sciences” (SPSS) is a package ofprograms for manipulating, analyzing, and presenting data; the packageis widely used in the social and behavioral sciences. There are severalforms of SPSS. The core program is called SPSS Base and there are anumber of add-on modules that extend the range of data entry, statistical,or reporting capabilities. In our experience, the most important of thesefor statistical analysis are the SPSS Advanced Models and SPSS RegressionModels add-on modules. SPSS Inc. also distributes stand-alone programsthat work with SPSS.There are versions of SPSS for Windows (98, 2000, ME, NT, XP), majorUNIX platforms (Solaris, Linux, AIX), and Macintosh. In this book, wedescribe the most popular, SPSS for Windows, although most features areshared by the other versions. The analyses reported in this book are basedon SPSS version 11.0.1 running under Windows 2000. By the time thisbook is published, there will almost certainly be later versions of SPSSavailable, but we are confident that the SPSS instructions given in eachof the chapters will remain appropriate for the analyses described.While writing this book we have used the SPSS Base, Advanced Models,Regression Models, and the SPSS Exact Tests add-on modules. Other available add-on modules (SPSS Tables, SPSS Categories, SPSS Trends, SPSSMissing Value Analysis) were not used. 2004 by Chapman & Hall/CRC Press LLC
1. SPSS Base (Manual: SPSS Base 11.0 for Windows User’s Guide): Thisprovides methods for data description, simple inference for continuous and categorical data and linear regression and is, therefore,sufficient to carry out the analyses in Chapters 2, 3, and 4. It alsoprovides techniques for the analysis of multivariate data, specificallyfor factor analysis, cluster analysis, and discriminant analysis (seeChapters 11 and 12).2. Advanced Models module (Manual: SPSS 11.0 Advanced Models):This includes methods for fitting general linear models and linearmixed models and for assessing survival data, and is needed tocarry out the analyses in Chapters 5 through 8 and in Chapter 10.3. Regression Models module (Manual: SPSS 11.0 Regression Models):This is applicable when fitting nonlinear regression models. We haveused it to carry out a logistic regression analysis (see Chapter 9).(The Exact Tests module has also been employed on occasion, specificallyin the Exercises for Chapters 2 and 3, to generate exact p-values.)The SPSS 11.0 Syntax Reference Guide (SPSS, Inc., 2001c) is a referencefor the command syntax for the SPSS Base system and the RegressionModels and Advanced Models options.The SPSS Web site (http://www.spss.com/) provides information onadd-on modules and stand-alone packages working with SPSS, events andSPSS user groups. It also supplies technical reports and maintains afrequently asked questions (FAQs) list.SPSS for Windows offers a spreadsheet facility for entering and browsing the working data file — the Data Editor. Output from statistical procedures is displayed in a separate window — the Output Viewer. It takes theform of tables and graphics that can be manipulated interactively and canbe copied directly into other applications.It is its graphical user interface (GUI) that makes SPSS so easy bysimply selecting procedures from the many menus available. It is the GUIthat is used in this book to carry out all the statistical analysis presented.We also show how to produce command syntax for record keeping.We assume that the reader is already familiar with the Windows GUIand we do not spend much time discussing the data manipulation andresult presentation facilities of SPSS for Windows. These features aredescribed in detail in the Base User’s Guide (SPSS, Inc., 2001d). Ratherwe focus on the statistical features of SPSS — showing how it can beused to carry out statistical analyses of a variety of data sets and on howto interpret the resulting output. To aid in reading this text, we haveadopted the Helvetica Narrow font to indicate spreadsheet column names,menu commands, and text in dialogue boxes as seen on the SPSS GUI. 2004 by Chapman & Hall/CRC Press LLC
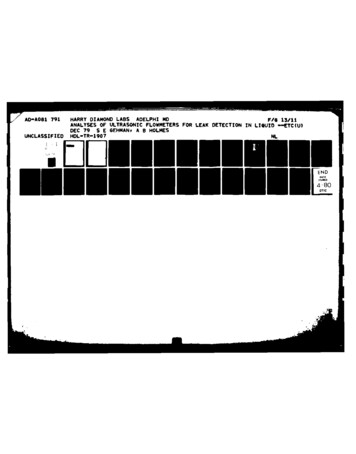
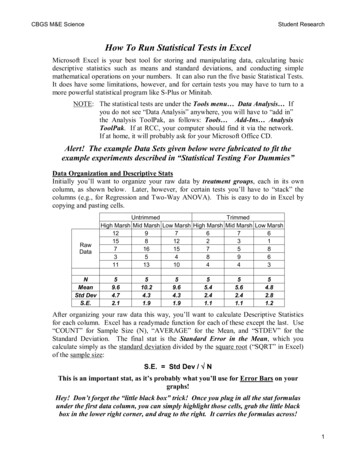
1.2 Getting HelpOnline help is provided from the Help menu or via context menus or Helpbuttons on dialogue boxes. We will mention the latter features whendiscussing the dialogue boxes and output tables. Here, we concentrateon the general help facility. The required menu is available from anywindow and provides three major help facilities:Help — Statistics Coach helps users unfamiliar with SPSS or the statisticalprocedures available in SPSS to get started. This facility promptsthe user with simple questions in nontechnical language aboutthe purpose of the statistical analysis and provides visual examplesof basic statistical and charting features in SPSS. The facility coversonly a selected subset of procedures.Help — Tutorial provides access to an introductory SPSS tutorial, including a comprehensive overview of SPSS basics. It is designed toprovide a step-by-step guide for carrying out a statistical analysisin SPSS. All files shown in the examples are installed with thetutorial so the user can repeat the analysis steps.Help — Topics opens the Help Topics: SPSS for Windows box, which provides access to Contents, Index, and Find tabs. Under the Contentstab, double-clicking items with a book symbol expands or collapses their contents (the Open and Close buttons do the same).The Index tab provides an alphabetical list of topics. Once a topicis selected (by double-clicking), or the first few letters of the wordare typed in, the Display button provides a description. The Findtab allows for searching the help files for specific words andphrases.1.3 Data EntryWhen SPSS 11.0 for Windows is first opened, a default dialogue boxappears that gives the user a number of options. The Tutorial can beaccessed at this stage. Most likely users will want to enter data or openan existing data file; we demonstrate the former (Display 1.1). Furtheroptions will be discussed later in this chapter. This dialogue box can beprevented from opening in the future by checking this option at thebottom of the box.When Type in data is selected, the SPSS Data Editor appears as an emptyspreadsheet. At the top of the screen is a menu bar and at the bottom astatus bar. The status bar informs the user about facilities currently active;at the beginning of a session it simply reads, “SPSS Processor is ready.” 2004 by Chapman & Hall/CRC Press LLC
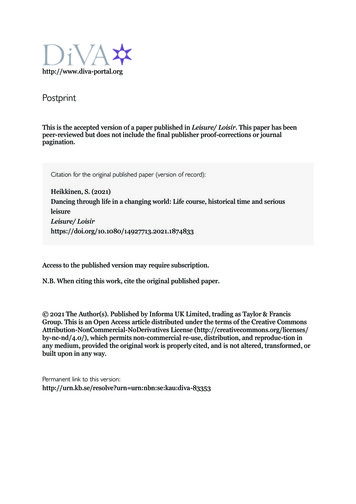
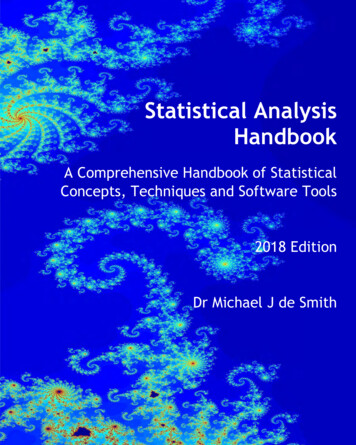
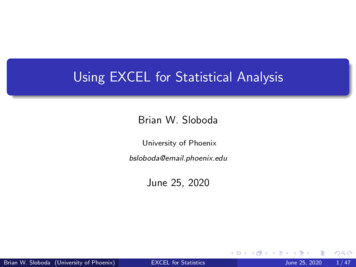
Display 1.1 Initial SPSS for Windows dialogue box.The facilities provided by the menus will be explained later in this chapter.SPSS also provides a toolbar for quick and easy access to common tasks.A brief description of each tool can be obtained by placing the cursorover the tool symbol and the display of the toolbar can be controlledusing the command Toolbars from the View drop-down menu (for moredetails, see the Base User’s Guide, SPSS Inc., 2001d).1.3.1 The Data View SpreadsheetThe Data Editor consists of two windows. By default the Data View, whichallows the data to be entered and viewed, is shown (Display 1.2). Theother window is the Variable View, which allows the types of variables tobe specified and viewed. The user can toggle between the windows byclicking on the appropriate tabs on the bottom left of the screen.Data values can be entered in the Data View spreadsheet. For mostanalysis SPSS assumes that rows represent cases and columns variables.For example, in Display 1.2 some of five available variable values havebeen entered for twenty subjects. By default SPSS aligns numerical dataentries to the right-hand side of the cells and text (string) entries to theleft-hand side. Here variables sex, age, extrover, and car take numerical 2004 by Chapman & Hall/CRC Press LLC
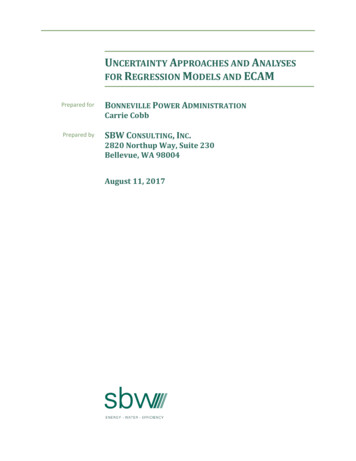
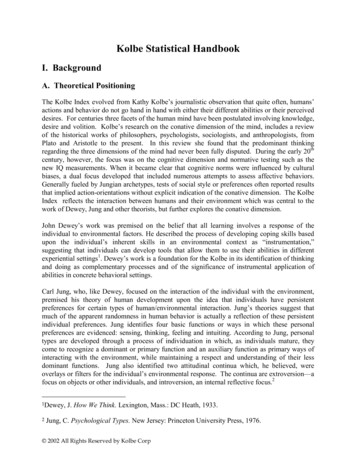
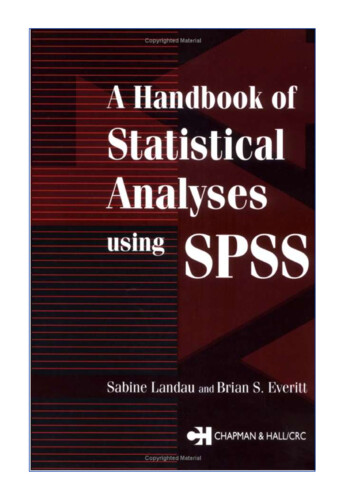
Display 1.2 Data View window of the Data Editor.values while the variable make takes string values. By default SPSS usesa period/full stop to indicate missing numerical values. String variablecells are simply left empty. Here, for example, the data for variablesextrover, car, and make have not yet been typed in for the 20 subjects sothe respective values appear as missing.The appearance of the Data View spreadsheet is controlled by the Viewdrop-down menu. This can be used to change the font in the cells, removelines, and make value labels visible. When labels have been assigned tothe category codes of a categorical variable, these can be displayed bychecking Value Labels (or by selectingon the toolbar). Once the categorylabels are visible, highlighting a cell produces a button with a downwardarrow on the right-hand side of the cell. Clicking on this arrow producesa drop-down list with all the available category labels for the variable.Clicking on any of these labels results in the respective category and labelbeing inserted in the cell. This feature is useful for editing the data.1.3.2 The Variable View SpreadsheetThe Variable View spreadsheet serves to define the variables (Display 1.3).Each variable definition occupies a row of this spreadsheet. As soon asdata is entered under a column in the Data View, the default name of thecolumn occupies a row in the Variable View. 2004 by Chapman & Hall/CRC Press LLC
Display 1.3 Variable View window of the Data Editor.There are 10 characteristics to be specified under the columns of theVariable View (Display 1.3):1. Name — the chosen variable name. This can be up to eightalphanumeric characters but must begin with a letter. While theunderscore ( ) is allowed, hyphens (-), ampersands (&), and spacescannot be used. Variable names are not case sensitive.2. Type — the type of data. SPSS provides a default variable type oncevariable values have been entered in a column of the Data View.The type can be changed by highlighting the respective entry inthe second column of the Variable View and clicking the three-periodssymbol ( ) appearing on the right-hand side of the
on SPSS version 11.0.1 running under Windows 2000. By the time this book is published, there will almost certainly be later versions of SPSS available, but we are confident that the SPSS instructions given in each of the chapters will remain appropriate for the analyses described. While w