Transcription
Ichimoku World Book SeriesVolume OneIchimoku BeginnerGabor Kovacs2010http://www.ichimokuworld.com2
Copyright 2010 by Gabor Kovacs. All rights reserved.First published in December 2010 by Gabor Kovacs.http://www.ichimokuworld.comNo part of this book may be reproduced or transmitted inany form or by any means, electronic or mechanical,including photocopying, recording or by any informationstorage and retrieval system, without prior permission inwriting from the publisher. However you can sharethis book anytime with anyone for free.Limit of Liability/Disclaimer of WarrantyWhile the author has used his best efforts in preparingthis book, he makes no representations or warrantieswith respect to the accuracy or completeness of thecontents of this book and specifically disclaim anyimplied warranties of merchantability or fitness for aparticular purpose.This information has been prepared to provide generalinformation only. It is not intended to take the place ofprofessional advice and you should not take action onspecific issues in reliance on this information. Inpreparing this information, we did not take into accountthe investment objectives, financial situation orparticular needs of any particular person.Before making an investment decision, you need toconsider (with or without the assistance of an adviser)whether this information is appropriate to your needs,objectives and circumstances.http://www.ichimokuworld.com3
I dedicate this book to Angelika,without whose assistance, advice and supportthis book wouldn't be possible.http://www.ichimokuworld.com4
CONTENTSINTRODUCTIONPART ONEPART TWO6GETTING TO KNOW THE ICHIMOKU METHOD7What is Ichimoku Kinko Hyo8Setting up the charts13BASIC CHART ANALYSIS16Using Ichimoku as a charting system17Using Ichimoku as a trading system28Example analyses36PRACTICE46Answer Key59Creating your first basic Ichimoku analysisPART THREEFINAL WORDShttp://www.ichimokuworld.comExercieses3347645
IntroductionThe Ichimoku World Book Series is a series of three books,each written at the right level for you at each stage in yourstudy of the Ichimoku Kinko Hyo system.The Ichimoku Beginner was written especially for those, whoare completely new to the Ichimoku method. The book isdevided into three main parts, each of which covers animportant topic of basic Ichimoku trading.The Getting to Know the Ichimoku Method chapterintroduces the Ichimoku Kinko Hyo system. Also it helps toset up the charts with the Ichimoku indicator, and explainsthe components of the system.The Basic Chart Analysis chapter teaches how to create abasic chart analysis with Ichimoku, shows how to use it as acharting system and explains how to find exact entryopportunities with the help of it.The Practice section at the end of the book gives theopportunity for practice and enable you to assess how muchyou have learned. Answers to the exercises are given at theback of the book.To find more analyses, explanations, learning materials andvideos in connecting with the way I trade the Ichimokusystem, please visit the Ichimoku World website athttp://www.ichimokuworld.comHave a great time reading this book!Gabor Kovacshttp://www.ichimokuworld.com6
Part OneGetting to Know the IchimokuMethodhttp://www.ichimokuworld.com7
What is IchimokuKinko Hyo?Ichimoku Kinko Hyo is a multifunctional visual trendfollowing charting system. It mentioned to be the king of theindicators and trading or analyzing with it is a kind of highlevel art.What does it's namemean?Ichimoku means: one glance, Kinko means: equilibrium (orbalance), and Hyo means: chart. The term Ichimoku KinkoHyo could be translated as: 'One glance equilibrium chart',or 'Chart balance at a glance'.http://www.ichimokuworld.com8
Who created theIchimoku Kinko Hyosystem?It was developed by a Japanese economic journalist, nameGoichi Hosoda, who aimed to create a kind of „all-in-one”indicator to analyze the charts more deeply but in less time.The development of the system was a huge and complexwork, as there was no possibility for doing automated backtests at that time. Goichi Hosoda started the process beforethe Second World War, with a large group of hired students,who had to manually backtest the different calculatedformulas. Finally, after more then twenty years of testing andchiseling, Hosoda presented the Ichimoku Kinko Hyocharting system in his book in 1969, and it rapidly becamethe most frequently used indicator in Japanese tradingrooms.Why is the system sospecial?With Ichimoku, it is possible to get the whole picture of esistance levels, and exact entry or exit points. Italso helps to define the strength of the signal. It is alsoimportant, that Ichimoku can be used successfully for allmarkets and on all time frames, but – like most indicators it performs a bit better on the higher ones.http://www.ichimokuworld.com9
Is it possible to readthe original book ofGoichiHosodainEnglish?Unfortunatelly no, as the original Ichimoku books andmaterials have never been translated into English. Manybelieves, that these materials are currently stored in a secretsafe of the Bank of Japan. Also, it is a gossip, that the wholemethod described in Hosoda's book was never been sharedfully with the public, and there might could be a secret bonuscomponent of the system. However these gossips were neverconfirmed officially.http://www.ichimokuworld.com10
Is it a stand-alonesystem?Ichimoku Kinko Hyo can be used in many ways. It can beused as a stand-alone system, or it can be used as a trend andprice behaviour analyser and can be combined with anytrading systems or strategies. It also can be used as an entrysignal generator, or it can be used to filter the signals ofanother trading system. Furthermore, as trading Ichimoku isa kind of high-level art, and art is quite a subjective thing,every Ichimoku trader trades the Ichimoku a bit differently.Ichimoku with a commercial trading system.Ichimoku with another Japanese system, the Renko.http://www.ichimokuworld.com11
What official sourcesuse Ichimoku regularlyfor chart analysis?Just to mention a few from the bigger news sources:http://www.ichimokuworld.com12
How can I add theIchimoku indicator tomy MT4 charts?1. Download and install the free Metatrader4 (MT4)platform. You can choose any broker that supportsMetatrader4 such as Alpari, InterbankFX, FXDD, FXPro etc.Feel free to use your existing brokerage account or chooseone by yourself.2. Open your Metatrader4.3. On the Navigator panel of your Metatrader chooseIndicators Ichimoku, and add it to you chart(s).What are the standardsettings of Ichimokuand why?The standard settings of are: 9-26-52. The base number ofthe formula is 26. The common view is that the number 26represents a standard Japanese business month (whichhttp://www.ichimokuworld.com13
included Saturdays), the number 9 represents a week and ahalf and the number 52 represents two months. Some holddifferent views and says that the calculation of GoichiHosoda based on - among others - Moon cycles, as thenumber 26 is the best approximate number to express a fullMoon cycle, the number 9 represents one and a half quarterMoon cycle, and number 52 represents a double Moon cycle.Is it possible to usealternativesettingvalues?Yes, it is possible. Some traders use the values of 2-22-44,however the recommended settings are still the originalvalues.WhatarecomponentstheoftheIchimoku Kinko Hyosystem?Ichimoku Kinko Hyo is constituted by five lines:- The Tenkan-Sen (Conversion line) is calculated as(Highest High Lowest Low)/2 for the past 9 periods.- The Kijun-Sen (Standard line) is calculated as (HighestHigh Lowest Low)/2 for the past 26 periods.- The Chikou Span (Lagging Span) is calculated as currentprice time-shifted backwards 26 periods.- The Senkou Span A (Faster Span A) is calculated as(Tenkan-Sen Kijun-Sen)/2.- The Senkou Span B (Faster Span B) is calculated as(Highest High Lowest Low)/2.http://www.ichimokuworld.com14
Is it necessary to learnthe Japanese name ofthe elements?It is very important to learn the exact Japanese name of theIchimoku lines, also it is a must to be able to identitfy thelines at a galnce when they are on a chart.Please read the following chapters only, if you have fullyunderstood and mastered the informations of this chapter. Ifyou have to think about which line is which, please continuepracticing the terminology and the identification of the linesbefore continuing to the next chapters.http://www.ichimokuworld.com15
Part TwoBasic Chart Analysishttp://www.ichimokuworld.com16
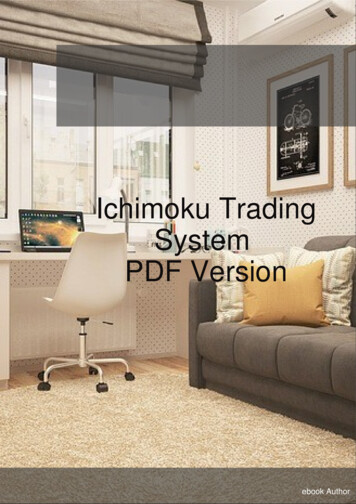
Using Ichimoku as acharting systemWhen we use the Ichimoku Kinko Hyo system as a chartingsystem, we don't want to get entry or exit signals, but wewant to get important informations about the market, forexample the trend direction, the future possibilities and themain support and resistance levels.Identifying the trend„Trend is your friend” - this is one of the basic and widelyknownconceptsof the technical analysis.Howeverunfortunately it is not just that easy. Trends spectacularlystand out on historical charts, but identifying a trend in thebeginning of it is one of the hardest tasks in chart analysis.This following few paragraphs will show how trends can bespotted out with Ichimoku Kinko Hyo.Analyzing the KumoThe latter two lines – Senkou Span A and Senkou Span B –form the unique Kumo feature of the system. To indentifythe trend, the first thing is to observe this component on it'sown and versus the other components and the price.a) The color of the KumoIf Senkou Span A is above Senkou Span B, the color of theKumo is light and it indicates a possible bullish trend. If theSenkou Span A is below Senkou Span B, the Kumo color isdark and the trend is indicated as bearish. When SenkouSpan A crosses Senkou Span B the color of the Kumochanges, and it raises the plausibility of a possible trendchange.http://www.ichimokuworld.com17
b) The thickness of the KumoThe thicker the Kumo, the stronger the trend is. A significantKumo means strong trend and a tiny Kumo indicates a weaktrend, as it is more easy for the price to move through a thinCloud than a thick one. However it is important to keep inmind, that the top and the bottom of the Kumo meansupport and resistance lines, so even a thin Kumo can turnthe price back to it's previous direction, however the chancesare lower.http://www.ichimokuworld.com18
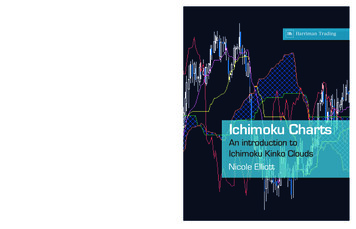
c) The Kumo versus priceOne of the most basic fundamentals of Ichimoku is: if theprice is above the Kumo, the trend is bullish, and if the priceis below the Kumo, the trend is bearish. It is very visible andeasy to determinate if the overall trend is bullish or bearishwith this method. It follows that every trend begins with aKumo breakout, when price breaks out from the Kumo cloudon the upside or on the downside, however for a perfectlyformed Kumo breakout Chikou Span has to break out fromthe Kumo too to confirm the direction. When price is movingin the body of the Cloud, it shows suspense in the trend.d) The Kumo versus Chikou SpanChikou Span can be above the Kumo (bullish trend), belowthe Kumo (bearish trend) or in the Kumo (neutral,undecided trend). Chikou Span is a very important trendhttp://www.ichimokuworld.com19
confirmation tool, so it is necessary to always reckon withthe chart analysis.e) The Kumo versus Kijun-Sen and Tenkan-SenHowever the position of Kijun-Sen and Tenkan-Sen isusually compared to the price, it's place versus the Kumo canbe the indicator of the strength of the trend too. If these linesare extruding on the upside of the Kumo, it supports furtherbullish trend. The opposite of it supports the continuation ofthe bearish trend.http://www.ichimokuworld.com20
ComparingcomponentstheotherversuspriceWe have already compared the Kumo versus price. Now let'sdo the same with the other components of Ichimoku.a) Chikou Span versus priceIf the Chikou Span crosses up the price it can be counted as abullish sign, and vice versa. If the price is on the upside ofthe Kumo and Chikou Span crosses it up, it is a very strongsign of the possibility of a longterm uptrend, and theopposite of it indicates a strong downtrend. If Chikou Spanis in the Kumo, the trend is undecided, because the SenkouSpan A and Senkou Span B support and resistance lines canaffect to it strongly, and Chikou Span can bounce the priceback even it has already broken out from the body of theCloud.http://www.ichimokuworld.com21
b) Kijun-Sen versus priceThe Kijun-Sen is behaving as a a very strong support orresistance level so it is a very important tool of identifyingtrend changes. If price crosses it up, this is a bullish sign, ifprice crosses it down, that is a bearish sign. A bullish crosscan happen above the Kumo (strong sign), in the Kumo(neutral sign), or below the Kumo (weak sign), and viceversa. The distance between Price and Kijun-Sen can be verytelling too, as if price leaves behind Kijun-Sen far away, itusually turns flat and attracts back the price to createequilibrium. Please notice, that this is not a sign of the trendchange, but only a bounce, and after the harmony of theKijun-Sen and price was restored, they usually move in thedirection of the trend again.http://www.ichimokuworld.com22
c) Tenkan-Sen versus priceTenkan-Sen is more sensitive to minor price movements, asit represents the momentum, however it can be used as atrend-confirmation tool too. For example if price is in atrend, it usually creates waves, and moves back throughTenkan-Sen to Kijun-Sen, then bounces into the direction ofthe trend again. If price moves through Tenkan-Sen in thedirection of the trend in the course of a bounce, it confirmsthe continuation of the trend.d) Chikou Span versus Kijun-SenChikou Span can be above (bullish sign), or below port/resistance level, as long as the Chikou Span is aboveit the bullish movements are well supported, and if ChikouSpan is staying below Kijun-Sen, the down movements aresupported. It is very common, that Chikou Span is bouncingon the Kijun-Sen before a huge move happens.http://www.ichimokuworld.com23
e) Tenkan-Sen versus Kijun-SenA Tenkan-Sen/ Kijun-Sen cross can also indicate the changeor the continuation of the trend. An up cross can happenabove the Kumo (strong signal), in the body of the Kumo(neutral signal), or below the Kumo (weak signal) and viceversa.http://www.ichimokuworld.com24
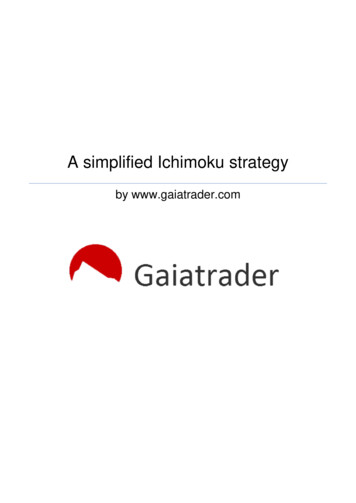
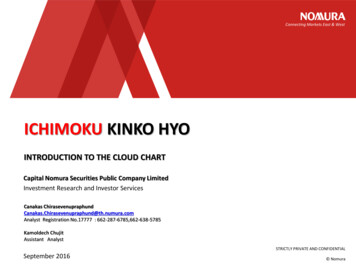
Thepictureoftheideal trendHowever the components of the Ichimoku Kinko Hyo systemwere described separately, it is indispensable to use bothcomponents together to see the overall trend and the wholepicture at a glance.It follows that the description of an ideal bullish trend signor confirmation would be:1. the price is above the Kumo, Tenkan-Sen and Kijun-Sen2. the Kumo is thick and bullish3. the Tenkan-Sen has crossed up Kijun-Sen above theKumo4. the Chikou Span is above both Kumo, Tenkan-Sen,Kijun-Sen and priceThe picture of an ideal bearish trend would be:1. the price is below the Kumo, Tenkan-Sen and Kijun-Sen2. the Kumo is thick and bearish3. the Tenkan-Sen has crossed down Kijun-Sen below theKumo4. the Chikou Span is below both Kumo, Tenkan-Sen,Kijun-Sen and pricehttp://www.ichimokuworld.com25
Ideal bearish trend.ThesignsoftrendweakeningRegarding to the previously described ideal bullish trend, thesigns of the trend weakening would be:1. Chikou Span moves below Kijun-Sen2. Price moves below Tenkan-Sen, then Kijun-Sen3. Tenkan-Sen crosses down Kijun-Sen4. Both Chikou Span, Tenkan-Sen, Kijun-Sen and pricemoves into the body of the Kumo5. The Kumo turns bearish (dark)Finally, if price breaks out from the Cloud on the downsidewith at least the confirmation of the Chikou Span, acomplete change of the trend (from bullish to bearish) canbe diagnosed.http://www.ichimokuworld.com26
Regarding to the previously described ideal bearish trend,the signs of the trend weakening would be:1. Chikou Span moves above Kijun-Sen2. Price moves above Tenkan-Sen, then Kijun-Sen3. Tenkan-Sen crosses up Kijun-Sen4. Both Chikou Span, Tenkan-Sen, Kijun-Sen and pricemoves into the body of the Kumo5. The Kumo turns bullish (light)Finally, if price breaks out from the Cloud on the upside withat least the confirmation of the Chikou Span, a completechange of the trend (from bearish to bullish) can bediagnosed.Identifyingsupportand resistance levelsAll Ichimoku lines are support and resistance lines, howeverthey don't have the same strenght.Regarding to the previously described ideal bullish trend,the strength order of the support levels (in descendingorder) would be:1. The bottom of the Kumo2. The top of the Kumo3. The Kijun-Sen4. The Tenkan-Senhttp://www.ichimokuworld.com27
Regarding to the previously described ideal bearish trend,the strength order of the support levels (in descendingorder) would be:1. The top of the Kumo2. The bottom of the Kumo3. The Kijun-Sen4. The Tenkan-SenUsing Ichimoku as atrading systemWhen we use the Ichimoku Kinko Hyo system as a tradingsystem, we don't just want to get important informationsabout the market, but we also want to get exact entry andexit signals from it.In this book I will only explain the two most commonly usedentry techniques what are recommended for beginners.http://www.ichimokuworld.com28
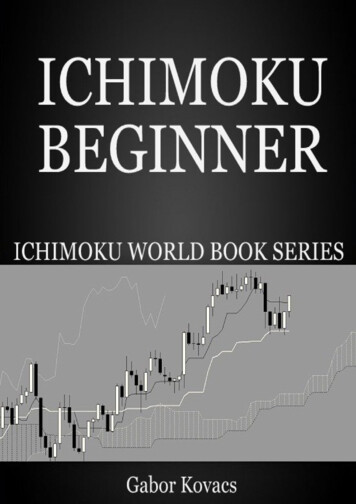
Tenkan-Sen/Kijun-SencrossStrong buy signal: cross happens above the KumoStrong sell signal: cross happens below the KumoNeutral buy/sell signal: cross happens in the body of theKumoWeak buy signal: cross happens below the KumoWeak sell signal: cross happens above the KumoEntry:- cross happens (prefer strong crosses)- the other Ichimoku components are supporting thedirection (as described in the Trend trading chapter).http://www.ichimokuworld.com29
Kumo breakoutWe are talking about a valid Kumo breakout, if the pricebreaks out from the body of the Kumo (closes outside of it),AND the Chikou Span confirms the move. If the price breaksout from the Kumo, but the Chikou Span doesn't, we call it afake breakout or a fake-out. If the other components aresupporting the move too, it makes the signal more stronger.Filtering rangingperiodsChoppy markets are the worst nightmare of most traders. Bythe help of the unique Kumo feature of the Ichimoku system,ranging periods of the market can be filtered out with moresuccess. If price marches into the body of the Kumo, itmeans the trend is undecided, and range is probable. It isnot recommended to enter into any position, when price ismoving in the Kumo. The same applies to Chikou Span. Itdoesn't matter, if price has already broken out from thehttp://www.ichimokuworld.com30
Kumo, if the Chikou Span is still there. It is very usual, thatChikou Span bounces back from the border of the Kumo andpulls the price back to it's previous direction.ThetimeframequestionNaturally an identified trend on the higher time frames canhold more potency and strength, than on the shorter timeframes. It follows that also a Kumo breakout or a TenkanSen/Kijun-Sen cross is more relevant on the higher timeframes than on the shorter ones. Furthermore, the highertime frame's Ichimoku components usually effect to theIchimoku lines on the lower time frames. For example, it istypical, that the value of the Daily chart's Kijun-Sen is theexact value of the H4 chart's Kumo top. In that case if pricecloses below the Daily Kijun-Sen, it also means that itentered into the Kumo on the H4 chart.http://www.ichimokuworld.com31
Where to put the StopLoss?You should always use a stop loss, no matter what. Even withIchimoku. In the support/resistance lines chapter Idescribed that the strongest support/resistance line is theother side of the Kumo. It follows that it is a good idea to putthe safety stop to that level a few pips buffer. It is also acommonly used technique to put the stop loss to the lasthigh/low buffer, or the last round number level buffer.Whentocloseaposition?A position is closed by the stop loss, or can be closedmanually (usually in profit). There are many goodtechniques regarding to the take profit targeting, in this bookI will only mention a few basic ones that are mostlyrecommended for beginners, and I will go deeper in thistopic in the next volume of the book series.The three main basic methods to close position are: close if the price crosses back the Kijun-Sen close if it reaches a round number level close after x amount of pips in profit.http://www.ichimokuworld.com32
CreatingbasicyourfirstIchimokuanalysisThe hardest thing for Ichimoku beginners are creating validbasic analyses. The reason is that the picture and trend isusually not as idealistic as we have learned in the prevoiussections. For example what if the price is under the Kumo,the Chikou Span is under the Kumo too, put above the price,Tenkan-Sen is below Kijun-Sen, and the Kumo future isbullish. Which signals has more relevance? Also, what if theH4 charts are completely bearish, but the 5M charts areclearly bullish?TheminimumrequirementsThese are the minimum requirements that you shouldalways check to be able to make a trading decision withIchimoku: the price vs Kumo Tenkan-Sen vs Kijun-Sen Chikou Span vs Kumo, Price and Kijun-Sen Kumo futureThese are the minimum requirements. Always check them inthis order. If these parameters are showing the same, youcan enter with a Tenkan-Sen/Kijun-Sen cross or with aKumo breakout. If you find that for example the Tenkan-Senand Kijun-Sen are breaking out from the Kumo too, it canhttp://www.ichimokuworld.com33
count as a bonus confirmation of the trend. But theminimum requirements are only the four previouslymentioned ones. If you find that three of them are showingthe same, but for example Tenkan-Sen crossed Kijun-Sen inthe opposite direction, do not enter till it starts to supportthe direction of the other three components too.The higher timeframesIt is always recommended to trade only in the direction ofthe higher timeframes. I would advice to check at least twohigher timeframes, so if you for example want to enter onthe 15M timeframe, check the H1 and H4 charts first. If youenter on the H1 chart, then check the H4 and Daily chartsfirst, etc. When checking the higher timeframes, pleasecheck at least the previous four minimum requirements.Always start from the higher time frames and proceed tolower time frames then and never enter against the highertimeframes. (It is possible to enter against them with somespecial Ichimoku techniques, but at this beginner stage thebest thing is to always trade in the direction of the highertrend.)Please feel free to use the following cheat sheet with yourdaily trading routine. Start from the top of it and put a smallup or down arrow next to every lines reagrding to thattimeframe's Ichimoku. If you have 4 small arrows pointinginto the same direction, you can move to the next (lower)timeframe. If you have there 4 small arrows pointing into thesame direction again, you can go to your entry timeframe.Analyse the charts with your cheat sheet and start to look forTenkan-Sen/Kijun-Sen crosses or Kumo breakouts there.http://www.ichimokuworld.com34
CHEAT SHEETHigher timeframe 1(e.g. H4) Price vs Kumo Tenkan-Sen vs Kijun-Sen Chikou Span vs Kumo, Price and Kijun-Sen Kumo futureHigher timeframe 2(e.g. H1) Price vs Kumo Tenkan-Sen vs Kijun-Sen Chikou Span vs Kumo, Price and Kijun-Sen Kumo futureEntry Timeframe(e.g. M15) Price vs Kumo Tenkan-Sen vs Kijun-Sen Chikou Span vs Kumo, Price and Kijun-Sen Kumo futurehttp://www.ichimokuworld.com35
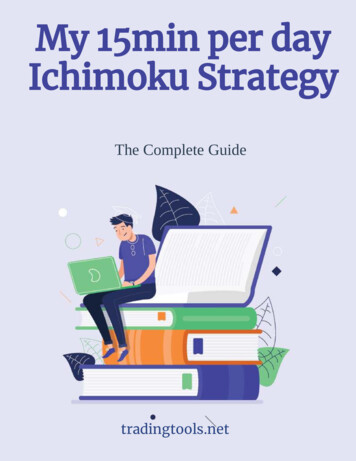
Example analysis 1.Higher timeframe 1. (H4) Price vs Kumo UP Tenkan-Sen vs Kijun-Sen UP Chikou Span vs Kumo, Price and Kijun-Sen UP Kumo future m36
Price vs Kumo UP Tenkan-Sen vs Kijun-Sen UP Chikou Span vs Kumo, Price and Kijun-Sen UP Kumo future UPEntry timeframe (M15) Price vs Kumo UP Tenkan-Sen vs Kijun-Sen UP Chikou Span vs Kumo, Price and Kijun-Sen UP Kumo future -Sen crossStop Loss: at the bottom of the Kumo bufferExit strategy: round number level, or price/Kijun-Sencrosshttp://www.ichimokuworld.com37
Example analysis 2.Highertimeframe1.(H4) Price vs Kumo DOWN Tenkan-Sen vs Kijun-Sen DOWN Chikou Span vs Kumo, Price and Kijun-Sen DOWN Kumo future com38
Price vs Kumo DOWN Tenkan-Sen vs Kijun-Sen DOWN Chikou Span vs Kumo, Price and Kijun-Sen DOWN Kumo future DOWNEntry timeframe (M15) Price vs Kumo DOWN Tenkan-Sen vs Kijun-Sen DOWN Chikou Span vs Kumo, Price and Kijun-Sen DOWN Kumo future un-Sen crossStop Loss: at the top of the Kumo bufferExit strategy: round number levelhttp://www.ichimokuworld.com39
Example analysis 3.Highertimeframe1.(H4) Price vs Kumo UP Tenkan-Sen vs Kijun-Sen UP Chikou Span vs Kumo, Price and Kijun-Sen UP Kumo future UPHigher timeframe 2.(H1)http://www.ichimokuworld.com40
Price vs Kumo UP Tenkan-Sen vs Kijun-Sen UP Chikou Span vs Kumo, Price and Kijun-Sen UP Kumo future UPEntry timeframe (M15) Price vs Kumo UP Tenkan-Sen vs Kijun-Sen UP Chikou Span vs Kumo, Price and Kijun-Sen UP Kumo future UPEntry strategy: Kumo breakoutStop Loss: at the bottom of the Kumo bufferExit strategy: price/Kijun-Sen crosshttp://www.ichimokuworld.com41
Example analysis 4.Highertimeframe1.(H4) Price vs Kumo UP Tenkan-Sen vs Kijun-Sen UP Chikou Span vs Kumo, Price and Kijun-Sen UP Kumo future m42
Price vs Kumo UP Tenkan-Sen vs Kijun-Sen UP Chikou Span vs Kumo, Price and Kijun-Sen UP Kumo future UPEntry timeframe (M15) Price vs Kumo UP Tenkan-Sen vs Kijun-Sen UP Chikou Span vs Kumo, Price and Kijun-Sen UP Kumo future UPEntry strategy: Kumo breakoutStop Loss: at the bottom of the Kumo bufferExit strategy: round number level, or price/Kijun-Sencrosshttp://www.ichimokuworld.com43
Example analysis 5.Highertimeframe1.(H4) Price vs Kumo DOWN Tenkan-Sen vs Kijun-Sen DOWN Chikou Span vs Kumo, Price and Kijun-Sen DOWN Kumo future com44
Price vs Kumo DOWN Tenkan-Sen vs Kijun-Sen DOWN Chikou Span vs Kumo, Price and Kijun-Sen DOWN Kumo future DOWNEntry timeframe (M15) Price vs Kumo DOWN Tenkan-Sen vs Kijun-Sen DOWN Chikou Span vs Kumo, Price and Kijun-Sen DOWN Kumo future un-Sen crossStop Loss: at the bottom of the Kumo bufferExit strategy: price/Kijun-Sen crosshttp://www.ichimokuworld.com45
Part ThreePracticehttp://www.ichimokuworld.com46
Exerciese 1.What is the name of the Ichimoku components?Please write the names next to the correct .com47
Exerciese 2.Is the trend currently bullish or bearish?Why? Please give at least 4 explanations.The trend is . because:1.:2.:3.:4.:http://www.ichimokuworld.com48
Exerciese 3.What are the most important resistance levels onthis picture?Mention the 3 most important ones in com49
Exerciese 4.A.) Which strategy did we use when we entered atthe candle marked with the arrow?Answer: .http://www.ichimokuworld.com50
B.) In the red circle you can see a Tenkan-Sen/KijunSen cross. But we haven't entered there. Why?Please mention the one MOST important reason.Answer: .http://www.ichimokuworld.com51
Exerciese 5.Which strategy did we use when we entered at thecandle marked with the arrow? Was it a correctentry? Why?The name of the strategy: .Correct enty or not: .Why? .http://www.ichimokuworld.com52
Exerciese 6.Price broke out from the Kumo with a spectacularbullish candle. Is it a good idea to enter now? Why?Answer: .Why? .http://www.ichimokuworld.com53
Exerciese 7.Which one is the only good entry? Why?Answer: .Why: .http://www.ichimokuworld.com54
Exerciese 8.We have entered long after the close of the markedcandle. Where do we have to put the safety StopLoss?Answer: .http://www.ichimokuworld.com55
Exerciese 9.Regarding to the previous chart, we have enteredwith the marked candle and now we are in profit.When should we close the position if we use onlyIchimoku (no round number levels, etc)?Answer: .http://www.ichimokuworld.com56
Exerciese 10.Now look at the following two charts. It is time to create yourfirst own analyses. The first chart shows the (nearly) whole2010 year on the EURUSD Daily timeframe. The secondchart shows the (nearly) whole 2010 year on the USDJPYWeekly timeframe.Please do the full detailed analysis of the 2010 year regardingto these charts. Start from the black line on the left(01.01.2010), and analyse every movement with theIchimoku till the end of the chart. Please explain whathappened, and why happened. Be professional. After youhave made your first two high quality analyses, you can startpracticing what you have learned here on a demo account.Whe
The Ichimoku World Book Series is a series of three books, each written at the right level for you at each stage in your study of the Ichimoku Kinko Hyo system. The Ichimoku Beginner was written especially for those, who are completely new to the Ichimoku method. The book