Transcription
The Best Technical Indicatorin the WorldPresented byAndrew KeenePast performance is not indicative of future results.
RISK DISCLAIMERDay trading, short term trading, options trading, and futures trading areextremely risky undertakings. They generally are not appropriate forsomeone with limited capital, little or no trading experience, and/ or alow tolerance for risk. Never execute a trade unless you can afford toand are prepared to lose your entire investment. All trading operationsinvolve serious risks, and you can lose your entire investment. Notrades are recommendations or advice and we cannot be sued for lossesof capital. All trades are for educational purposes only. Contact yourbroker or RAI for execution, margin, and other capital requirements.Everyone watching presentation adheres to ALL disclaimers onwww.optionhacker.com and www.keeneonthemarket.com
Andrew Keene- Floor Trader @ CBOE 10 Years- Market Maker in Over 125 Stocks- Traded over 1 Million Equity Options and 40 MillionShares of Stock- Regular Contributor to CNBC,Bloomberg, Fox Business, BNN,and Fox Business
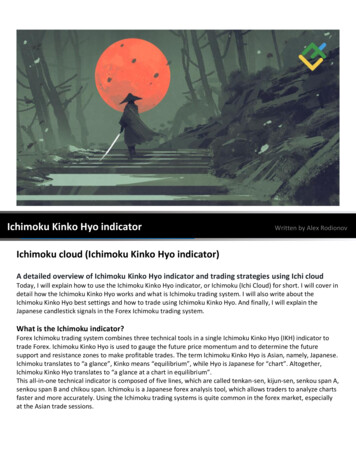
What is the Ichimoku Cloud?The Ichimoku cloud is a technical analysis method that uses the past,present, and future to help traders identify at a single glance if asecurity is in bullish or bearish territory.Ichimoku Kinko Hyo actually translates to “One Glance EquilibriumChart”The cloud is made up of 6 key components, each of which we willexamine individually. When combined, thesecomponents construct the Ichimoku Cloud.4
Trading Using the Ichimoku Cloud What is the Ichimoku Cloud? The different components of the cloud Using the cloud as levels of support and resistance The cloud and trend Using the cloud for options5
6
The 6 Components of the Ichimoku Cloud1. Tenkan-Sen Line2. Kinjun-Sen Line3. Senkou Span A Line4. Senkou Span B Line5. Kumo6. Chinkou Span Line7
Senkou Span ALineKumoTenkan-Sen LineChinkou Span LineSenkou Span B LineKinjun-SenLine8
Components of the CloudThe Tenkan-sen Line: Short Term Trend: Similar to 10 Period MA (highest high lowest low)/2 over the last 9 periodstenken-sen line9
Components of the CloudThe Kinjun-sen Line: Longer Term Trend: Similar to 30 DMA (highest high lowest low)/2 over the past 26 periodsKinjun-sen line10
Components of the CloudSenkou Span A: Future Short Term Trend (tenkan-sen kinjun-sen)/2 plotted 26 bars in the futureSenkou Span A11
Components of the CloudSenkou Span B: Future Long Term Trend: Fib 50% Retracement (highest high lowest low)/2 over the past 52 bars plotted 26 bars in the futureSenkou Span B12
Components of the CloudKumo “the cloud”: How Hard or Easy it is to Break the TrendKumo13
Components of the CloudChinkou Span Line: How does the Today’s Price compare to last Month current bar’s closing price plotted 26 bars backChinkou Span Line14
So Why Use the Cloud? The cloud is my favorite indicator because it is forward lookingunlike moving averages, fib levels or other popular technicalanalysis methods. The cloud takes into account more data than simple orexponential moving averages do. This gives us clearer levels of supportand resistance for setting profit targetsor stops. The cloud can be a tool to any tradertrading ANY plan on any product.15
The Cloud for All TradersThe cloud for the day trader: Using the cloud on a intraday basis can show a trader whereintraday levels of support and resistance are. A day trader can also use the cloud to find thehighest probability setups.The cloud for the swing trader: Using the cloud can help the swing trader avoid trading againsttrends and can help steer them away from stocks that are in neutral territory. Using the cloud canalso point them to stocks that are near breakout points.The cloud for the long term trader: Using cloud pullbacks can point out opportunities to enter oradd to positions. The long term trader can use the cloud to determine when it is time to exit aposition. Since the cloud is forward looking, the cloud can also give a heads up before trendmight turn the other way.16
Applications for the CloudTIME FRAME: The cloud will work best on different time scales depending on thesecurity. Faster time scales will produce more traps in some assets while providinggood signals in others.How fast is too fast?Stocks- The best signals come from the daily. Anything faster produces too many traps.Currencies and Currency Futures- Trades best on a 4 hour bar, anything faster thanthat will produce many traps.Crude Oil Futures- Trade very fast. Can actually be used with the cloud on a chart asfast as the 5 min.Treasury Futures- Treasury futures tend to trend well intraday.Day trading them with the cloud can be successful.17
Setups On Cloud Breaks We look trade stocks on the cloud using the 5 min bar during the day. Our favoritestocks to run this strategy in are FB, TWTR, AAPL, TSLA, and GPRO. On the opening 5 min bar we look for setups above or below the cloud. Here is todays setup in FB and TWTR on the following slides.18
Buying TWTR on the CloudBuying TWTR as a day trade when stock breaks the cloud to the upside on the 5 min bar.Stock goes from 40.92 to as high as 50.82 in the morning session hitting multiple targets.Trader would have put a stop below the cloud.EntryStop loss19
Using Measured Move TargetsHow to Use the Measured Move Targets:How do you develop price targets? Many use technical indicators like fiblevels or wave patterns but there is a much more accurate and efficientmethod for doing this.We can use the options market to calculate how much of a move themarket maker is pricing into the options.We use this by calculating the measured move target using the at themoney straddle
Long StraddleTrade: Long Call, Long Put, Same StrikeAdvantages: Unlimited profit potentialDisadvantages: Expensive premium longMax Risk: Premium paidMax Reward: UnlimitedBreakeven: Strike price ( /-) the total purchase price
Using Measured Move TargetsHow to Use the Measured Move Targets:Once we know the straddle price we can calculate targetsUpside target: Straddle price plus strike priceDownside target: Strike price minus straddle priceIn general the short the time to expiration the more accurate thesetargets are. A trader can use this method in any option product for anycatalyst event.
Using Measured Move TargetsHow to Use the Measured Move Targets:Example: I want to know the implied move in the SPY for this week:SPY is trading at 189.00 and the Oct 24th Weekly 189 Straddle is tradingat 3.65Upside target: 192.65Downside Target: 185.35Using the these targets rather than technically projected targets is muchmore accurate. Knowing them also helps a trader identify key levels. Thisis a trick employed by market makers all the time
Using Measured Move TargetsSetting up a Trade With Measured Move Targets:Trade: With targets of 192.65 and 185.35 I can setup a trade.Buying the SPY Oct 24th Weekly 190-193-196 Call Butterfly for 0.50Risk: 50 per 1 lotReward: 250 per 1 lotBreakeven: 190.50 and 195.50These targets are more accurate than fib levels, wave patterns or othertechnical analysis projections.
The Stages of a TraderMost traders go through stages in their career not everyone is successful immediately.Stage 1: This trader loses money. Unfortunately 90% of ALL retail traders lose money andhave an account life span of 3-18 months, they need to be educated by a PROFITABLETRADER.Traders that take the time to educate themselves have the best chance of making it out ofthis stage.
Nobody Starts Out as anexpertSource http://bit.ly/1CdlSIy
Every champion has had to work toget there, it doesn’t happenovernight.Source http://bit.ly/1w1Drt9
All 3 of these Super BowlQuarterbacks, started yearsOn the bench studying thePlaybook, defenses, andThe plan in order to get the mailgoal:“TO BE A CHAMPION”Source http://bit.ly/1yufdvY
The Stages of a TraderStage 2: A trader is not making some of the rookie mistakes that a beginner trader makesand is losing LESS money because they have found a coach they trust and get along withStage 3: A trader is now consistently profitable, they might not be making as much asthey'd like. You’ve made it to the playoffs but haven't won a CHAMPIONSHIP yet.
Michael Jordan won Rookie of the Year, wasaveraging 37 PPG in his third season, but didn'twin a championship for 7 years. Phil Jacksoncame and took him from a scorer to the bestchampion and player in the world ever.But how did they get there?Source http://bit.ly/1s9JhrI
Phil Jackson wasn’t the best basketballplayer, but he was a student of the game.He understand how other teams played,thought, and how to get the “MOST ofEVERY PLAYER.”Source http://bit.ly/1wt2Njq
The Stages of a TraderStage 4: This is the ultimate goal for most traders. Its rare for someone to get to thisstage. You consistently make money year over year. This is where I AMOne thing to remember This does not mean that these traders make money every day. I myself can have a losingday, week or month, but I know that in the long run I will be profitable.
SPECIAL AFTA PROMOTION:LIMITED TO FIRST 50 Traders !!Regular Price 797 8-10 Hour Ichimoku Course w/ 5 Set-ups: 199 10 Hour DVD of the Ichimoku Course: 199 Are You a Day Trader, Pullback, Aggressive, or SwingTrader Works for Stocks, Options, Futures, and Forex Best and Biggest Live Trading Room: 39975% OFF! 197http://keeneonthemarket.com/AFTA/
The Ichimoku cloud is a technical analysis method that uses the past, present, and future to help traders identify at a single glance if a security is in bullish or bearish territory. Ichimoku Kinko