Transcription
ichi fullcover final:Layout 124/1/0717:22Page 1An introduction to Ichimoku Kinko CloudsNicole ElliottCandlesticks charts, although originating in Japan, now play an important role in technicalanalysis worldwide. Now, for the first time in English, this book presents the next stage ofcandlestick analysis - Ichimoku Kinko Hyo. Sometimes called Cloud Charts, this analysis addsmoving averages to candlestick charts. But moving averages a little different from thosetraditionally used in the West. For trending markets, Cloud Charts add an essential tool foranalysing near-term areas of support and resistance.Ichimoku ChartsIchimoku ChartsThe book covers the history of candlestick charts - explaining the context in which theydeveloped. And then moves on to explain how in the 1930s a journalist, with the pseudonymIchimoku Sanjin, started refining candlestick analysis by adding a series of moving averages. Thebook explains in detail how to construct Cloud Charts and how to interpret them. A chapter isdevoted to the advanced analysis of Cloud Charts, with an in-depth study of the Three Principles:Wave Principle, Price Target and Timespan Principle. The book is illustrated throughout withnumerous examples of Cloud Chart analysis.Ichimoku ChartsWalk into any Japanese dealing room today and you will see that the most common charts beingused are Ichimoku Kinko Clouds. This book presents the definitive explanation of these chartsfor the first time to a Western audience.Nicole Elliottwww.harriman-house.com/ichimokuHh Harri man House Publ i shi ngNicole ElliottNicole Elliott is a graduate of the London School of Economics and a member of the Society ofTechnical Analysis. She has worked in the City of London for over 20 years. Whether in trading,sales or as an analyst within the treasury departments of major international banks, technicalanalysis has formed the backbone of her methodology. As Mizuho Corporate Bank’s senioranalyst in London she covers the foreign exchange, interest rate and commodity markets andequity indices.ISBN 9781897597842 24.99Hh Harriman TradingHhAn introduction toIchimoku Kinko CloudsNicole Elliott
Ichimoku ChartsAn Introduction toIchimoku Kinko CloudsBy Nicole Elliotti
HARRIMAN HOUSE LTD3A Penns RoadPetersfieldHampshireGU32 2EWGREAT BRITAINTel: 44 (0)1730 233870Fax: 44 (0)1730 233880Email: enquiries@harriman-house.comWebsite: www.harriman-house.comFirst published in Great Britain in 2007 by Harriman House.Copyright Harriman House LtdThe right of Nicole Elliott to be identified as the author has been assertedin accordance with the Copyright, Design and Patents Act 1988.ISBN 1-897-59784-3978-1-897597-84-2British Library Cataloguing in Publication DataA CIP catalogue record for this book can be obtained from the British Library.All rights reserved; no part of this publication may be reproduced, stored in a retrievalsystem, or transmitted in any form or by any means, electronic, mechanical,photocopying, recording, or otherwise without the prior written permission of thePublisher. This book may not be lent, resold, hired out or otherwise disposed of byway of trade in any form of binding or cover other than that in which it is publishedwithout the prior written consent of the Publisher.Printed and bound by Cambridge Printing, Shaftsbury Road, CambridgeIndex by Indexing Specialists (UK) Ltd.No responsibility for loss occasioned to any person or corporate body acting or refraining toact as a result of reading material in this book can be accepted by the Publisher, by theAuthor, or by the employer of the Author.Designated trademarks and brands are the property of their respective owners.Charts used with permission of Bloomberg LP and ReutersCopyright 2007 Reuters. Reprinted with permission from Reuters. Reuters content is the intellectual propertyof Reuters or its third party content providers. Any copying, republication or redistribution of Reuters contentis expressly prohibited without the prior written consent of Reuters. Reuters shall not be liable for any errorsor delays in content, or for any actions taken in reliance thereon. Reuters and the Reuters Sphere Logo areregistered trademarks of the Reuters group of companies around the world. For additional information aboutReuters content and services, please visit Reuters website at www.reuters.com
without Yuichiro Harada's help I would not have got this far
ContentsPrefaceIntroduction1 – HistoryEdo, candlesticks and Ichimoku Kinko HyoCalligraphyTerminology2 – Constructing the Cloud ChartsCandlesticks – the foundationCreating Ichimoku chartsDaily data and mid pricesMoving averagesDrawing the CloudChikou SpanExample – calculations for Ichimoku constructionSummaryixxi1367911141414202324263 – Interpretation of the Clouds274 – The Three Principles435 – Case Studies69Support/resistance levelsFinessing trading positionsCloud thicknessDistance between price and CloudClouds are for trending marketsChikou SpanExample 1: Dax IndexExample 2: Euro vs dollarWave PrinciplePrice TargetsTimespan PrincipleStudy 1: FTSE100 IndexStudy 2: Short Sterling interest rate futureStudy 3: CADUSDStudy 4: GoldStudy 5: USDYENStudy 6: Dow Jones Utilities Index2930303133343841455961727578808486v
Ichimoku Charts6 – Option Trading with CloudsCloud charts uniquely useful for options tradingBuying Option StrategiesWriting Option 131Constructing Candlestick ChartsCharting ProgramsMy Approach to Technical AnalysisMy daily routineRecommendationsTable of sample calculations for FTSE100Bibliographyvi115121121121125127129
Charts and FiguresFigure 2-1: FTSE 100 with moving averagesFigure 2-2: LME 3-month Copper with two moving averagesFigure 2-3: Euro/Sterling with two moving averagesFigure 2-4: Spot gold with projections for 9, 18, and 26 days ahead from an important lowFigure 2-5: FTSE 100 with moving averages and CloudsFigure 2-6: Singapore dollars per Canadian dollar with Senkou Spans A and BFigure 2-7: Yen per US dollar with Chikou Span15171819202223Figure 3-1: CBOT front month Corn futures contract with CloudsFigure 3-2: Cable (US dollars per pound Sterling) with CloudsFigure 3-3: Spot gold with CloudsFigure 3-4: S&P500 index with CloudsFigure 3-5: Yen per US dollar with Chikou SpanFigure 3-6: LME three-month forward Copper with Clouds and Chikou SpanFigure 3-7: CME Eurodollar interest rate future with Clouds and Chikou SpanFigure 3-8: German Dax 30 IndexFigure 3-9: Euro against the US dollar293032333436373841Figure 4-1: Consolidation patterns of the Wave PrincipleFigure 4-2: Wave variationsFigure 4-3: Thai Baht per US dollarFigure 4-4: Korean Won per US dollarFigure 4-5: Weekly S&P500Figure 4-6: Hungarian Forints per EuroFigure 4-7: Resistance becomes supportFigure 4-8: Example of Crude oil demonstrating resistance becoming supportFigure 4-9: Price targetsFigure 4-10: Inverted V wave patternFigure 4-11: N wave patternFigure 4-12: Kihon SuchiFigure 4-13: Head and shoulders patternFigure 4-14: CAC40 index with Time Principle days ahead plotted from aninterim low on the 28 OctoberFigure 4-15: Front month sugar futures contract New York Board of Trade464852535456575859626263656667vii
Ichimoku ChartsFigure 5-1: FTSE100 indexFigure 5-2: Short Sterling interest rate future (Euronext.liffe)Figure 5-3: Canadian dollars per US dollarFigure 5-4: Gold (weekly), for historical referenceFigure 5-5: Gold (daily)Figure 5-6: Yen per US dollar with Chikou SpanFigure 5-7: USDYEN (daily)Figure 5-8: Dow Jones Utilities Index (weekly)Figure 5-9: Dow Jones Utilities Index (daily)Figure 5-10: N wave and price target starting at point 972757880818384878890Figure 6-1: US dollars per Australian dollarFigure 6-2: Korean Won per US dollarFigure 6-3: US dollars per EuroFigure 6-4: US dollars per pound sterlingFigure 6-5: Japanese Yen per US dollarFigure 6-6: Canadian dollars per US dollarFigure 6-7: Swiss francs per EuroFigure 6-8: Singapore dollars per US dollarFigure 6-9: Swedish Krona per Norwegian KroneFigure 6-10: Hungarian Forints per Euro9899101102103105106108109110Figure A-1: Open and closeFigure A-2: Doji patternsFigure A-3: Spinning tops and bottomsFigures A-4 and A-5: Shooting star or hanging man, and a hammerFigure A-6: Bullish engulfingFigure A-7: Bearish engulfingFigure A-8: Dark cloud coverFigure A-9: Piercing patternFigure A-10: HaramiFigure A-11: Evening starFigure A-12: Morning starFigure A-13: Dec gold on COMEX115116116117117117118118118119119120viii
PrefaceWho this book is forThe book has been written for existing users of candlestick charts who want to extend theirknowledge and techniques to include Ichimoku Cloud charts. As such, some knowledge oftechnical analysis is assumed, especially a knowledge of candlesticks (although a brief primeron candlesticks is also included in the book’s appendix).What this book coversThe book covers the history of candlestick charts - explaining the context in which theydeveloped. It then moves on to explain how in the 1940s and 1950s a journalist, with thepseudonym Ichimoku Sanjin, started refining candlestick analysis by adding a series of movingaverages. The book explains in detail how to construct Cloud charts and how to interpret them.A chapter is devoted to the advanced analysis of Cloud charts, with an in-depth study of theThree Principles: Wave Principle, Price Target and Timespan Principle. The book is illustratedthroughout with numerous examples of Cloud chart analysis.How the book is structuredThe book comprises six main chapters:1. HistoryA brief history of candlesticks and the development of Ichimoku Kinko Hyo.2. Constructing the Cloud ChartsFirst, a quick introduction to candlestick charts - the foundation of Ichimoku - and then adetailed explanation of how Ichimoku charts are constructed.3. Interpretation of the CloudsHow to interpret the Cloud charts, including: identifying support and resistance levels; thesignificance of cloud thickness and the distance between price and cloud; and how to finessetrading positions.4. The Three PrinciplesA discussion of the three principles of Ichimoku charts: the Wave Principle, Price Targetsand the Timespan Principle.ix
Ichimoku Charts5. Case StudiesSeveral case studies are included that work through in detail the interpretation of Ichimokuchart examples.6. Option Trading with CloudsHow the unique combination of timing and price levels that is possible with Ichimokuanalysis is particularly relevant for option trading strategies.Supporting web siteThe web site supporting this book can be found at www.harriman-house.com/ichimoku.x
IntroductionA long time ago, and more years than I would care to admit to, I started my first City job as ajunior dealer at the then small Bank of Scotland. Working in the money market section, withwhat at that time were cutting edge interest rate futures, my two bosses (there were only threeof us) said:“You will be our expert on charts. All the futures dealers in Chicago use these, so off you goand learn.”And so I did. Later, armed with a pencil, graph paper, a couple of brief lessons under my beltand bare-faced cheek, I wormed my way in to the offices of the few jobbers and brokers whoknew about Technical Analysis.I immediately knew I had found my niche, and still today I often think my job is such fun.Everyday I have a jigsaw puzzle where I have all of the pieces, but there is no image to fit themto. You have to work the big picture out by yourself. It is also a little like dancing. Sometimesit is pure hard slog: tiring, tedious, repetitive, constant discipline, and my partner has two leftfeet. Then the other times (which more than make up for everything else) it’s truly fantastic,intuitive, creative, and I have Fred Astaire to lead me round the dance floor.Over the years the pencil and paper were replaced with computer programs. Then one day Inoticed a new technical study had been added to the vast array I already had to choose from.Called Ichimoku Kinko Hyo, I had never heard of it, despite having practised as a full-timeTechnical Analyst for almost twenty years. My initial reaction was one of shock-horror, whenI looked at a chart and saw something that looked like a writhing mass of knotted, multicoloured noodles.I left the noodles alone for a while; but then ten years ago I went to work for a Japanese bank,and recognised the charts many of my Japanese colleagues were using: Spaghetti Junction!Curiosity got the better of me and - at the risk of losing my street cred as sole full-time chartistin a very macho dealing room - I asked them what these were.“Oh, Cloud charts,” they said. “We all use them.”They did, and still do. And now I do too.When the markets were quiet, I asked our very busy Dollar/Yen dealer, Harada-san, if he couldexplain them to me. Slowly (as he was very busy), and despite some language problems, Ibegan to understand. Setting them up on my files, I started to use them every day. Questionsarose as I went along, which then allowed me to progress to the next level with hisexplanations.xi
Ichimoku ChartsI now realise how much I owe Harada-san, because all the books on the subject are in Japaneseand, quite frankly, I am too old to start learning a language in order to learn a new chartingmethod.This book distils what I’ve learnt about Ichimoku Kinko Hyo over the last few years of workingin a Japanese dealing room. I like the method and now use it every day - because it works. Ihope you too find the Clouds fascinating and profitable.xii
1History
Chapter 1 – HistoryIn this short chapter I thought it would be interesting to briefly describe the political andeconomic background that prevailed at the time that candlesticks were first thought of, and howIchimoku Cloud charts evolved from these. The chapter ends with a calligraphic diversion thatanalyses the Chinese characters for Ichimoku Kinko Hyo.Edo, candlesticks and Ichimoku Kinko HyoPolitical and economic backgroundThe use of charting increased as Japan emerged from a feudal period of constant war, wherethe emperor in Kyoto and his military deputy, the shogun, had lost all control (1500 to 1600).A process of unification began, known as the Edo period, which lasted from 1600 until theMeiji Restoration in 1868. During this time, Japan was cut off from the outside world anddeveloped a highly individual society and set of values. Missionaries were expelled in 1587,and in 1633 a decree was passed prohibiting Japanese from trading with foreigners or livingabroad. These measures reinforced the power of central government. Many see this as a timewhen every aspect of life was uniquely Japanese.One of the generals responsible for restoring order in Japan at the beginning of the Edo periodwas Tokugawa Ieyasu. He took the title of shogun in 1603 and his family went on to rule until1868. He governed from Edo (now called Tokyo) and his government, known as the bakufu,administered his lands. The bakufu oversaw the samurai officials, who in turn were responsiblefor collecting taxes and maintaining order. He realised that the key to holding on to power wasseparating out roles and legitimising landholdings in order to assess crop yields.The nobility were isolated from politics in Kyoto and had little contact with the outside world,devoting themselves to scholarship, classical culture and religion. Far-flung provinces wereallowed to keep their feudal lords, the daimyo. To keep a close eye on the daimyo they wereexpected to spend half the year in Edo, at their own considerable expense - swelling thepopulation of the city to one million by 1700 and making it one of the largest cities in theworld.After careful surveys all land was recorded and assessed for crop yields. This was the basis oftaxation and was measured as to how many koku of rice it would yield (one koku being aboutfive bushels). Peasants paid 40% to the governing bodies, usually in rice but later also in cash.Their weapons had been confiscated in 1588, so their role was completely different from thatof the samurais. Land under cultivation doubled in this period and yields increased significantlywith better tools and the pooling of resources. Clustering around castles, craftsmen andmerchants supplied the goods and services needed by peasants, warriors and government3
Ichimoku Chartsofficials. Known as chonin, meaning townspeople, they formed the basis of an increasinglyimportant class and were what we would call merchants.The bakufu supervised land routes, primarily for military purposes, but these were notespecially suitable for transporting goods. Sea routes and rivers were successfully adopted asan alternative, the route between the northeast and Osaka being especially busy as it linked themajor cities. Increased stability also meant that local markets declined in importance ascentralized government gained control. Trade between regions grew steadily with Osakadominating finance and commerce. It had large warehouses in which raw materials were stored,which in turn allowed for the stabilization of the prices of goods.The Dojima Rice Exchange, set up in the late 1600s, was the first of its kind and by 1710 wastrading in warehouse receipts as well as the physical commodity. Rice coupons, a precursor tofutures contracts, could be re-sold and when the coinage became debased were the mostaccepted and useful medium of exchange.At about this time the merchants became especially powerful because the samurai and lordswere deeply indebted to them. Luxurious city living and long periods away from home hadtaken their toll. By 1800, merchants were able to marry into the feudal and political classes(which previously had been prohibited), resulting in them wielding greater political power.In this climate of change, villages in the country began to suffer from peasant revolts, becauseof the deteriorating economic situation and as a protest against the class divide. Inflation wasa persistent problem, exacerbating difficult policy choices, so that in 1859 the bakufu wereforced to open up ports to foreigners. A few years later, in 1868, Tokugawa power ended andimperial rule was restored.CandlesticksThe man widely credited with perfecting candlesticks, and making a fortune in the process, wasMunehisa Homma (1724-1803), who lived in the Edo period described above. Nicknamed‘Sakata’, because he first worked at Shonai Sakata - a commercial town in northern Japan - hewas the youngest son who, unusually, took over the family trading business, before moving toEdo (Tokyo).Sakata postulated five rules for successful trading. Using carefully chosen alliterative words,he used the prefix of ‘san’ meaning three, which for the Japanese is a sort of ‘magical’ number(like lucky 7 or unlucky 13 to some Westerners). The number three is believed to mark the startor turning point of a series of events. Sakata’s five rules are:4
Chapter 1 – History1. Sanzan - three mountains,2. Sanpei - three soldiers,3. Sansen - three rivers,4. Sankoo - three spaces, and5. Sanpo - three laws.Using these rules he aimed and managed to separate out ‘value’ from the ‘price’ of ricecontracts - the fear and the greed of his counterparties, supply and demand. Using his methods,Sakata was rumoured to have had the longest ever winning streak of 100 consecutive profitabletrades.Some say that because of all the upheaval during its evolution, and the dominant role of thearmy, many candlestick patterns have military connotations. However, ‘three white/blacksoldiers’ is the only one that immediately springs to my mind. Many of the others are just aslikely to be linked with stars, animals or people. Some, like ‘Doji’ (which means‘simultaneously’), convey whether buyers or sellers are the dominant force (neither in the caseof a doji candlestick).We can note, in passing, that the evolution in Japan of price charts in the 17th century, andcandlesticks in the 18th century, easily pre-dates the first American bar charts of the 1880s.Ichimoku Kinko – a refinement of candlesticksMoving swiftly on to just before the outbreak of World War II, a journalist called GoichiHosoda started adapting and refining candlestick analysis by adding a series of movingaverages. He used the pseudonym ‘Ichimoku Sanjin’, where the first Chinese character of hisname means ‘at a glance’. The other characters mean ‘of a man standing on a mountain’,harking back to Homma’s three mountains, but also to give a sense of the perspective andclarity this type of charting brings. Starting in the 1940s he analysed share prices and eventuallypublished a book outlining his method in 1968 - after forcing many students to crunchthousands of numbers for him. This was, of course, before the advent of affordable computers,so it was a very laborious process. I believe that the use of pseudonyms has been common inJapan for a great many years. Perhaps this is why my esteemed colleague, Harada-san, washappy with his nickname ‘Richie’ (as in Richie Rich with the glasses). The famous artistHokusai changed his pseudonym up to 36 times, possibly each time he changed the style ofhis work but maybe just to match his mood.More recently, the method was revived by Hidenobu Sasaki of Nikko Citigroup Securities,who published Ichimoku Kinko Studies in 1996. Now in its 18th edition, this is the book most5
Ichimoku ChartsJapanese use, and has been voted the best technical analysis book in the Nikkei newspaper for9 consecutive years.Be aware that candlesticks are not the only charts used in Japan. As well as acknowledgingWestern methods, my Japanese colleagues are equally happy using Renko, Three-Line-Breakcharts and Kagi charts. As many charting packages do not offer these, they are religiouslydrawn by hand every day. This is really for purists and those who only follow one or two maininstruments. Being so laborious it does not lend itself to cross-market analysis. However, walkinto any Japanese dealing room today and the most common charts you’ll see will be IchimokuKinko Clouds.CalligraphyThe Chinese character for ‘bar charts’comes from the word ‘foot’, alluding to the idea that markets leave footprints, which can thenbe followed, read and interpreted.In Japan three alphabets are used for writing. Kanji, the most ancient script, was introduced inthe 5th century from China via Korea. In kanji each little pattern sums up an entire concept andcorresponds to a word. Hence, the patterns are ideograms and are what are known as ‘Chinesecharacters’.Two other scripts were developed in 9th century Japan and are the first truly Japanese writing.They are phonetic and have 46 syllables of which 5 are vowels. Hiragana is more cursive,while Katakana is more angular and mainly used for foreign words.All three scripts are either written across the page from left to right, or vertically from top tobottom and right to left. Japanese newspapers are read ‘back to front’.Back to the Chinese character for ‘bar chart’, known as ‘Hyo’. Look at this next set ofcharacters-6
Chapter 1 – HistoryOnce again you can see the one for ‘chart’ at the end on the right. The second character, theone that looks like a ladder means ‘look’ and, together with the first one, resembling a minussign, stand for ‘at one glance’. (It is not really a ladder, but the picture of an eyeball turned onits side - you need a little imagination here!) The others are too complicated to be worth goinginto, but character three spells out ‘Kinko’ meaning ‘balance’.TerminologyThe correct name of these charts is: Ichimoku Kinko Hyo. But this is something of a mouthful,so the charts are often referred to as Ichimoku charts or Cloud charts. Occasionally one mightcome across Ichimoku Kinko Clouds, which again is the same thing. All these terms are usedinterchangeably in this book.7
2Constructing the Cloud Charts
Chapter 2 – Constructing the Cloud ChartsCandlesticks – the foundationThe first thing to plot on your graph are candlesticks. If you’re already familiar withcandlesticks, then you might like to skip this section. (There’s a brief primer on candlesticksin the appendix.)Candlesticks are similar to Western bar charts: the highest price of the period is plotted, thelowest, the opening price and the close for that period.While bar charts have tiny little horizontal marks either side of the vertical bar to denote theopen and close (and sometimes just the close), candles make the most of these two pieces ofdata. They are drawn as a fat bit either side of the bar and known as the real body. So, you havea thin vertical line joining the high and the low. Either side of this you have a fatter columnjoining the opening and the closing prices. This column is coloured (black or any other colouryou choose) if the market closes lower than it opened, or left blank if it closes higher.With the candles we watch for reversal patterns, which I find are usually much clearer thanthose on bar charts. Some of these have lovely names too, like Shooting or Evening Star, ThreeBlack Crows, Spinning Top and Fry Pan Bottom, Abandoned Baby, and my favourite, HangingMan!It is only a small step from bars to candlesticks, but the difference is dramatic. Having startedand worked with bar charts, the moment I switched to candles I wished I had done it yearsearlier as I was able to see the key points and interpret market action so much more quickly.This is very important to me because every morning I have to look at hundreds of charts andspeed is of the essence.(See diagrams below and the appendix for candlestick patterns.)A day in the life of a candleAssume the instrument you are studying started the day at 100.00, the same price as it closedthe previous evening. The candle would look as follows:Just a small horizontal line.11
Ichimoku ChartsThroughout the morning the market rallied to 105.00, therefore the candle would now look likethis:After lunch prices declined back down to where they had started, giving up all the morning’sgains, and our candle would now look like this.I think you will agree that the message is now very different (a ‘gravestone doji’) to what ithad been when we happily skipped off to get some food.Note that some civilized markets, like the Tokyo Stock Exchange, still stop for lunch. Someanalysts plot the am and pm sessions separately making for two candles per day’s worth ofprice action. This of course creates mayhem with moving averages and other oscillators, butit is then easy to look back on each block. I also use intraday candles for certain instrumentsand time horizons. I often use four-hourly ones as they keep the detail of how the marketdeveloped over the day without clogging up the screen with too much sideways work.The following day our market may gap lower to 95.00, so our candles now look like so:12
Chapter 2 – Constructing the Cloud ChartsThen steadily and slowly throughout the whole of the next day prices climb and close at 105.00,making the two-day combination end like this:Not nearly as bearish now.What I am trying to stress here is that only at the close of the day/period can we be confidentwhether we have formed an important chart pattern or whether it has all been noise, even ifprice action is fairly extreme. This may be obvious at the moment, but I urge you to rememberthis when working with weekly and monthly candles. It is so easy to focus on the very latestprice action, forgetting that it all may come unravelled by the close.13
Ichimoku ChartsCreating Ichimoku chartsDaily data and mid pricesDaily data is the standard frequencyAlthough traditional candle theory looks at hourly, daily, weekly or monthly charts, just as wedo with bar charts, with Ichimoku charts only daily charts are used. Having said that, somechartists bend the rules and use monthly, weekly or hourly units of time – the lesson being:never be afraid to experiment.The fact that daily candlesticks are used means that the system is for medium to long termstrategies, and is therefore not suitable for jobbers and day traders.Mid-point prices usedWe now start moving into new territory! Ichimoku charts differ from Western ones in that theyare not drawn using daily closing prices. Instead, ‘mid-prices’ are used. This method takes theaverage of the high and low price of the day (simply adding the high and low price and dividingby two). The mid-price calculation is not adjusted for volume.This is a good method for markets where there is an arbitrary cut-off time, such as FX whichis a global 24 hour market, or for small markets that are subject to manipulation at settlementtime.Moving averagesCandlesticks with moving averagesOnce the daily candles are drawn, the next thing to do is add two moving averages. These areused in the same way as we do in the West, with crossovers giving buy or sell signals. Whenthe short term average is above the longer term one, the trend is to higher prices; when the shortterm average drops below the longer one, that is a sell signal. A position is held until thesereverse.14
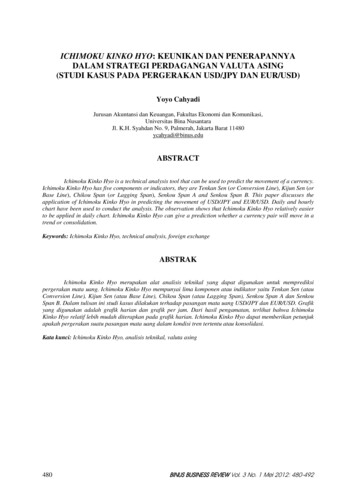
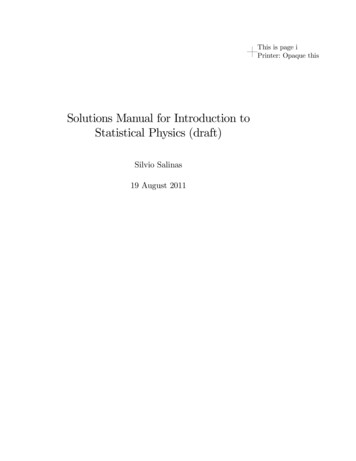
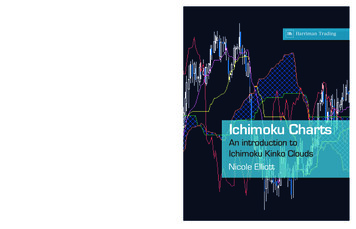
Chapter 2 – Constructing the Cloud ChartsFigure 2-1: FTSE 100 with moving averages.F TS E, L as t T ra d e [C an d le ][ M A 9][M A 2 6] Da ily23 A ug05 - 16 D ec0513 D ec05 5501 .5 5 5 27. 2 549 9 .2 5513 .1PrG Bp5560.FTS E , C lose (Las t T ra d e) , M A 95540.FTS E , L a st T rade , C andle13 D ec05 5517 .35520.FTS E , C lose (Las t T ra d e) , M A 26550013 D ec05 5489 5220520051805160514029 A ug0505 S ep12 S epCHARTCOMMENT19 S ep26 S ep03 O c t10 O c t17 O c t24 O c t31 O c t07 N ov14 N ov21 N ov28 N ov05 D ec12 D ecSource: Reuters5240Based purely on moving average crossovers, one would currently belong since early November.For Ichimoku charts we use two specific moving averages which are:1. Tenkan-sen (“Conversion Line”): is a nine-day moving average, and2. Kijun-sen (“Base Line”): is a twenty six-day moving average.As usual, the shorter moving average whips around the longer one, giving points at whichpo
Ichimoku Sanjin, started refining candlestick analysis by adding a series of moving averages. The book explains in detail how to construct Cloud Charts and how to interpret them. A chapter is devoted to the advanced analysis of Cloud Charts, with an in-depth study of the Three Princip