Transcription
ICHIMOKU 101“Learn how to read ANY INSTRUMENT, ANY TIMEFRAME within 3 seconds”Copyright E.I.I. Capital Inc.www.ichimokutrade.cominfo@eiicapital.com
DISCLAIMERCommodity Futures Trading Commission, Forex, Futures, Equity and options trading has large potential rewards, butalso large potential risk. You must be aware of the risks and be willing to accept them in order to invest in thesemarkets. Do not trade with money you cannot afford to lose. This is neither a solicitation nor an offer to Buy/Sell. Norepresentation is being made that any account will or is likely to achieve profits or losses similar to those discussed onthis document. The past performance of any trading system or methodology is not necessarily indicative of futureresults.This is for educational use only. All materials and information is owned by E.I.I. Capital Group. The material andinformation cannot be copied and/or distributed to anyone without the permission of E.I.I. Capital.Copyright E.I.I. Capital Inc.www.ichimokutrade.cominfo@eiicapital.com
Table of ContentsTable of Contents . 3Quick Description . 4History. 4Equilibrium at a Glance . 4Ichimoku Components . 5Ichimoku Settings . 6Tenkan Sen.7Kijun Sen .8Chikou Span .10Senkou Span B .12The Kumo Cloud.13The basics.13A Better Measure of Support and Resistance .13Price's Relationship to the Kumo .14Kumo Depth .14Kumo depth or thickness is a function of price volatility .15Kumo Sentiment .15Flat Top/Bottom Kumos .16Trend trading. 17Ichimoku Kinko Hyo and Trend Trading. 17Ichimoku Strategies . 18Tenkan Sen/Kijun Sen Cross .18Kijun Sen Cross .21Kumo Breakout .24Senkou Span Cross .26Chikou Span Cross .29Other Resources . 32Websites: .32Books: .32Copyright E.I.I. Capital Inc.www.ichimokutrade.cominfo@eiicapital.com
Quick DescriptionIchimoku Kinko Hyo is a purpose-built trend trading charting system that has been successfully used in nearly everytradable market. It is unique in many ways, but its primary strength is its use of multiple data points to give the tradera deeper, more comprehensive view into price action. This deeper view, and the fact that Ichimoku is a very visualsystem, enables the trader to quickly discern and filter "at a glance" the low-probability trading setups from those ofhigher probability.HistoryThe charting system of Ichimoku Kinko Hyo was developed by a Japanese newspaper man named Goichi Hosoda. Hebegan developing this system before World War II with the help of numerous students that he hired to run through theoptimum formulas and scenarios - analogous to how we would use computer simulated back testing today to test atrading system. The system itself was finally released to the public in 1968, after more than twenty years of testing,when Mr. Hosoda published his book which included the final version of the system.Ichimoku Kinko Hyo has been used extensively in Asian trading rooms since Hosoda published his book and has beenused successfully to trade currencies, commodities, futures, and stocks. Even with such wild popularity in Asia,Ichimoku did not make its appearance in the West until the 1990s and then, due to the utter lack of information inEnglish on how to use it, it was mostly relegated to the category of another "exotic" indicator by the general tradingpublic. Only now, in the early 21st century, are western traders really beginning to understand the power of thischarting system.Equilibrium at a GlanceThe name Ichimoku Kinko Hyo, which translates to "Equilibrium chart at a glance" aptly, describes the system andhow it is to be used, as described below:While Ichimoku utilizes five separate lines or components, they are not to be used individually, in isolation, whenmaking trading decisions, but rather used together to form an integrated "whole" picture of price action that can begleaned "at a glance". Thus, a simple look at an Ichimoku chart should provide the Ichimoku practitioner with a nearlyimmediate understanding of sentiment, momentum and strength of trend.Price action is constantly measured or gauged from the perspective of whether it is in relative equilibrium ordisequilibrium. Hosada strongly believed that the market was a direct reflection of human group dynamics orbehavior. He felt that human behavior could be described in terms of a constant cyclical movement both away fromand back towards equilibrium in their lives and interactions. Each of the five components that make up Ichimokuprovide its own reflection of this equilibrium or balance.Copyright E.I.I. Capital Inc.www.ichimokutrade.cominfo@eiicapital.com
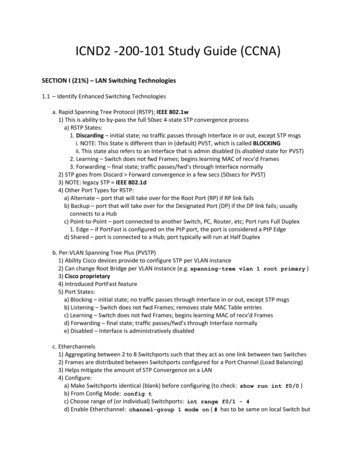
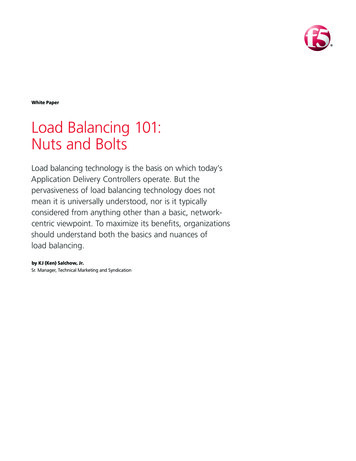
Ichimoku ComponentsThe Ichimoku chart is composed of five separate indicator lines. These lines work together to form the complete"Ichimoku picture". A summary of how each line is calculated is outlined below:Japanese NameTENKAN SENKIJUN SENEnglish Nameturning linestandard lineFormula(HIGHEST HIGH LOWEST LOW)/2 for the past 9 periods(HIGHEST HIGH LOWEST LOW)/2 for the past 26 periodsCHIKOU SPANlagging lineSENKOU SPAN A1st leading lineCURRENT CLOSING PRICE time-shifted backwards (into the past) 26periods(TENKAN SEN KIJUN SEN)/2 time-shifted forwards (into the future)26 periodsSENKOU SPAN B2nd leading line(HIGHEST HIGH LOWEST LOW)/2 for the past 52 periods timeshifted forwards (into the future) 26 periodsThe Senkou span A and B deserve special mention here as they, together, form the Ichimoku “kumo” or cloud. Wecover the kumo and its myriad functions in more detail in the kumo section”.The chart below (FIGURE 1) provides a visual representation of each of these five components:FIGURE 1 - Ichimoku ComponentsCopyright E.I.I. Capital Inc.www.ichimokutrade.cominfo@eiicapital.com
Ichimoku SettingsAs you can see in the Ichimoku Components section above, each line calculation has one and sometimes two differentsettings based on the number of periods considered. After much research and back testing, Goichi Hosoda finallydetermined that the settings of 9, 26 and 52 were the ideal settings for obtaining optimum results with Ichimoku. Hederived the number 26 from what was then the standard Japanese business month (which included Saturdays). Thenumber 9 represents a week and a half and the number 52 represents two months.The standard settings for an Ichimoku Kinko Hyo chart are 9, 26, 52.There is some debate around whether or not these settings of 9, 26, 52 are still valid given that the standard workmonth in the West does not include Saturdays. In addition, in non-centralized markets that do not keep standardbusiness hours like the Forex (which trades around the clock), some have posited that there may be more appropriatesettings. Nevertheless, EII Capital, as well as most other professional Ichimoku traders, agree that the standard settingsof 9, 26, 52 work extremely well and do not need to be altered.The argument could be made that, since Ichimoku Kinko Hyo functions as a finely-tuned, integrated whole, changingthe settings to something other than the standard could throw the system out of balance and introduce invalid signals.Copyright E.I.I. Capital Inc.www.ichimokutrade.cominfo@eiicapital.com
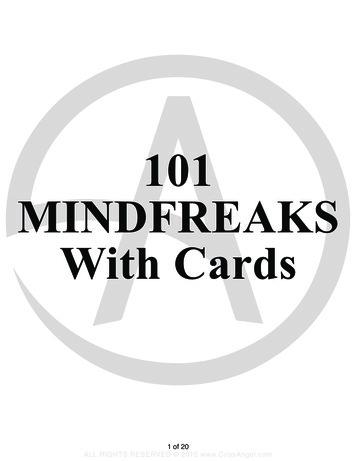
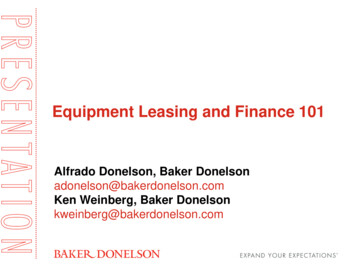
Tenkan SenThe Tenkan Sen, as mentioned, is calculated in the following manner:(HIGHEST HIGH LOWEST LOW)/2 for the past 9 periodsWhile many may compare the tenkan sen to a 9 period simple moving average (SMA), it is quite different in the sensethat it measures the average of price's highest high and lowest low for the last 9 periods. Hosoda believed that usingthe average of price extremes over a given period of time was a better measure of equilibrium than merely using anaverage of the closing price. This study of the tenkan sen will provide us with our first foray into the key aspect ofequilibrium that is so prevalent in the Ichimoku Kinko Hyo charting system.Consider the chart in Figure 1 below:FIGURE 1 - Tenkan Sen vs. 9 Period SMAAs can be seen in the chart, the tenkan sen often exhibits "flattening" whereas the 9 period SMA does not. This is dueto the fact that the tenkan sen uses the average of the highest high and lowest low rather than an average of the closingprice. Thus, during periods of price ranging, the tenkan sen will clearly show the midpoint of the range via its flataspect.When the tenkan sen is flat, it essentially indicates a trendless condition over the last 9 periods.It can also be seen how the tenkan sen provides a much more accurate level of price support than does the 9 periodSMA. With only one exception, price action stayed above the tenkan sen in the three highlighted areas of the chart,while price broke below the SMA numerous times. This is due to the more conservative manner in which the tenkansen is calculated, which makes it less reactive to small movements in price. On a bearish chart, the tenkan sen willlikewise act as a level of resistance.The angle of the tenkan sen can also give us an idea of the relative momentum of price movements over the last 9periods. A steeply angled tenkan sen will indicate a nearly vertical price rise over a short period of time or strongmomentum, whereas a flatter tenkan sen will indicate lower momentum or no momentum over that same time period.The tenkan sen and the kijun sen both measure the shorter-term trend. Of the two, the tenkan sen is the "fastest" giventhat it measures trend over the past 9 periods as opposed to the kijun sen's 26 periods. Thus, given the very short termnature of the tenkan sen, it is not as reliable an indicator of trend as many other components of Ichimoku.Nevertheless, price breaching the tenkan sen can give an early indication of a trend change, though, like all Ichimokusignals, this should be confirmed by the other Ichimoku components before making any tradi
trading system. The system itself was finally released to the public in 1968, after more than twenty years of testing, when Mr. Hosoda published his book which included the final version of the system. Ichimoku Kinko Hyo has been used extensively in Asian trading rooms since Hosoda published his