Transcription
My 15min per dayIchimoku StrategyThe Complete Guidetradingtools.net
My 15 min per Day Ichimoku Trading StrategyTable Of ContentsA Trading Strategy that has Proved Consistent for me2Which market for this Ichimoku strategy ?3What market conditions are we looking for ?3What indicators will you need ?5The Ichimoku cloud and Kijun Sen5A 21 period Exponential Moving Average (21 EMA)8The RSI set to 7 periods10Bill Williams Fractals11What are the entry rules?14Long trade entry14Short trade entry15Where should you put your stop-loss ?16How to manage your trade and where to exit?16Risk management for this Ichimoku Strategy16What Forex Pairs can you trade with this IchimokuStrategy?17All you need is 15min per day: trade with a day job17One last thing, a fantastic Ichimoku book18Download a PDF of My 15 Min per Day Ichimoku Strategy18Video : My 15 Min per Day Ichimoku Strategy19Further reading19Provided by tradingtools.netPage 1
My 15 min per Day Ichimoku Trading StrategyA Trading Strategy that has Proved Consistentfor meAre you looking for a simple 15min per day Trading Strategy?I’m going to share with you my simplified Ichimoku trading strategy. A system that has beenquite successful for me over time.It is inspired by Vince Vora, a trader that’s part of the team at Tradingwins.com.I have used the basics of his system and customized it to add a few features. That way I’ve madeit more precise and useful to me.The system relies mostly on the Ichimoku Kinko Hyo system. But it’s stripped down version of itand has a few add-ons.It is a simple system based on a few indicators that will tell you in a second whether you have atrade setup or not.It can be traded with an extremely low risk level, I personally use a 1,5% risk on individualtrades.I’m assuming here that you are already familiar with Forex and Forex trading. I will not teach youto trade Forex.If you’re a beginner and need advice on how to start trading, you can read my Definitive Guideon How to Start Trading.Now, let me take you through the characteristics of this system, which is basically a momentumcatching Ichimoku strategy.To trade this strategy easily, I recommend you setup your charts on the free trading platform atTradingView, by far the best charting platform.Provided by tradingtools.netPage 2
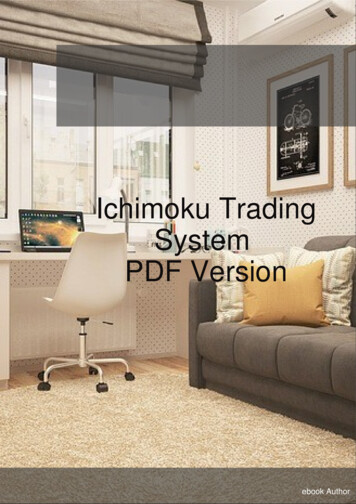
My 15 min per Day Ichimoku Trading StrategyWhich market for this Ichimoku strategy ?This system works on any market, any timeframe. I use it to trade forex on the H4. But you canuse it to trade stocks, cryptos, indexes,etc.Due to my day job, I can’t afford to watch the market more than twice a day. Once early in themorning (around 7-8 AM GMT) and in the evenings (around 9-10 PM GMT).For that kind of trading, the H4 is ideal. It will give you a reasonable volume of trades and a goodgrip on the momentum moves without forcing you to keep a constant eye on your trades.What market conditions are we looking for ?Since this strategy aims at catching trending moves, we are looking for clean charts. We want toavoid cluttered pairs where volatility is high with unclear price directions, violent swings orspikes.Two examples of what I mean below:Clean chart, clear trendProvided by tradingtools.netPage 3
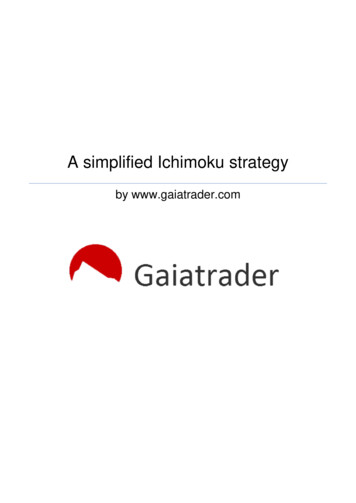
My 15 min per Day Ichimoku Trading StrategyCluttered chart, high volatility, spikes, swingsWhat indicators will you need ?The system uses five indicators. That might seem like a lot, but they all have a purpose. In fact,they are a tremendous visual aid for reading graphs and to me they make things much simpler.The Ichimoku cloud and Kijun SenThe Ichimoku Kinko Hyo system is a very elaborate but simple system. It was devised by aJapanese journalist named Goichi Hosoda in the late 1930s. He released it to the general public inthe late 1960s after 30 years of testing and improvement.It is a very complete system giving an instant view of market conditions. The system providesentries, exits, support and resistance levels and key past and future market levels.Literally, Ichimoku Kinko Hyo translates as “one glance equilibrium chart”.The original system consists of five lines named Tenkan-Sen, Kijun-Sen, Senkou Span A, SenkouSpan B and the Chikou Span. The Ichimoku cloud is the area between the Senkou Span A andSenkou Span B, it is usually coloured.Provided by tradingtools.netPage 4
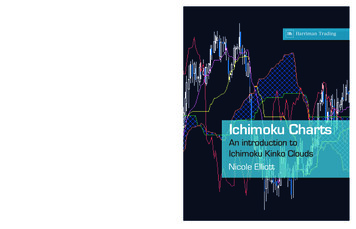
My 15 min per Day Ichimoku Trading StrategyBelow is a representation of the system and the five lines that compose it (we only use three ofthem):The Ichimoku system is a moving average based trade identification system. It is quite elaborateand novice traders might find it difficult to read.However, in our trading system we are only using two of the core components. The Kumo cloudand the Kijun Sen. Why these two ? Because the information they provide is sufficient for thekind of market conditions we want to identify.The Kumo cloud is the area between Senkou Span A (SSA) and Senkou Span B (SSB). Here arethe formulas :SSA (Tenkan Sen Kijun Sen) / 2 plotted 26 periods aheadSSB (highest high lowest low) / 2 calculated over the past 52 periods and plotted 26periods aheadThe Kijun SenProvided by tradingtools.netPage 5
My 15 min per Day Ichimoku Trading StrategyThe kijun Sen is defined as:Kijun Sen (highest high lowest low) / 2 for the past 26 periodsAnd for reference only (because we do not use them) the other lines are defined as:Tenkan Sen (highest high lowest low) / 2 for the last 9 periodsChikou Span today’s closing price projected 26 periods back on the graphWhat will the Ichimoku indicator tell us?Basically, what the cloud and Kijun Sen will tell us is the following:Kumo Cloud: when price is above the cloud we have an uptrend (we only trade long). Whenit is below the cloud we have a downtrend (we only trade short). And when price is insidethe cloud we have a neutral situation (no trade). The projected portion of the cloud can alsobe used as an indication of future market conditions. The height of the cloud is arepresentation of volatility. So a thinner cloud would indicate lower volatility, and a thickercloud will represent stronger areas of support and resistance. The SSB is the stronger of thetwo lines and will generally form solid S/R levels. Markets are said to be bullish when SSAis above SSB, and bearish when SSA is below SSB. A crossing of SSA and SSB lines(usually triggering a change in the cloud color) is called a Kumo twist. It can be a sign ofpotential trend inversion.Kijun Sen: this line is used as a confirmation line and can be used as support or resistance. Itis one the system’s stronger lines and usually a good indicator of future price movement. Itsslope is particularly important. We use it both as a confirmation of the trend and as apotential trigger for exits being a representation of significant support or resistance lines.A 21 period Exponential Moving Average (21 EMA)Moving averages are the single most used indicator in trading. However, they do not predictfuture price movement, they just represent the current direction of a trend.Provided by tradingtools.netPage 6
My 15 min per Day Ichimoku Trading StrategyThere are many different forms of moving averages: simple (SMA), exponential (EMA),weighted (WMA) ). In this case, we use the 21 period EMA.Exponential moving averages reduce the lag by giving more weight to recent prices. That’s why Iprefer it to SMA. It also tends to be one of the most widely used moving averages. So it’s a kindof a self-fulfilling prophecy. A lot of traders are always going to react around it.In this system, the 21 EMA is used to confirm a trend. I’ll be looking for strong slopes asindicators of strong up or down trends.Good slopeWeak slope (no trade)Provided by tradingtools.netPage 7
My 15 min per Day Ichimoku Trading StrategyThe RSI set to 7 periodsThe RSI is the Relative Strength Index. It was created by Welles Wilder in 1978. It isan oscillator type indicator that moves up and down on a scale from 0 to 100. The RSI identifiesthe speed and change of price movements.The formula to calculate the RSI is the following: RSI 100 – [100 / (1 RS)] where RS is theRelative Strength average gain / average lossIn the standard setting of the RSI, the average gains (loss) are calculated by adding all the gains(losses) for the past 14 periods.I use it with a setting of 7 periods in order to trade quite a short cycle. Occasionally I will set theRSI to 4 periods if I want to make sure I detect an earlier signal. That might add a little risk butit’s fine.The RSI has the following index thresholds:A reading of 30 or under is considered “oversold” and identifies potential price increase70 or above is “overbought” and identifies a potential price decrease50 is considered neutral, and crossing that mark is usually the indication that a trend isforming. In my system, I use the bounce on the 50 mark as a confirmation that a trend isresuming (see below)Provided by tradingtools.netPage 8
My 15 min per Day Ichimoku Trading StrategyBill Williams FractalsFractals were developed by Bill Williams as part of a system that he created mixing the ChaosTheory with Human Psychology. Taken alone, fractals are indicators that actually break largertrends into smaller and simple reversal patterns. A fractal is composed of five or more bars, andthere are two types of fractals:FractalsUp fractals: a bullish turning point occurs when there is a pattern with the lowest low in themiddle and two higher lows on each sideDown fractal: a bearish turning point occurs when there is a pattern with the highest high inthe middle and two lower highs on each sideThe fractals are turning points. I‘ll use them for stop loss placements (initial and trailing). In along trade, I’ll place my stop at the most recent red fractal. In a short trade I’ll place my stop lossat the most recent green fractal (see further down stop placement).Provided by tradingtools.netPage 9
My 15 min per Day Ichimoku Trading StrategyWhat are the entry rules?Now that I’ve gone over the indicators and timeframe, let’s take a look at the entry rules. Simpleand easy to remember, they make the system very straightforward because 99% rule-based. A bitof trader discretion will always be necessary in any system:-)The first thing you should do is check that no major market announcement is on the docket for thepair you’re trading. Rate announcements, central bank conference, macro-economic figuresrelease, ). They’re all very important since they can bring uncontrolled volatility to the pair.Long trade entryFor a long trade, the following conditions need to be met:1. price should be above the kumo cloud, indicating an uptrend (no trade if price is in the cloudor below);2. the 21 period EMA should have an upward slope (avoid flat) as illustrated previously.Ideally the Kijun Sen shouldn’t be in a flat position either. That would mean we’re not reallymaking higher highs on a medium term perspective. There will however be some cases ofentry when the Kijun is not yet sloping upwards; this will be a discretionary decision, themost important is the 21 EMA;3. the idea is to catch a swing low on the uptrend and enter when the trend resumes. To timeyour entry, use the RSI as a gauge of speed and momentum of price movement. You need itto dip towards the 50 mark and bounce back up again after hitting it. The signal candle willbe the one where the RSI goes back up.4. Enter on a break of the high of the signal candle.Provided by tradingtools.netPage 10
My 15 min per Day Ichimoku Trading StrategyShort trade entryFor a short trade, things should be the exact opposite:1. price should be below the cloud, indicating a downtrend (no trade if price is in the cloud orabove);2. the 21 period EMA should have on a downward slope (avoid flat) as illustrated previously.Ideally the Kijun Sen shouldn’t be in a flat position either. That would mean we’re not reallymaking lower lows on a medium term perspective;3. the idea is to catch a swing high on the downtrend and enter when the trend resumes. Totime your entry, use the RSI as a gauge of speed and momentum of price movement.You need it to move towards the 50 mark and bounce down up again after hitting it. Thesignal candle will be the one where the RSI goes back up.4. enter on a break of the low of the signal candleIn both long and short entries, it could happen that the RSI doesn’t exactly hit the 50 mark. Ithink that can be ok if it remains in a reasonably tight zone around the 50 level. However all otherconditions should be met, especially the slopes on EMA and Kijun. That is left to traderappreciation but I have found to miss significant market moves if I get too strict on an exact hit ofthe 50 mark.Provided by tradingtools.netPage 11
My 15 min per Day Ichimoku Trading StrategyWhere should you put your stop-loss ?For stop-loss placement I have already explained that I use fractals.Again, it is a simple and straightforward rule. The reason for using fractals is that they representkey short term swing highs or lows.If I’m going long and the previous up fractal (see above for definition) is broken by a downwardmove then my conditions for an uptrend are no longer met.And the same goes for a short trade. If a down fractal is broken by an upward move then myconditions for a downtrend are no longer met.How to manage your trade and where to exit?I usually trail my stop to the next fractal. But since I try to keep my risk extremely low,sometimes I’ll quickly move to break even if I’m up 1R let’s say.For exits, this is very discretionary. Several options to choose from. You can exit:when price crosses the Kijun or EMA, orif price hits the cloud, orat a certain level of gain. This is what I use most often. I usually exit around R3 (3 times myrisk). More precisely, when price is around R3 I’ll move my stop very close, leaving roomfor further gain.All of this depends on your apetite for risk and the kind of R:R you are aiming for.Provided by tradingtools.netPage 12
My 15 min per Day Ichimoku Trading StrategyRisk management for this Ichimoku StrategyI usually go with a 1,5% risk max on any given trade. That’s quite reasonable and I like to keep itthat way. I’m fully comfortable with risking 1,5% of my capital on any given trade.Experience has proven that keeping losses at a minimum is absolutely crucial.So I try to NEVER break that rule. I try to aim for 3R usually, which means 3 times my risklevel. For example, if I have a 20 pip stop loss I’ll aim for a 60 pips take profit.What Forex Pairs can you trade with thisIchimoku Strategy?Reading the market with this system is extremely simple. You only need a few seconds on eachpair to know if you have a trade.Here are the Forex pairs that I trade :EUR/USD, GBP/USD, AUD/USD, USD/JPY, EUR/GBP, NZD/USD, EUR/JPY, XAG/USD,XAU/USD, GBP/JPY, EUR/AUD, GBP/AUD, USD/CAD, EUR/CAD, EUR/NZD, AUD/CAD,AUD/NZD, CAD/JPY 18 pairsAll you need is 15min per day: trade with a dayjobIt really doesn’t take me more than five minutes in the morning and five minutes in the evening toscan the market.Provided by tradingtools.netPage 13
My 15 min per Day Ichimoku Trading StrategyYou might need a little more time if you have open positions. But basically that’s it this is a15min max per day system. No interpretations and splitting hairs, you either have a setup or youdon’t.Well, there you have it. That’s my Simplified Ichimoku Strategy.You can give it a go and give me your feedback. I’m sure this strategy can be improved, but sofar it’s working for me so that’s all I need.If you don’t have the time or the energy to implement this strategy, you can also find some goodIchimoku traders on some social trading sites (like eToro). I recommend trying their CopyTradingfunction. You can get some decent returns if you carefully select the best traders.Safe trading to all.You can try this Strategy using TradingView, a freecharting platform available to allTry it hereProvided by tradingtools.netPage 14
My 15 min per Day Ichimoku Trading StrategyOne last thing, a fantastic Ichimoku bookAmong the many books written on Ichimoku, there is one I definitely recommend if you want totake things further.It will provide you with a lot of very valuable strategies, on all time frames. It has been written byKaren Peloille, a french specialist who has taught tons of traders in banks and financialinstitutions worldwide.She is very renowned, straight to the point and known to be one of the most consistent tradersaround.Find her book here, enjoy your reading.Provided by tradingtools.netPage 15
My 15 min per Day Ichimoku Trading StrategyIf you want to thank meI have provided this strategy free.I have not collected your email, and therefore will not spam you with unsolicitedcontent.If you want to thank me and help support my website, you can buy me a beer.Buy me a beer with PaypalYou can also use this QR CodeProvided by tradingtools.netPage 16
My 15 min per Day Ichimoku Trading StrategyVideo : My 15 Min per Day Ichimoku StrategyI have made a complete video of the Strategy for those of you who find it easier with a visualrepresentation.Click on the video below to see it in Youtube.You can put any text hereProvided by tradingtools.netPage 17
Final wordsI hope you have found this strategy useful.Always be careful with the money you invest, you should always testany strategy on a demo account before you go live.If you have any comment or addition, or if you want to tell me how thestrategy works for you, let me know in the comment section onmy Blog post.Safe Trading to all.
The Ichimoku cloud and Kijun Sen The Ichimoku Kinko Hyo system is a very elaborate but simple system. It was devised by a Japanese journalist named Goichi Hosoda in the late 1930s. He released it to the general public in the late 1960s after 30 years of testing and improvement. It is a very complete system giving an instant view of market .