Transcription
Investor UpdateJune 2021
Contents01Overview021Q2021 Performance03Strategy04Outlook05Supplementary Information1
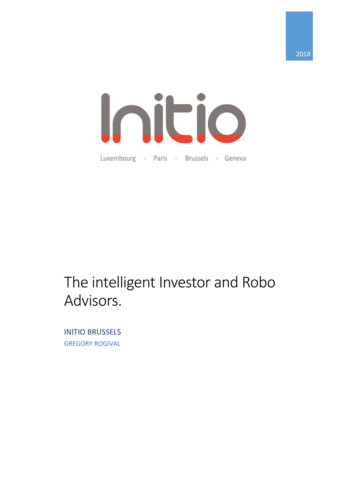
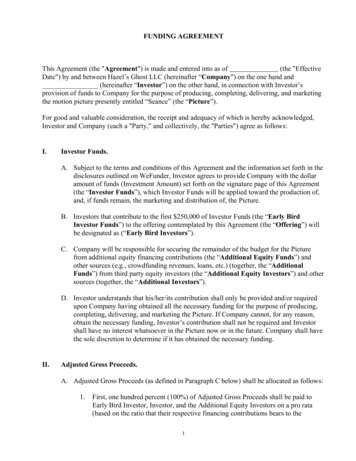
Oil Balance Thailand: Jan – Mar 2021Adequate refining capacity maintains the stability of country supplyDemandProductionSupplyDomesticImport (84%)953 KBDImported Refined Petroleum Products 43 KBDCrude/Condensate910 KBDIndigenous (16%)188 KBDCrude/Condensate168 KBDTotal Refining Capacity in Thailand:1,242 KBDRefinedProducts990 KBD*869 KBD (**)PTT’s Associated Refineries : 770 KBD(TOP, PTTGC, IRPC)RefinedProducts175 KBDExportOther Refineries : 472 KBD(SPRC, ESSO, BCP)Crude Export 20 KBDSource: PTITRemark :195 KBD(*)Refined product from refineries 901 KBD, including domestic supply of LPG from GSPs and Petrochemical Plants 89 KBD(**) Included InventoryKBD Thousand Barrels per day2
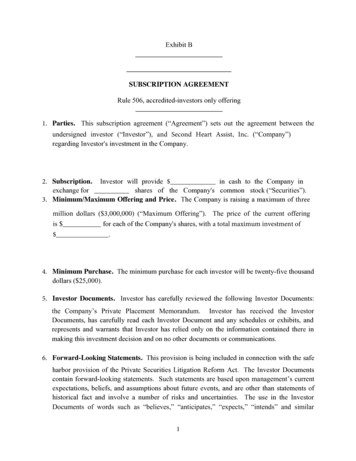
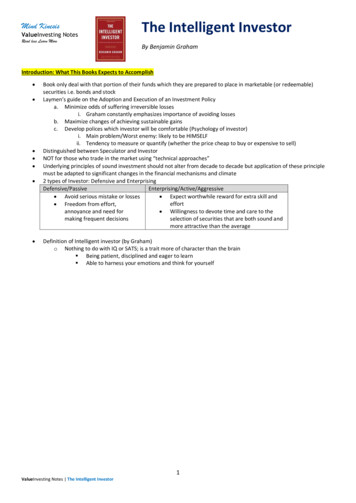
Natural Gas Balance: Jan – Mar 2021Main driver of the Thai Gulf of Thailand )3,043MMSCFDGas Separation Plant958 MMSCFD(21%)6 GSPsTotal Capacity2,870 MMSCFD @ A ctual H eatOnshore (3%)LPG/NGLIndustryHouseholdTransportation(8%)113 MMSCFDBypass Gas482 MMSCFDImport (31%)1,426 MMSCFDMethane1,603 MMSCFDPower(60%)IndustryNGV(16%)(3%)LNG, Myanmar,49%51%Remark: MMSCFD Million Cubic Feet @ Heating Value 1,000 Btu/ft 33
PTT’s Strategic Importance to ThailandThai Premier Multinational Energy CompanyMinistry of Finance holds majority stake in PTTMarket Cap : SET & PTT GroupSET market Cap:Bt 18,276 bn (USD 581 Bn)PTT Group15%OthersNote: As of Mar 5, 2021PTT Group:Bt 2,663bn (USD 85Bn)GPSC GGCPublic 37%IRPC 3% 8% 0.4%TOP 5%PTTPTTGC 11%42%85%OR14%N ote: A s of M ay 31, 202118%PTTEPRobust revenue and net income growth since IPO (MMUSD)1Vayupak Fund12%51,356RevenueNet IncomeThai Ministry of Finance51% Foreign 10% Thai27%PTT ratings at Thai sovereign level1,20012,55319%70253% Affiliate47% PTT81%BBB BBB PTT – FCBaa1Baa1BBB BBB PTT – LCBaa1BBB BBB FC19%2020200112020 Annual Avg. BOT selling rate USD/THB of 31.46 (Avg. rate)2001170th in 2020165th in 2019156th in 2018190th in 2017337th in 20162020Platts Top 250 GlobalEnergy Company23rd in 202021st in 201910th in 201812th in 201763th in 2016International and local recognition140th Fortune Global500 in 2020130th in 2019163th in 2018192th in 2017146th in 201693th in 2015Best Investor RelationsBest EnvironmentalStewardshipSET A wards Best Investor RelationsA wards 2020Best C EO /Best CFO /Best CSRBest E nvironmentalResponsibilityBest IR C ompanyBest IR P rofessional(2 ndconsecutive years) Best SustainabilityExcellence A wards 2019Dow Jones SustainabilityIndex (DJSI)DJSI Member 2011-2020(9th consecutive years)4
PTT Group Businesses and ActivitiesPTT Own Businesses(PTT’s own operation)Upward Integration(PTT Operate through our subsidiaries)Natural GasE&P- Oil, Gas, Condensate- 40 Projects in 15Countries- 1,074 mmboe provedreserves or 7 years in2020LNG( 5 0%)(1 00%) LNG Value Chain LNG Receiving FacilitiesCoalOil & Retail 4 gas pipelines 6 Gas Separation Plants Procurement &Marketing NGV( 6 5.29%)(1 00%) Diversified International portfolio forensuring long-term energy security( 7 5%)Market Share 42%2Refineries- Oil (1,997 stations in Thailand2)- Non-oil Retail- Lubricants- International Oil & Retail( 4 8%)TradingMarket Share 50% Crude Procurement Import/Export Commodity Hedging Int’l Office: China/Singapore/ Dubai/ London/Thailand Traded 75.5 bn liters3 in 2020Technology & EngineeringCoal Mine inIndonesiaDownward Integration(PTT Operate through our subsidiaries)-Largest refinery group inThailand : 3 of 6 refineriesPetrochemicals( 4 8%)Market Share 50%- Integrated Refineries &PetrochemicalPower Engineering & Project Mgt. Asset management Innovation & Digital Infrastructure Business – Create networkingof energy that leads to sustainable growthand PTT’s S-curve(3 1.72%2)5,055 MW (equity portion)- Electricity- Steam & Chill Water- Energy Storage Ensuring customer satisfaction and loyalty byproducts and services Create value added thru downstreambusinesses42.54% after the shareholding restructure in June 2021As of 31 Dec 20203 For the year 202012Remark: P ercentage holding as of Mar 20215
Contents01Overview021Q2021 Performance03Strategy04Outlook05Supplementary Information6
KEY ACTIVITIES IN 1Q20211. Gas business 1 Jan 2021: NGV retail price for public sectoradjusted to equal private sector First LNG reloading cargo LNG Truck loading2. Establishment of Innopolymed Company Limited to operate1. Acquisition of 20% stake Acquisition of Vinythaishares at 16.24% throughin Oman Block 61Delisting Tender Offer2. Gas & Oil Discoveryin Malaysia field (SK417SK405B and SK438)3. First Gas production ofBlock H Project in Malaysia1st Trading day on 11 Feb 21 Investment in Anhui AxxivaNew Energy TechnologyMarket Cap. 200,000 MBCo., Ltd.IPO at Baht 18 per sharewhich operate batterymanufacturing businessLife science business PTT MEA Ltd. to operate trading business esp. in theMiddle East and Asia On-I on Solutions Co., Ltd to operateSUBSEQUENTSUBSEQUENT EVENTSEVENTSEV Charging station (outside station) Acquired6.66% stake in Lotus Pharmaceutical Company Limited; Listed company in Taiwan Establishment Joint investmentof T-ECOSYS Company Limited (“T-ECOSYS”) to operate the industrial digital platform businessto operate the entire supply chain of Plant-based protein business Restructure of PTT Public Company Limited’s Power Business ( 12.73% stake increased) PurchasedThai Airway International Public Company Limited’s land with buildings7
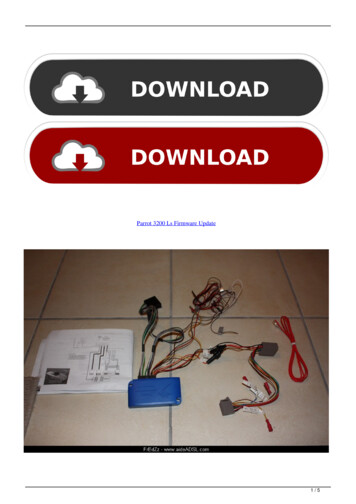
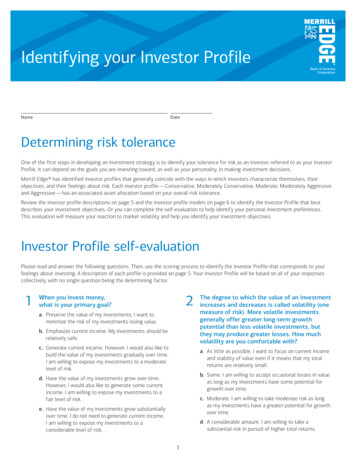
Key Business Drivers:QoQ: Increased in all product prices due to demand recovery and tight supply from OPEC while gas pooled price stabilized2020 vs 2019: Pressured petroleum and petrochemical prices from impact of COVID-19 and price warAVG. Petroleum Prices ( /bbl)AVG. Petroleum Prices ( /bbl)DubaiQoQYoY2020 vs 20191008064.16067.465.163.562.161.24035%18%34%FO 1181662.9 Dubai59.0 FO(3.5%)2019 Dubai avg.: 63.50Petrochemical Prices (Avg. 23%24%494540N ote: F igures are av erage & N aphtha (M O P ’J)968919Naphtha37%27%27%1,428 .03.6* JLC Japan LNG Cocktail : Landed LNG price in Japan2.18.45.67JLC-LNG*8.0 JKM Spot6.36.36.175.85.86Avg. Pooledgas price3.6Jan-191Q19 Apr-192Q19 Jul-193Q19 Oct-194Q19 Jan-201Q20 Apr-202Q20 Jul-203Q20 Oct-204Q20 Jan-211Q21 Apr-21Apr’211,1451,000766546427397341 Q 20 (end FX 32.83)End: Baht Depre.Bt 2 .5 or 8.2%1,36587176061409.7AVG. FX (THB/USD)1,1421,085909PX37%8%36%JKMA vg. Pool26%3% 100%19%22%10%10.19.56.62Jul-201Q19Apr-192Q19Jul-19 3Q19Oct-19 4Q19Jan-20 1Q20Apr-20 2Q203Q20Oct-204Q20Jan-211Q21 Apr-21Apr’21HDPE15%36%11%7.2842020 Dubai avg.: 42.2PP20%38%10%11.06Jan-19QoQYoY2020 vs 20 vs 20195615291,283HDPE935 BZ838 PX333231.831.8408Jan-191Q19 Apr-192Q19 Jul-193Q19 Oct-194Q19 Jan-201Q20 Apr-202Q20 Jul-203Q20 Oct-204Q20 Jan-211Q21 Apr-21Apr’2131.531.530.830.5302931.530.9563 Naphtha5571 Q 21 (end FX 31.51)End: Baht Depre.Bt 1 .3 or 4.3%32.1317534 Q 20 (end. FX 30.21)End: Baht AppreBt 1 .6 or 5.0%30.4131Q192Q193Q194Q191Q202Q203Q204Q201Q21 Apr’218
PTT Consolidated Performance: 1Q2021QoQ: Resilient performance as a result of petroleum & petrochemical demand recovery2020 vs 2019: NI pressured mainly from Oil price war & COVID-19 impacts in line with global trendRevenue27%17% QoQUnit: MB1% YoYEBITDA2,219,73922%44% QoQUnit: MB 100% YoYNI 100% QoQUnit: MB 100% 21201920201Q2021Oil & RetailPTTEPOil & RetailPower 3%31%32%Oil &Retail102,997 837 MBP&RPower &OthersPTTEP11%11%32,588 MB13%13%21%PTT-GasPower &Others27%27%P&R9
1Q21 vs 4Q20 PTT Consolidated Performance (QoQ):Enhanced performance in all PTT Group BusinessesExtra Items*4Q20 : Coal mining: asset impairment loss of 6,800 MBEP’s impairment loss of 689 MB; mainly Yetagun1Q21 : EP: Gain on bargain purchase of Oman Block 617,033 MB, offset write-off assets in Brazil 2,909 MBMMTHB(*PTT’s portion net tax amount)19,505Power/ Others15,608 Power: Higher SPP margin & Lower maintenance cost PTT LNG : Stable revenue & higher gain on derivatives PTTT : Improved margin and sales volume from LPG/LNGand petrochemical products32,58813,147Oil & Retail Improved Gross margin- Lower sales volume both oil and non-oil businessesPetrochemical & RefiningExtraItemsPower/OthersOil &RetailsP&R4Q201Q21 100% 47% 13% 100%PTTEP 47%PTT 2%Refinery Higher Stock gain in 1Q21 Higher Mkt GRM despite higher crude premiumPetrochemical Olefins: Improved product prices from demand recovery Aromatics: Increase in BZ & PX spreadsPTTEP Higher ASP from liquid prices increased Higher Sales vol. from Bongkot and Oman Block 61 Lower unit costPTTGas GSP: Higher avg. selling prices & volume S&M: Higher sales vol. from power sector & industrialcustomers’ selling price linked to rising FO priceTrading Strong margin from domestic condensate10
PTT EBITDA Breakdown by BusinessUnit: % 502%GSP1,8032,9696,220 100% ,96621%GASTradingTotal 100% 25%39%49%11
Financial PositionStrong Balance Sheets maintained credit ratingsConsolidated Balance SheetsMMTHB8%2,746,7152,544,183438,021Cash &ST Invest416,921AR & ,379,066 1,403,1581,292,717 1,285,8451231 Dec 203Key Financial Ratios41.68AP & OtherLiabilitiesInterestBearing Debt(IBD)TotalEquity1.390.290.2920201Q21Net Debt/EBITDA 2.0Net Debt/Equity 1.0PTT Ratings at Sovereign LevelForeign CurrencyBaa1BBB BBB Local CurrencyBaa1BBB BBB 531 Mar 21 Increase in Account Receivables and Inventories from the higher product prices Higher PPE from PTTEP’s business acquisition of Oman Block 61 and TOP’s additional construction in progress of CFP Higher Interest Bearing Debt (IBD) from increase in long-term borrowing mainly from GC Increase in Equity due to OR’s capital increase and higher net income12
Dividend Policy & Historical PaymentsY2020 Dividend payout at 75.8%Avg. since IPO46%90.0080.0070.0060.0010-Year Avg.59%148.6%Dividend %40.4%34.7%34.9%49.0%40.0%35.5%42.8% 48.2%62.5%75.8%0.00%25% PTT’s min. payout ratio PolicyBaht / shareSplit 0.2513.0013.0013.0011.0010.00EPS1.00 DPS6.734.0020032004200520062007* Spilt par value from 10 to 1 Baht/share since 24 April 192020-900.00%13
Contents01Overview021Q2021 Performance03Strategy04Outlook05Supplementary Information14
PTT Group’s Strategic FrameworkVisionAspirationStrategicDirection15
PTT Group Strategic Move for GrowthReimagination :Initiate business action: Both in existing businesses and new growth for the next normalREIMAGINE upstream“Strategic move in LNG Businessto be LNG Portfolio Player” Expand LNG Business overseas Globally Investment in upstreamrelated businessesFocus onREINFORCE downstreamREIGNITE new business“Enhance more synergy forgroup value to create sustainablelong-term competitiveness”at SCALE“Drive strategic enablers tospeed up execution” Strengthen collaboration and trustto maximize value along value chain Reduce redundant investment Invest in renewables-relatedbusinesses, e.g. Storage/Gridnetwork, EV, Smart energy platform Explore & Expand into New Business(Life Sciences, Advanced Materials,Mobility & Life Style, Logistics)Productivity Improvement & Operational Efficiency16
Reignite New Business at scaleNew EnergyInvestmentPlan2021 – 2030Opportunities Screening & AlignmentNew BusinessExplore & Expand in Life Science projects 10% 10%8GWNewEnergy3GW2021Market Entry2025ScalabilityNewBusinessPharmaceutical Develop Thailand's first cancerpharmaceutical factory Explore M&A opportunities2030Nutrition Bringing manufacturing technology Focus on natural ingredients.Note: Currently, PTT Group’s renewable energy portfolio is 600 MW: Investment budget is included in the Provisional CAPEX EV Platform : Currently 32 stations Target: 200 EV chargers in 2021 Battery Plant & Smart Grid, Artificial IntelligenceStrategicPARTNERSHIPMedical Device Develop Bio-Cellulose forWound Dressing Medical masks, Dust mask, and Medicalgloves from the situation of the COVID-19NewPLATFORM17
PTT: Committed CAPEX (PTT and Wholly Owned Subsidiaries)PTT 5-Years (2021-2025) Committed CAPEX Plan totaling Baht 103,267 million or USD 3.3 bnPTTLNG22,150 MBLNG Terminal 2 (Nong-Fab)Technology & Engineering (TEG),International Trading, Downstream21%10%10,245 MBi.e. VC ,EECi (Wangchan Valley)26%Transmission13,053 MB5th onshore Pipeline13%30%GasOther wholly owned subsidiaries30,552 MB27,267 MBmainly downstream businessesi.e. MTP Phase#3 (PTT Tank), InnobicUnit: MMTHBGSP #7 (To replace GSP#1) andGSP efficiency improvement projects52,931Natural Gas33,412Transmission8,597PTTLNG6,663TEG, International Trading, Downstream1,664Other wholly owned subs20212022202320242025The Provisional CAPEX Bt 332 bn which mainly focus on LNG Value Chain, Southern LNG terminal and pipelines according to PDP 2018, Gas-to-power project, and NewBusinesses (including Renewable energy, Life sciences, Electricity value chain etc.)Note: 2021-2025 CAPEX plan approved by BOD on 17 Dec 2018
Committed CAPEX: PTT GroupTotal committed CAPEX during 2021-2025* : Bt 851 bn or USD 27 bnPower BusinessUnit: MMTHBKey Projects SPP Replacement ERU Renewable Energy (Solar/Wind)Downstream BusinessKey Projects TOP: Clean Fuel Project (CFP)GC: Efficiency improvement projectsIRPC: Ultra Clean Fuel Project (UCF)OR: Oil & Retail Expansion in domestic &international6%31%PTT BusinessKey Projects GSP#7 5th onshore pipeline 2nd LNG Regasification Terminal12%Upstream Business51%Key Projects Onshore and Offshore Exploration and Production inThailand (Bongkot, Erawan etc.) Algeria HBR Southwest Vietnam SK410B Mozambique LNGPTT Group’s Provisional CAPEX for 2021 - 2025 Bt 804 bn5419
Gas Business RoadmapShort term Gas Demand growth be maintainedThailand Gas Demand Outlook (Short Term – 5 year plan)New SupplyBongkot ErawanAdditional capacity(mmscfd)Major Project : COD& Capacity/Accumulate Pipeline distance7008005th pipelineRA#6 PipelineLNGTerminal 2GSP#7*BPK-SB**pipeline4,702 KM 7.5 MTA460 mmscfd4,776 KM*Replace GSP#1**Bang Pakong– South BangkokPower Plant20
Newly Thailand Power Development PlanStronger demand of NG for power plantsPDP 2018 Rev.1**PDP 2015*Natural Gasbe the most important source of energywith highest portion among other fuelsNatural Gas growth uponGovernment fuel diversification policyfor power generation400,000Unit:Unit: GWhGWhEnergy 00037%8%3%7%Renewable19%Domestic2%2% H ydro10%9% H 050,0000*Source: Ministry of Energy60%55%9%8%6%2%5% Coal13%11%8%6%6% Lignite** Source : EPPO (Public Hearing presentation)Import21
Natural Gas DemandGrowth of natural gas upon Government fuel diversification policy for power generationNEW**Old*Thailand Gas demand forecast (CAGR during 2018-2032):::::Total Power GSP Industry NGV 0.1%2%-7%1%-6%*Source: Ministry of EnergyThailand Gas DemandReplace :Coal Krabi (800 MW),EE 30%Thailand Gas demand forecast (CAGR during 2021-2035):::::Total Power GSP Industry NGV 2%3%-1%2%-6%** Source : PTT Business plan 2021 approved by BOD on 17 Dec 202022
PTT Group : Upcoming ProjectsERU Project (Power 250 MW)GSP #7 (460 MMSCFD)Olefin Modification ProjectEnhance upstream feedstock flexibilityUltra Clean Fuel (UCF)Building Competitiveness: Euro 5 dieselClean Fuel Project (275 400 KBD)Mozambique Area 1*PTTEP hold 8.5%13.1 MTPA or 300 KBOEDSouthwest Vietnam* P TTEP hold 7-8.5%LNG Terminal 27.5 MTPA490 MMSCFD or 80 KBOED5th onshore pipelineLength 400 KM.2025Algeria HBR (Phase I) oil:10-13 KBD* P TTEP hold 49.0%Sabah H *PTTEP hold in Rotan fieldGas:202456.0% andRemaining Area 42%270 MMSCFD (100% project)Oman Block 61 *PTTEP hold 20.0%Gas: 1.5 Bcf (100% project)2023Semi-Solid Energy Storage Unit30 MWh20222021Nawanakorn Electric GeneratingExpansion 60 MW * G PSC hold 30%2020* P TTEP hold 49.0%Gas to Power in MyanmarMTP Retrofit (Olefins Reconfiguration)Ethylene 500 KTA, Propylene 250 KTAPO/PolyolsPO 200 KTA, Polyols 130 KTAAlgeria HBR(Phase II)50-60 KBDU pstream : G as from Zawtika & M 3P ipeline: Length 370 KMG as-F ired P ower P lant: 600MWBang Pakong– SouthBangkok PipelineLength 80 KM.CompletedIn progressWait for FIDUnder Study23
Contents01Overview021Q2021 Performance03Strategy04Outlook05Supplementary Information24
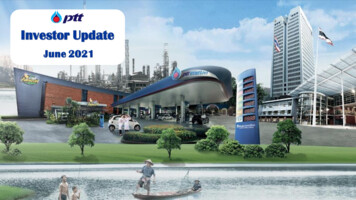
Petroleum2021 Petroleum and Gas Outlook /bbl80706050403020100 S ource: P TT, P RISM P etroleum Rolling as of Apr ilPriceHSFO2Q21VLSFO3Q214Q21Singapore GRM2020(A)1Q21(A)2Q21 667-77Gasoil48.464.866-7165-75HSFO (3.5%S)39.256.657-6254-64VLSFO (0.5%S)53.473.568-7366-76Singapore GRM0.41.81.8-2.02.0-2.5Gas/LNG Global economy and oil demand recover after vaccine rollout OPEC & Saudi Arabia manage market balance but will ease crude oil output cut Geopolitical risks; Unrest in oil producing countries i.e. Libya, U.S.’s sanction on Iran- COVID-19 resurgence in India, Brazil, Japan, and several other countries0Mogas-5 Increasing demand following easing lockdown restrictions in major regions Singapore light distillate inventories back to normal level Healthy summer driving demand in the US (June-July) to boost gasoline priceGasoil Demand is expected to recover following global economic recoveries in 2H20- Higher supply as refineries shifting Jet/Kerosene yield to produce more Gasoil- Singapore middle distillate inventories remained at high levelFuel Oil HSFO: Strong demand supported by the upcoming summer power demand & Lowersupply amid reduced term lifting of medium-heavy sour crude from OPEC VLSFO: Healthy bunker demand following the global trade recovery /MMBTU121086420DubaiSingapore GRMAsian Spot LNG Improved crack margins from the recovery of gasoline demandHenry 1Q21(A)2Q21(E)2021(E)A sian Spot LNG4.310.97.6 - 8.58.2 – 9.2Henry Hub (HH)2.12.72.6 – 2.92.5 – 3.14Q21Asian Spot LNG: Strong European price from cold weather support Asian spot price- Asian buyers have already been stocking ahead of timeHenry Hub: Higher price due to continued growth in LNG exports7325
2021 Petrochemical OutlookOlefins ,230-1,2501,120-1,170PP DPE CFR SEA800PP Yarn CFR 251,000800600400BZ FOB Korea200PX CFR Taiwan01Q20Naphtha /Ton2Q203Q204Q201Q212Q213Q21 Remaining tight PE/PP supply in the short term after the USplant outages from Polar Vortex Delayed startup at PRefChem to 2H21- Slowdown demand amid Ramadan period, Chinese Labour holidays,and Golden week in Japan together with unexpected surging Covid-19pandemic cases and lockdowns in many regions- Incoming additional Asian capacities from Northeast Asia andSoutheast Asia to pressure the olefins markets from 2Q21 onwards4Q21Price /TonAromatics4Q20OlefinsAromatics PX/BZ markets expected to be more balance according to theeconomic recovery and the improved demand from additional downstreamPTA ramp-up production in 1H21 and SM capacities startup in 2H21 Low Chinese BZ inventories to bolster the Asian demand growth- Capped PX price gains from persistent squeezed PTA and end-productsmargins- Additional PX/BZ capacities from China’s Zhejiang PC and SaudiAramco expected to startup in 2H214Q21Price2020(A)1Q21(A)2Q21(E)2021(E)Naphtha MOPJ380557565-585550-600800600400Naphtha Additional demand from new cracker startup, particularly inNortheast Asia, to bolster demand- Eased supply as refinery runs will be higher regarding betterCOVID-19 situation20001Q202Q203Q20S ource: P TT, P RISM P etrochemical Rolling as of Apr 20214Q201Q212Q213Q214Q2126
Upcoming project2Q2021RA #6 :99.8% Ratchaburi - WangnoiPerformance Recovery100.0%COD: 2Q2021Rayong Waste to EnergyGas Business NG DemandIncrease 1% vs 2020 Gas Volume Growth:CAGR 3.2 % during 2021 -2025PTT Group98.8%COD: 2Q2021MTP Retrofit : 750 KTACOD: May 2021PTA & PET Capacity Enhancement PTA : 470 KTA ,COD: Apr 2021 PET: 53 KTA, COD: Jun 202130 MWh Semi-Solid ESUE&POILP&R: Crude oil price recovery Vol. rise 14% Unit Cost drop 5%: Oil Stations 192 stations Café Amazon 552 outlets: Refinery U-Rate 97–99% SG GRM 2.0 - 2.5 /bbl Petrochemical spread increasePower : Industrial demand increase 4%95.3%COD: 2Q20212H20215th PipelinePhase IPhase II97.5%81.8%C O D:3Q2021Phase IIIIn the process ofsourcing contractor :To COD in Dec 2022C O D:1Q2022High-quality Circular Plastic Resin Plant: 45 KTA COD: 4Q2021 Improve GSP U-RateGSP’s U-Rate 92-94% in 2021 Flat Pooled gas costMaintenance Schedule in 2021Gas Separation Plants2H213Q:GSP#6 Major TA : 26 days3Q-4Q: GSP#3 & ESP Major TA : 23 daysESP TD 60% : 15 daysPetrochemical Plants2H21: Planned Major TA : Ethane Crackers Oleflex : 1 month OLE3 : 1 month HDPE2 : 1 month27
Contents01Overview021Q2021 Performance03Strategy04Outlook05Supplementary Information28
Supplementary InformationPTT Group PerformanceP.30-31Cash FlowP.32-33Debt ProfileP.34PTT Group Accounting StructureP.35Financial Performance by businessP.36-46Natural Gas Price StructureP.47Gas Pipeline BusinessP.48SustainabilityP.49-508829
PTT Group Performance : 1Q2021 (QoQ ,YoY and 2020 vs 2019)% PTTholdingPerformance 100%Unit : MMTHB1Q204Q201Q2120192020QoQYoY2020vs2019PTT Net operating Income1,7168,3518,49830,67317,6312% 100%-43%E&P8,6132,52711,53448,80322,664 100%34%-54%(8,712)6,4679,77811,99447751% 100%-96%(8,784)6,4059,69511,68220051% 3(9,453)1% 100% -100%(13,754)7,2583,3606,277(3,301)-54% 100% -100%(8,905)1,6085,581(1,174)(6,152) 100% 100% -100%57924,52528,12122,083 100% 100%-21%5311,817(6,318) 100% 100% -100%- PTTEPPetrochemical- GC- Other72Refining- TOP- IRPCOthers Business7,672Equity Method % ,49830,67317,6312% 100%-43%5,5961,6237,52431,88214,596 100%34%-54%(4,058)2,8854,6755,76718262% 100%-97%(4,131)2,8244,5925,455(95)63% 100% ,452) 100% 100% -100%45.03%(6,363)4551,6152,788(4,511) 100% 100% -100%45.05%(4,260)7322,577(2,941) 100% 100% -100%6,217(916)7,39922,54613,886 100%19%-38%322(6,010)4931,815(6,652) 100%53% -100%63.79%45.41%73(453)Inter- PTTER/PTTGMGas- 4777,153 ities- 17,0376,13610,423 100% 100%70%5645877391,5742,66626%31%69%Oil- OR1,8982,9234,00310,8968,79137% 146997952,034 100%-35% 100%1,0813156998052,035 100%-35% 100%(15,086)18,43954,77894,02135,771 100% 100%-62%(2,868)4,77923,79062,53021,212 100% 100%-66%(402)17300(1,077) 100% 100% 100%(402)17300(1,077) 100% 100% -100%(13,772)26,80763,57652,325 100%-58%(1,554)13,14732,58837,766 100% 100%-59%Other1/- PTTT/OthersShared of Net Income from AffiliatesTax adjustment for gain on disposal of investment and assetPTT Conso. Net Income106(5,799)(252)124,442 100%100%(252)92,9511/Including PTTGE,BSA, PTT TCC and RTC30
2020 vs 2019 PTT Consolidated Performance:Power/ OthersOthersSoften performance caused by COVID-19 pandemic & Oil price war101,166Coal: lower vol. and prices from weak global demandPTT NGD: lower selling prices ref. FOPTTLNG: stable rev. & higher gain on derivativesMMTHBPowerIncreasing vol. from full recognition of GLOWLower gas cost & lower finance cost from repayment of ST loan92,951Oil & RetailsVol. decreased esp. Jet, LPG from COVID-19Lower Margin mainly from diesel and gasolineStock gain in 2020; while stock loss in 2019Higher non-oil contribution56,47011,76010,8968,628Petrochemical & Refining37,76661,27532,27011,6146,676Margin2020: 315,7942019: 377,06917,33415,3092,175Depre &AmortizationOther2020: (139,880) Income32,385(4,948)20192020: (19,193) 2019: (86,238)2019: (1,859)2019: 6,238Power/OthersOil &Retails1%18%3,359FX temsInt. &2020: (11,917) Derivatives CIT exp.&2019: 143Other2020: 11,5362019: 14,895 2020: (51,708)2019: (84,093)2020PTTEPLower ASP following crude oil prices decreasedHigher vol. from Malaysia Project & Partex acquisition; despitelower domestic demandPTTGas12,060StockOPEXgain/(loss) 2020: (70,929) 2019: (133,204)2020: 4,063 Impairment34,3458,884Huge stock loss in 2020 as crude price sharply dropped in 1Q20Lower GRM from reduced in most products’ spreadOlefins: lower vol. as GC’s major T/A & olefin spreads droppedAromatics: PX spreads dropped; despite higher vol. (lower T/A) (100%)92%GSP: declined petchem prices & vol. from GSP longer S/DS&M: Lower vol. due to soften power demand & industrialselling price linked to lower FO priceNGV’s business improved due to lower vol. & NG costTradingImproves margin from capturing arbitrage and lowercondensate discount together with lower SG&ALower vol. of crude import and out - out activities frompressured global demandExtra Items2 0 20 : Impairment* loss on P TTEP’s assets (1,614 M B), PTTGM’s coal mining (7,657M B), IRPC’s MARs projects (175 M B) (*PTT’s portion net tax amount)2 0 19 : -P TT Group: Additional E mployee Compensation (2,841 M B)-P TT’s payment on damage from court’s judgment (N ACAP 2,105 MB)& pipeline allow ance for high speed train project (498 M B) IRPC: Claim from U HV project (130) & rev erse impairment (366 M B)31
PTT Consolidated Cash FlowsUnit : MMTHBFree Cash Flow-145,305 50,440ST ,889Cash &Cash Equivalents-1,926 83,952319,193332,032Cash Out-12,839Cash Beginning31 Dec sh AdjustmentNet IncomeChanges in assets & liabilitiesIncome Tax66,82632,588(46,131)(2,843)Investment (Sub. &Affiliates)CAPEXCurrent investmentOthersDividend/Interest Received*Investment in financial assets, ST/LT lending 653)890Adj & OthersCash Ending31 Mar 21Financing83,952Ordinary share issuance of subsidiariesReceived from loans/BondsLoan RepaymentFinance cost paidDerivatives53,66544,494(7,410)(6,784)(13)32
PTT Only Cash FlowsUnit : MMTHBFree Cash Flow100,746MMTHBST InvestmentCash &Cash Equivalents44,404109,205MMTHB 16,106 741 8,472 8535,931 7,63473,274Cash In56,342 16,932Cash BeginningOperatingInvestingFinancingAdj & Others31 Dec 20OperatingNet IncomeNon-Cash AdjustmentChanges in assets & liabilitiesIncome Tax*Investment in financial assets, ST/LT lending loansCash Ending31 Mar 217,63414,1705,233(11,541)(228)InvestingCurrent investmentDividend/Interest ReceivedOthersInvestment (Sub. &Affiliates)CAPEX8,4727,2716,257580FinancingLoan RepaymentFinance cost paid7412,455(1,714)(3,112)(2,524)33
Debt Profile : Control Cost & Manage RiskManaged debt according to financial risk and policyDebt PortfolioUnit : MMTHBPTT Only : Cost of debts: % fixed-rate: Avg. debt lifeUSD&OthersConsolidated 4.63% 79.07% 17.40 years: Cost of debts: % fixed-rate: Avg. debt life 3.58% 73.09% 11.52 7%)(38%)32,679(28%)84,70292,48792,48331 Dec 1931 Dec 2031 Mar 21(63%)(72%)369,409449,943444,718(61%)(57%)31 Dec 2031 Mar 21(61%)(62%)31 Dec 19Note : 1. PTT Data as of 31 Mar 21 (THB/USD 31.5052 THB/JPY 0.2869) excluding liabilities from finance leases.2. Debt Outstanding represents amount and portion before derivative swaps, and reconciled with accounting.3. Cost of debts, % fixed rate, and avg. debt life took into account the derivative transactions, including withholding tax (update as of 31 Mar 21).Debt Outstanding and Repayment ProfileA s of 31 Mar 21Unit : MMTHBFX: 31.505240,000USD (LHS)THB (LHS)PTT Debt Outstanding N ote: 1. Debt O utstanding for Repayment P rofile represents financial data and portion after derivative swaps2. Bond repayment amounting 3,798 MB in 2022 is TH B swaps to USD and amounting 4,366 M B in 2035 is U S D swaps to TH B10,366140,0007,00040,0004,00020,000-* P TTC10DA (C entury Bonds) is due on 2 Dec 211034
PTT Group Accounting StructureData as of 31 Mar 2021E&P and Gas Business GroupSubsidiariesPTT Exploration & Production Plc.PTT Natural Gas Distribution Co., Ltd.PTT LNG Co., Ltd.PTT Global LNG Co., 100.00%50.00%Joint VenturesTrans Thai-Malaysia (Thailand) Co., Ltd.Trans Thai-Malaysia (Malaysia) Sdn. Bhd.Map Ta Phut A ir Products Company LimitedTTM (T)TTM (M)MA PEquity50.00%50.00%49.00%SubsidiariesPTT International Trading Pte.PTT In
Remark : (*)Refined product from refineries 901 KBD, including domestic supply of LPG from GSPs and Petrochemical Plants 89 KBD (**) Included Inventory . 2020 vs 2019: Pressured petroleum and petrochemical prices from impact of COVID-19 and price war . 801 671 540 706 614 440 839 986 496 371 274 760 871 546 427 397 919 968 561 529 408 .