Transcription
The World’s Best Technical Indicator: The Ichimoku CloudBy Andrew Keene
Table of Contents1) Introduction2) One Small Favor 3) What is the Ichimoku Cloud?4) What are the 6 Components of the Cloud?5) Why should you use the Ichimoku Cloud?6) How do you use the cloud for trading options?7) How do you use the cloud to trade stock?8) What is the BEST way to use the Cloud?9) Cloud Tips10) Advanced Applications of the Cloud11) Recap12) How Can KOTM Help You With Options?13) Top 10 Mistakes Most Traders Make14) Resources
IntroductionModern retail traders have access to more technical studies and indicators than they ever have before.Retail trading platforms now come loaded with all of the latest technical indicators and many even allowtraders to write their own studies and indicators. With so many tools and resources available to traders itcan be difficult to know which indicators will work the best for your trading plan. The majority oftechnical indicators have very specific applications, and usually don’t work the same for every tradingstyle. Another problem with most technical indicators is that they are not forward looking. Mostindicators have some kind of lag built in and often have traders entering and exiting trades either too earlyor too late. One little known indicator called Ichimoku Kinko Hyo, also known as the Ichimoku Cloud,solves these problems.The Ichimoku cloud is our favorite technical indicator. The cloud is one of the only indicators that is bothforward and backward looking. The cloud produces better levels of support and resistance and is abreakout trader’s best friend. The cloud is also one of the easiest indicators to use. Any trader, regardlessof skill level or expertise, can use the cloud to quickly and efficiently analyze any product on any timeframe. The cloud shines in the fact that it can be universally applied to any trading plan by any trader. Inthis eBook we will discuss why we like the cloud so much and how we use it in our proprietary tradingstrategies.I was first introduced to the cloud when traveling through Asia. There I met other traders who used thecloud as their main source of technical analysis. Since then, I have spent time studying the cloud andlearning all of the best applications for the indicator. Although I rarely ever looked at charts when on thetrading floor at the CBOE, the cloud has become an integral part of my trading strategy that I could not dowithout. My goal for this text is illustrate the importance of the cloud and how it has changed the way Itrade. So if you’re interested in learning about the best technical indicator around, please read on.Andrew KeeneAcronym ‘AXK’January 1, 2014
One Small Favor For those who are reading this, I appreciate your time. I believe the following text be worthwhile, andthink this will show in your trading. I feel if it saves you from one losing trade, or if it makes you thinktwice before taking a trade with a poor risk-reward setup, I have done my job.If you feel this to be the case, I ask you to please take 5 minutes in order write a brief review onAmazon.com.
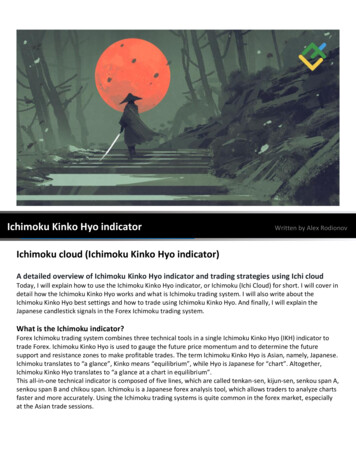
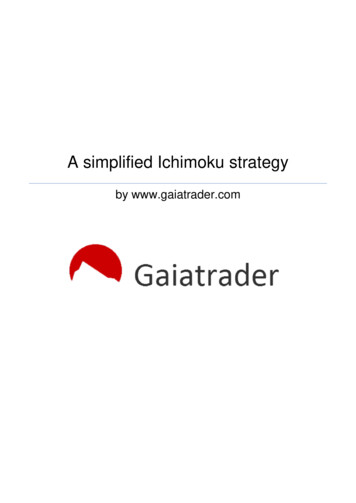
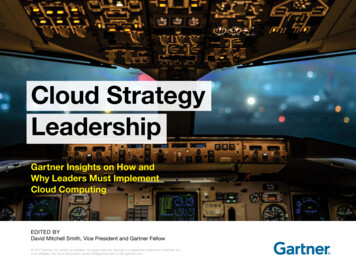
What is the Ichimoku Cloud?The Ichimoku Cloud is a technical indicator I first encountered while traveling through Asia in 2006.Talking shop with other traders I had met I quickly realized that this ‘cloud’ they kept referring to wasdifferent from any other indicator I had ever used. I was also surprised at how simple and intuitive thecloud was to use. While it may look confusing at first the Ichimoku Cloud is actually one of the simplestindicators to use. Before we can approach the actual applications of the cloud, let’s discuss what the cloudactually is.The Ichimoku Cloud is a technical analysis method that uses sets of moving averages to produce keylevels in the past, present, and future. The cloud helps traders identify at a single glance if a security orother financial product is trading in bullish or bearish territory. Ichimoku Kinko Hyo literally translates to‘One Glance Equilibrium Chart’ because it can be used for analysis using only a glance. For this reason,the cloud is one of the most efficient technical indicators available.The cloud is made up of 6 key components, each of which we will examine individually later on. Whenthese 6 components are combined they form the Ichimoku Cloud. Below is an image of the SPDR S&P500 ETF Trust (SPY) on a daily chart with the cloud overlaid. We can use the cloud to identify key levelsof support and resistance, determine trend, and determine the strength of the trend.As can be seen in the image below the cloud is actually a forward-looking indicator. The cloud isprojected 26 periods forward so the levels under the current price were formed 26 days ago. The cloud isunique in this fact that is uses both past data and forward-looking levels. Since the levels are forwardlooking they tend to be more reliable than simple moving averages. The lagging indicator component alsoprovides confirmation of breakouts by looking 26 periods back to determine if a stock is likely to breakthrough levels. It is this concept of looking at the past, present and future that makes the cloud sovaluable. In the next chapter we will look at the individual components of the cloud and how they arecalculated
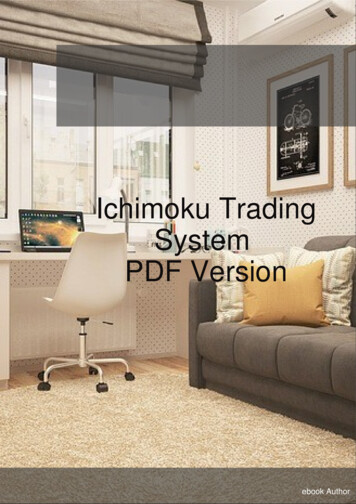
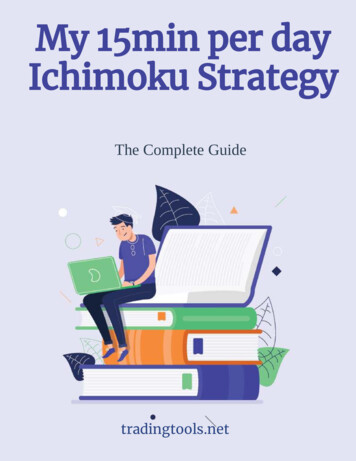
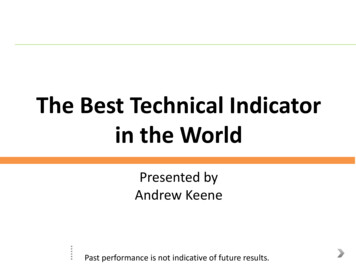
What are the 6 Components of the Cloud?The Ichimoku Cloud is made up of 6 individual components. Each is calculated and plotted differentlyand each one tells us something different. Here we will discuss how each component is calculated andwhat it is used for.The 6 components:1. The Tenken-Sen Line2. The Kinjun-Sen Line3. Senkou Span A4. Senkou Span B5. Kumo6. Chinkou Span LineOnce calculated, these pieces form the indicator set known as the Ichimoku Cloud. In the image of theAAPL daily chart shown below, you can see the components clearly labeled.ChinkouSpanLineTenken- ‐SenLineSenkouSpanAKumoKinjun- ‐SenLineSenkouSpanB
Calculating the Individual Components:The Tenken-Sen Line: Short term trend line similar to a 10 period moving average. It is known as theturning line and is a signal of a region of minor support or resistance. This component is calculated bytaking midpoint between the highest high and the lowest low over the past 9 periods.The Kinjun-Sen Line: Known as the confirmation line. This component also serves as a signal forsupport and resistance levels. Many traders use this line as a level for a trailing stop. It also serves as anindicator of trend. If price is above the Kinjun-Sen Line then the stock is in bullish territory, likewise if itis below the line it is in bearish territory. This line is calculated by taking the midpoint between thehighest high and the lowest low over the past 26 periods.Senkou Span A: This line forms one of the boundaries of the ‘cloud.’ If the stock is trading above theline then the line will serve as a major support level. If price is below this line it will serve as a level ofmajor resistance. This component is calculated by taking the average of the Tenkan-Sen and Kinjun-Senlines. This line is unique in that the results of this calculation are plotted 26 periods ahead. This meansthat today’s Senkou Span A line was actually plotted 26 days ago.Senkou Span B: This line forms the other boundary of the ‘cloud.’ This line serves as a second level ofsupport or resistance and is calculated by taking the midpoint between the highest high and the lowest lowover the past 52 periods. Like the Senkou Span A line, this is also plotted 26 periods ahead. This line issimilar to a 50% Fibonacci retracement.Kumo: This is the shaded area, located between the Senkou Span A and Senkou Span B lines, that is usedto form ‘the cloud’ itself.Chinkou Span Line: This line is also known as the lagging indicator. This line is the current bar’sclosing price plotted 26 periods back. The lagging indicator is often used as confirmation of signals andcan also serve as a support and resistance level. The lagging indicator can also assist a trader inconfirming the direction and strength of trends.Now that we know how each individual component works, we can discuss how they are used together in atrading plan, and how it is you will want to incorporate the Ichimoku Cloud
Why Should You Use the Ichimoku Cloud?With so many indicators included in charting packages why should a trader focus on only one like theIchimoku Cloud? In reality, the answer to that question is rather simple. I believe the Cloud is the bestindicator in the whole world and is more effective than any other signal. The cloud is unique in the factthat it has current, past and future components that can be used as key levels or to project potential futureprice action. Although this is the main reason I love the cloud so much, there are other important reasonsas well.One of the best things about the cloud is that not very many people know how to use it. Everyone usesBollinger bands and moving averages but the cloud is used far less in practice. Why is this a good thingyou might ask? In the age of algorithmic trading, many high-frequency trading firms will try and run thestops of weaker traders. They target levels based on where they believe people will have stops in place.Since people tend to put stops in at levels derived from other, more common studies, it is easier for thehigh-frequency trader to take them out. If a trader uses the cloud to set stops and targets it is not likelythere are a lot of other traders at those same levels. This means that my stops won’t be targeted as muchas they would if I used more popular studies.The cloud is also one of the only indicators I know of that is forward looking. This fact that the cloud isprojected 26 periods into the future means that it will signal earlier than any indicator that is not forwardlooking. The slope and thickness of the future cloud also tells me how strong the trend is and can alsoprovide an early warning when a trend is about to reverse. We can use the forward projections of thecloud to time entries and exits as well.I also like the cloud because it takes into account much more data than simple or exponential movingaverages do. This means that the cloud produces much clearer levels of support and resistance. Again, thisis a good thing when I am using the cloud to set profit targets or stops.The flexibility of the Ichimoku Cloud is also one of its greatest qualities. The cloud is applicable to anyproduct on any time frame. This means that any trader can use the cloud effectively. The cloud can beused for trading stock, options, futures, and currencies. All of the products will have a time frame thatthey work best on, but the cloud can be used to trade any of them. Later on we will discuss what timeframes work best for what asset classes.These are all great reasons to use the cloud, but the by far best reason by is that the cloud is very effective.I wouldn’t use it if it didn’t work and after years of trading with the cloud, I am still profitable. This ishands down the number one reason I use the cloud and you should too, to make money.
How Do I Use the Cloud to Trade Options?I have been trading equity options for the past 12 years. While I often trade stock and other products likecurrencies and futures, I still consider equity options to be my bread and butter. When on the trading floorI didn’t use charts. I would focus all of my attention on order flow and implied volatility. After I left thefloor and moved upstairs I realized that my trading plan would benefit from an addition of technicalanalysis. The Ichimoku Cloud has proven itself to be the most effective technical indicator I can use as anoptions trader. Here we will discuss how I apply the cloud to my proprietary trading plans and why itworks so well.As an options trader I base the vast majority of my trades on what I call ‘unusual option activity.’Unusual option activity is a large block trade that takes place at a multiple above the average daily optionvolume in a specific stock. These unusually large trades are placed by large institutional marketparticipants and can represent the flow of the ‘smart’ money in the options market. Simply put if I see biginstitutional players betting heavily on upside or downside in a specific stock I try and follow that trade.The key to trading unusual option activity is being able to infer what, if anything, the institutional trader’sunderlying stock position might be. Remember that the majority of options market participants arehedgers. This means that orders cannot always be taken at face value. If I see a large put buyer it’spossible they are hedging a large long stock position rather than trying to get short. Likewise, when I seecalls being bought it is possible the trader is hedging a short stock position rather than trying to get long.Determining if a bet is speculative or a hedge is my number one goal when trading unusual optionactivity, and the Ichimoku Cloud helps me do this.The cloud is an excellent indicator of trend and the strength of the trend, so when I am trying to determinethe motives behind a large block trade I see the cloud as being extremely helpful. If the cloud is indicatinga strong bullish trend in a stock that I see puts being bought in, it is much more likely the institutionaltrader is hedging a long stock position. When I trying to determine if a trade is speculation or a hedge Ineed to perform my analysis very quickly, in a matter of seconds. The cloud helps with this as well.Thousands of trades hit the tape in any given day so I am constantly looking at charts of stocks I amseeing action in. Being able to determine if a stock is in bullish or bearish territory at a single glance isessential to being able to analyze stocks very quickly. So my use of the cloud for trading unusual optionsactivity really boils down to a single concept: if institutional traders are buying puts in a stock above thecloud, I do not want to get short. Alternatively, if they are buying calls in a stock below the cloud, I donot want to get long.Using the cloud to weed out all of the false signals and traps has greatly increased the profitability of mytrading plan. The cloud helps guide me into the best possible set ups. While I’ve given only a handful ofexamples of how I apply the cloud to my trading plan, I truly believe the cloud is versatile enough towork for anyone.Next we will talk about how I use the cloud to trade stock and what the best setups are and how you canidentify them.
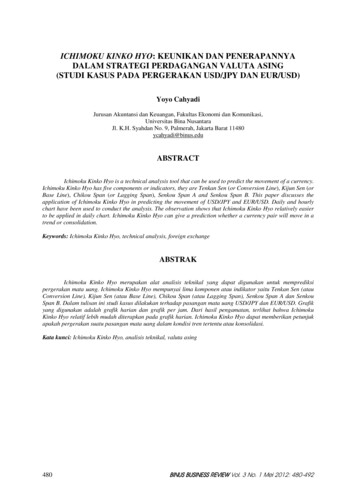
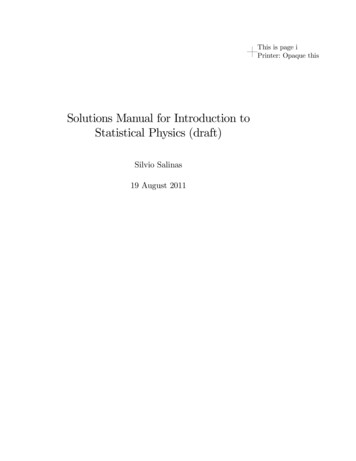
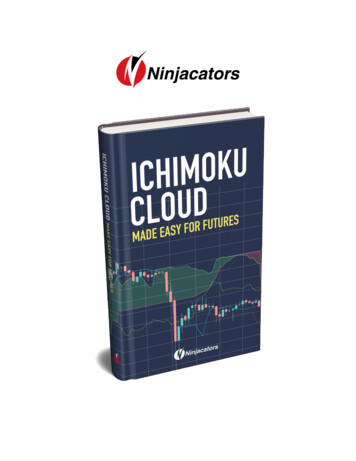
How Do You Use the Cloud to Trade Stock?When using the Ichimoku Cloud to trade stock one of the most important considerations I must make isdeciding what time frame I must use. Generally, I believe stock trades best with the cloud on the dailychart. This is not to say intraday equity traders cannot still use the Cloud successfully. However, it willproduce more traps when used on tighter time framesThe cloud for the day trader: Using the cloud on an intraday basis can show a trader where intradaylevels of support and resistance are. A day trader can also use the cloud to find the highest probabilitysetups.The cloud for the swing trader: Using the cloud can help the swing trader avoid trading against trendsand can help steer them away from stocks that are in neutral territory. Using the cloud can also point themto stocks that are near breakout points.The cloud for the long-term trader: Using cloud pullbacks can point out opportunities to enter or add topositions. The long-term trader can use the cloud to determine when it is time to exit a position. Since thecloud is forward looking, the cloud can also give a heads up before trend might turn the other way.No matter which of the above categories you might fall into, you will be able to benefit from using thecloud. As a trader I mostly fall mostly into the first to categories. Most of my stock trades are either daytrades or swing trades. Using a shorter time frame may change the way I use the cloud but the basicconcepts stay the same. I use the support and resistance levels the cloud provides as levels for stops orprofit targets. The cloud also tells me when I should enter or exit a trade. Look at the image below andtake note how the cloud provides me with my entry and a level to place a trailing stop.
trailingattheTenken- ‐SenLineThese same levels can be used on any time frame. The chart above is showing AAPL stock on a dailychart, but I would be looking for the same things on a 15, 5, or even 1-minute chart. The time frame I’musing can also depend on the product I am trading. Some securities trade much faster than others andrequire a shorter time period chart. Likewise, some securities are slower and produce too many traps on alower time frame chart. In the next section we will discuss how to determine the best ways to use thecloud no matter what product you are trading.
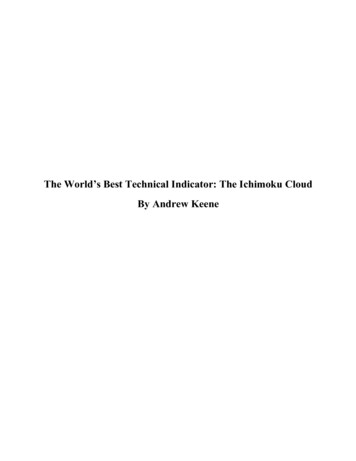
What Is The BEST Way To Use The Cloud?As we have explained previously, the cloud is one of the most versatile technical indicators available. Itsapplications are wide and as long as a trader realizes what the best uses are for the cloud they can easilyapply it to their trading plan. Even though the cloud can be used for trading any security it is not a ‘onesize fits all,’ indicator. If used on a less than optimal time frame for a specific product, the cloud canproduce many traps. A trader must always consider what they are trading and how fast that security tendsto trade. Below we will explain the use of the cloud in several of the more popular products traders trade.Stocks- The best signals come from the daily chart. Using the daily chart will provide the best setups forswing traders and longer-term players. Stocks can still be day traded using the cloud, but on an intradaytime frame using anything faster than a 15-minute chart will produce many traps.Currencies and Currency Futures- Trade best on a 4-hour bar. Currencies trade very well on the cloudbut as with equities, the cloud produces the best signals on a longer time frame. The cloud can be used forintraday trading of currencies but using anything faster than a 15-minute chart will have the potential toproduce many traps.Crude Oil Futures- Trade very fast. When trading crude oil futures or any other fast moving product wecan still use the cloud on shorter time frames. A trader can use a chart as fast as the 5-minute bar and stillbe effective with the cloud.Treasury Futures- Treasury Futures often trend well intraday. A trader can use the cloud very well whentrading these. Time frame depends on the specific product being traded. In general products that tend totrend rather than sit in a range are the best products to trade on the cloud.As can be seen above there are several considerations a trader must make when using the cloud. Thecloud can be used on any product, but in general we want to focus on trending products. Keep in mindthat one security might trade differently on a different time frame, and we must always consider this whenusing the cloud.In the image below we can see how, on the daily chart, the cloud provided multiple opportunities to shortGLD.Ashortofanytestofthekinjun- ‐senortenkan- hetradeuntilthispoint
RecapWe always say that there are no shortcuts in this game. There is no such thing as a sure thing. All wehope for is a way to increase our chances of success. After more than a decade of trading experience Ihave learned exactly what tools I am able to make the most of and which strategies and resources don’twork for me. When I say the Ichimoku Cloud is my hands-down, most favorite technical indicator I amnot joking. I’ve been using it for years and regret having not discovered it earlier in my career. It is one ofthe most versatile tools a trader can have access to and its ease of use and overall accessibility make it agreat resource for traders of all skill levels.
How Can KOTM Help Me?Since founding KeeneOnTheMarket.com in February 2012, I’ve been overwhelmed by the positivefeedback and response I’ve received since. Business is booming, which is great, because I love helpingtraders improve their P&L through setting up better risk versus reward trades. Everyday in the office, theother traders and I discuss strategies, options set-ups, and reasons why we did or didn’t take certaintrades. KOTM began as a blog, but I realized I wasn’t just content with sharing my market commentary.After all the monetary success options brought me, I wanted to help others stop losing money at the veryleast. One statistics says the average lifespan of a day trader is 18 months (meaning afterwards they blowout their account). Another states that ’90 percent of traders lose money.’ Both are very troubling to me,but how can the latter be true if every option has a buyer and a seller, and it is a zero sum game? Onereason is common mistakes made by many traders, which I have outlined in the next session.Live Trading RoomOpen daily from 8AM- 3:30 PM daily, but never closed. We have audio and visual with marketcommentary and live trading for all experience levels for 6 hours. We have traders who trade equities,options, ETFs, futures, and forex. Imagine being able to ask Tiger Woods which club he would use foryour next shot or what he thinks of the wind direction. I’m available all day to answer questions in thepublic member chat forum, or via private message. I’m here to share expertise and offer my take onanything from charting to risk-reward setups, or even implied volatility.Trade AlertsOur most popular product. I love twitter and love to tweet, some days I tweet as many as 200 times.Every day I watch 2,000 options trades as they hit all the exchanges, and analyze them to see if I believethe institution behind the trade has an ‘edge,’ or access to information I do not know about. I tweet outall my trades, the best bullish and bearish setups each day, as well as the most unusual options activity.Basically, I break these 2,000 trades down into the best possible 20 trades, while taking 2-8 trades dailybased on the best set-ups I see.
Courses & WorkshopsWe are currently finalizing the most comprehensive equity option curriculum available anywhere. Thisincludes my three proprietary trading plans, over 500 PowerPoint slides, and over 25 hours of video.Mentoring & CoachingWe currently offer both 1 on 1 Mentoring and Coaching via Skype and have a Chicago Boot Camp,which includes tours of the CBOE and Board of Trade trading floors, along with a night out with TeamKOTM.Please contact me at Andrew@KeeneOnTheMarket.com anytime for assistance with your individualtrading plan. Also, be sure to check our blog at www.keeneonthemarket.com for daily updates on eachday’s biggest unusual options activity and my daily market recap videos. Thanks again for taking thetime to read this, and look forward to hearing from you soon.Ichimoku Cloud Training ResourcesKeeneOntheMarket.com Six Setups Using The Ichimoku Cloud WorkshopThis is a live course that is taught by our head trader Andrew Keene. Over 2hrs long this course is taughtlive via the web and lets members see first-hand how Andrew uses the cloud in a successful trading plan.All of the best set ups and most common pitfalls to trading with the cloud will be explained in detail andreal life examples are used. This is easily the best way for a trader to get a solid understanding of theIchimoku Cloud and its most practical uses.You Can Click Here To Register
What Are The Top 10 Easily Avoidable Mistakes Most Traders Consistently Make?1. Not Dollar Weighting Their Portfolio-Realizing that being long 100 Shares of AAPL at 450 is different than being long 100shares of FB at 29. Dollar weighted would show that 100 Shares of AAPL is 1500Shares of FB2. Adding to Losing Positions-Adding to losing positions unless at a predetermined level is a big mistake, and usuallydoesn’t work out.3. Moving a Stop Loss Point-As the expression goes, ‘your first instinct is your best instinct.’ This can also be read,‘never move a stop,’ and following this practice will help you avoid losses from building.4. Buying too much premium before Earnings- So many traders are long too much premium going into earnings, and lose money evenif they are correct on direction because of the ‘vol crush.’5. Not Managing Trades at Expiration- Everyone’s goal should be to not own stock or be assigned at expiration. Remember, 0.02 can make the difference between a long or short stock position at expiration.6. Pin Risk- By buying cheap options close to where stock settles, you can avoid having to worryabout another trader exercising an option on you.7. Always define risk vs. reward- Everyone should know the risk-reward setup of every trade they are putting on. Ifyou’re not sure of this for a trade, then you shouldn’t be making it.8. Connie Contra trend- It is very hard to trade against the trend. If a trader is trading against the trend, theymust be sure to have a HUGE reward vs. risk set-up.9. Waiting too long to close Positions- If I sell a 2.50 Call Spread for 1.50 and it moves to 0.10, my risk vs. reward has nowchanged as well. Now, I am risking 2.40 to make .10, so closing position like thismakes sense.10. Selling Cheap Call Spreads or Put Spreads-Selling a 2.50 Call Spread for 0.20 might have a small delta, but if you win on 9 andlose on the 10th, your P&L will all be wiped away. I try to get at least a third of theSpreads Price
Other ResourcesKeeneOntheMarket.com Six Setups Using The Ichimoku Cloud WorkshopThis is a live course that is taught by our head trader Andrew Keene. Over 2hrs long this course is taughtlive via the web and lets members see first-hand how Andrew uses the cloud in a successful trading plan.All of the best set ups and most common pitfalls to trading with the cloud will be explained in detail andreal life examples are used. This is easily the best way for a trader to get a solid understanding of theIchimoku Cloud and its most practical uses.You Can Click Here To RegisterThinkOrSwimThinkOrSwim (TOS) is by far the best trading platform for a retail trader of any skill level. The amountof information and analysis available on the platform is staggering. The ability to trade equities, equityoptions, currencies, futures and options on futures is seamlessly integrated into the platform. Built to beintuitive, the platform is accessible to traders of any skill level and offers professional level chartingoptions. Any retail trader not using the TOS platform is giving up an edge that is extremely valuable toany trader.You can open an account by clicking hereCBOE Options HubCBOE Options Hub is the Chicago Board Options Exchange’s for investors and traders to review optionstrading information. Go to www.cboeoptionshub.com to find information about new products, corporateannouncements, blog posts, tweets, investor relations, The Options Institute and much more.FinancialJuiceFinancialJuice is a real-time news and social network focused on the trading/investing news space. Basedin London, UK, their team works in conjunction with partners to provide an unparalleled level of realtime content for traders to make informed and fast strategic investment and trading decisions. It isessentially the Bloomberg Terminal meets Twitter/Facebook.Options PlaybookOptions Playbook provides the novice trader with all of the information they need to begin tradingadvanced order strategies. The Options Playbook does an excellent job of explaining how to set updifferent options spreads and how to calculate your risk, reward, and breakeven. Understanding theseconcepts is extremely important to any options trader. The Options Playbook will be a valuable resourceto the novice trader.
The Ichimoku Cloud is a technical analysis method that uses sets of moving averages to produce key levels in the past, present, and future. The cloud helps traders identify at a single glance if a security or other financial product is trading in bullish or bear