Transcription
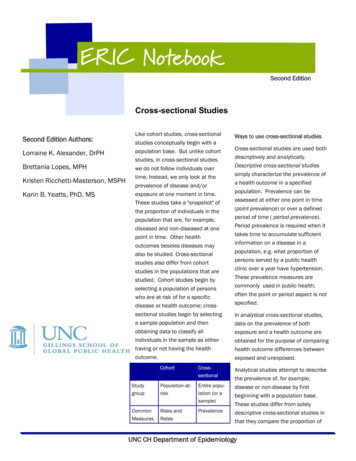
ERIC NOTEBOOK SERIESSecond EditionCross-sectional StudiesSecond Edition Authors:Lorraine K. Alexander, DrPHBrettania Lopes, MPHKristen Ricchetti-Masterson, MSPHKarin B. Yeatts, PhD, MSLike cohort studies, cross-sectionalstudies conceptually begin with apopulation base. But unlike cohortstudies, in cross-sectional studieswe do not follow individuals overtime. Instead, we only look at theprevalence of disease and/orexposure at one moment in time.These studies take a "snapshot" ofthe proportion of individuals in thepopulation that are, for example,diseased and non-diseased at onepoint in time. Other healthoutcomes besides diseases mayalso be studied. Cross-sectionalstudies also differ from cohortstudies in the populations that arestudied. Cohort studies begin byselecting a population of personswho are at risk of for a specificdisease or health outcome; crosssectional studies begin by selectinga sample population and thenobtaining data to classify allindividuals in the sample as eitherhaving or not having the tion-atriskEntire population (or asample)CommonMeasuresRisks andRatesPrevalenceWays to use cross-sectional studiesCross-sectional studies are used bothdescriptively and analytically.Descriptive cross-sectional studiessimply characterize the prevalence ofa health outcome in a specifiedpopulation. Prevalence can beassessed at either one point in time(point prevalence) or over a definedperiod of time ( period prevalence).Period prevalence is required when ittakes time to accumulate sufficientinformation on a disease in apopulation, e.g. what proportion ofpersons served by a public healthclinic over a year have hypertension.These prevalence measures arecommonly used in public health;often the point or period aspect is notspecified.In analytical cross-sectional studies,data on the prevalence of bothexposure and a health outcome areobtained for the purpose of comparinghealth outcome differences betweenexposed and unexposed.Analytical studies attempt to describethe prevalence of, for example,disease or non-disease by firstbeginning with a population base.These studies differ from solelydescriptive cross-sectional studies inthat they compare the proportion ofERIC at the UNC CH Department of Epidemiology Medical Center
ERIC NOTEBOOKPA G E 2exposed persons who are diseased (a/(a b)) with theproportion of non-exposed persons who are diseased (c/(c d)).Calculating prevalenceThe prevalence of a health outcome is simply theproportion of individuals with the health outcome in apopulation.Prevalence cases / total populationFor the following example, two different sub-measures ofprevalence can be calculated: the prevalence of coronaryheart disease (CHD) among the exposed (people who arenot active) and the prevalence of CHD among theunexposed.time for the case-control study. The PR is similar to a RRwhen the outcome occurs over a short period of time. Forexample, one would calculate a prevalence ratio for anacute outbreak of tuberculosis in a prison population.This is in contrast to calculating the overall prevalence ofpositive tuberculin skin tests among the prisoners.The prevalence ratio can also be calculated from theinformation on CHD and physical activity. It is preferableto calculate the prevalence odds ratio when the period forbeing at risk of developing the outcome extends over aconsiderable time (months to years) as it does in thisexample:PR (a/N1) / (c/N0)PR (50/250) / (50/750) 3.0PresentCHD50aAbsent CHDTotalIn this case, a prevalence ratio of 3.0 can be interpretedto mean that the proportion of people with CHD is 3-foldgreater if a person is not physically active.b200250POR vs. PRActive50d700750Total1009001000For chronic disease studies or studies of long-lasting riskfactors, POR is the preferred measure of association incross-sectional studies. For acute disease studies, PR isthe preferred measure of association. If the prevalence ofdisease is low, i.e. 10% or less in exposed and unexposedpopulations, POR PR. Since cross-sectional studies areparticularly useful for investigating chronic diseases (e.g.prevalence of AIDS) where the onset of disease is difficultto determine, or for studying long lasting risk factors (suchas smoking, hypertension, and high fat diets), theprevalence odds ratio will generally be the preferredmeasure of association.Example:Not activecP1 a/a b 50/250 20.0% prevalence ofCHD among people who are not active.P0 c/c d 50/750 6.7% prevalence ofCHD among people who are active.The prevalence odds ratioThe prevalence odds ratio (POR) is calculated in the samemanner as the odds ratio.POR ad / bcLimitations of cross-sectional studies to evaluate riskRecall that, under steady conditions, the prevalence ofdisease is influenced both by incidence and duration ofdisease (or survival with disease).The prevalence ratioThe prevalence ratio (PR) is analogous to the risk ratio (RR)of cohort studies. The denominators for both ratios arefixed populations – fixed at the start of the study in thecase of a cohort study, and fixed at the point or period ofPrevalence Rate x Average Duration of DiseaseERIC at the UNC CH Department of Epidemiology Medical Center
ERIC NOTEBOOKPersons who survive longer with a disease will have ahigher probability of being counted in the numerator of aprevalence proportion. Short-term survivors will be lesslikely to be counted as a case. Incidence is influenced onlyby exposure, whereas prevalence is influenced both byexposure and duration of disease.If exposure influences survival time, then the POR or PRwill not provide a valid estimate of the risk ratio or rateratio. Thus, the interpretation of the POR or PR is subjectto survival bias.Even if incidence remains constant, either animprovement in disease treatment (that results in highercure rates) or increased lethality (resulting in a higher casefatality rate) will result in decreased prevalence. Thedisease itself or the threat of developing the disease maycause outmigration of cases from an environmentperceived as causing disease, e.g. workers affected bytoxic exposures in a plant may quit, while more resistantworkers will stay. This selective migration can biasmeasures of prevalence.Other problems with interpretation of cross-sectionalstudiesCross-sectional studies as well as case-control studies areaffected by the antecedent-consequent bias, similar to thechicken and egg question (i.e. “which came first?”). Thisbias occurs when it cannot be determined that exposurepreceded disease, since both are ascertained at the sametime (unlike cohort studies or clinical trials). Antecedentconsequent bias does not affect cohort studies becausesubjects in cohort studies are selected for study becausethey are disease-free. Exposure is actually observed toprecede disease only in a cohort design, includingrandomized trials.Uses of cross-sectional studiesPA G E 3Descriptive cross-sectional studies are widely used toestimate the occurrence of risk factors in segments of thepopulation characterized by age, sex, race orsocioeconomic status (SES). National examples of crosssectional studies of great importance are the decennialcensus and the National Health and Nutrition Surveys(NHANES). Opinion polls and political polls are basicallycross-sectional studies. Surveillance of changes insmoking habits or of other behavioral risk factors aresequential cross-sectional studies. The US NationalHealth and Nutrition Examination Survey (NHANES) is onesuch example Similarly, surveillance of long lastingdiseases such as AIDS is cross-sectional. Descriptivecross-sectional studies are useful for planning oradministering preventive or health care services,surveillance programs, and surveys and polls.Descriptive/analytical cross-sectional studies are usefulfor establishing preliminary evidence for a causalrelationship. These studies are also useful for examiningthe association between exposure and disease onset forchronic diseases where researchers lack information ontime of onset. Examples might include diet and arthritis,smoking and chronic bronchitis, and asthma andexposure to air pollution. Interpretation requires cautionregarding potential association of duration of disease withexposure status (survival bias).Survival bias may be minimized if information can beobtained on exposures that clearly preceded the firstsymptoms of a chronic disease such as arthritis, diabetes,or chronic bronchitis. This depends on access to medicalrecords before the onset of a chronic disease. In addition,it may be necessary to have historical records on anindividual’s exposure status prior to these first medicalvisits, e.g. where the person lived or where the person wasemployed.Descriptive studies are an important method to evaluatethe proportion of a population with disease or with riskfactors for disease, such as the prevalence of asthma inchildren or the prevalence of elevated blood lead intoddlers.ERIC at the UNC CH Department of Epidemiology Medical Center
ERIC NOTEBOOKPA G E 4AcknowledgementTerminologyAntecedent-consequent bias: occurs in crosssectional studies when it cannot be determined ifexposure preceded disease.Prevalence: the proportion of diseased individuals ina population.Survival bias: occurs in cross-sectional studies whenthe exposure influences survival time, and thedistribution of that exposure will be distorted among asample of survivors. (a.k.a. Neyman bias, incidenceprevalence bias, or selective survival bias)The authors of the Second Edition of the ERIC Notebookwould like to acknowledge the authors of t heERIC N ot ebook, First Edition: Michel Ib rahim ,MD, PhD, Lorraine Alexander, DrPH, Carl Shy,MD, DrPH, Gayle Shimokura, MSPH and SherryFarr, GRA, Departm ent of Epidem iology at theUnivers it y of N ort h Carolina at Chapel Hill. TheFirst Edit ion of the ERIC Notebook wasproduced b y the Educational Arm of t heEpidem iologic Research and Information Cent erat Durham , N C. The funding for t he ERICN ot eb ook First Edit ion was provided b y t heDepartm ent of V et erans Affairs (DV A), V et eransHealt h Adm inist rat ion (V HA), Cooperat iveSt udies Program (CSP) to prom ot e the s t rat egicgrowt h of the epidemiologic capacit y of t heDV A.Practice QuestionsResources:Answers are located at the end of this notebookDelgado-Rodriguez M and Llorca J. J Epidemiol CommunityHealth. 2004;58:635–641.Dr. Carl M. Shy, Epidemiology 160/600 Introduction toEpidemiology for Public Health course lectures, 19942001, The University of North Carolina at Chapel Hill,Department of Epidemiology1) Which of the following health outcomes could bestudied using a cross-sectional study design? Choose allthat apply.a) The prevalence of diabetes among adults in the UnitedStates in 2014b) The prevalence of diabetes among all patients seen at aparticular health clinic on one day in 2014c) The number of new cases of diabetes diagnosed amongat risk adults in the United States in 2014d) The number of people in a population with diabetes whoare obese and the number of people in a population withdiabetes who are not obese, in the United States in 20142) Researchers are studying HIV prevalence using a crosssectional study design. Which of the following factors mayaffect the researchers’ assessment of HIV prevalence intheir study population? Choose all that apply.a) Changes in HIV treatmentb) Changes in HIV virulence (HIV virulence refers to theability of the virus to cause disease)c) Population changes (e.g. migration) due to HIVinfection, for example people who leave their communityto live closer to physicians specialized in treating HIVd) Other factors which may affect survival of HIV-infectedpersons (e.g. changes in healthcare practices)e) Changes in HIV diagnosticsf) Changes in HIV awareness and educationRothman KJ, Greenland S. Modern Epidemiology. SecondEdition. Philadelphia: Lippincott Williams and Wilkins,1998.The University of North Carolina at Chapel Hill, Departmentof Epidemiology Courses: Epidemiology 710,Fundamentals of Epidemiology course lectures, 20092013, and Epidemiology 718, Epidemiologic Analysis ofBinary Data course lectures, 2009-2013.Answers to Practice Questions1. Answer choices a, b and d are correct. A cross-sectionalstudy design could be used to assess the prevalence ofdiabetes among adults in the United States in 2014. Across-sectional study design could also be used to assessthe prevalence of diabetes among all patients seen at aparticular health clinic on one day in 2014 by simplyrecording which patients are known to have beendiagnosed with diabetes divided by the number of totalpatients seen that day. However, the number of new casesof diabetes diagnosed among at risk adults in the UnitedERIC at the UNC CH Department of Epidemiology Medical Center
ERIC NOTEBOOKPA G E 5States in 2014 could not be assessed using a crosssectional study. The incidence of new cases cannot bemeasured using a cross-sectional “snapshot” in timedesign. Instead, a cohort study could be used to follow atrisk participants over time to see which people were newlydiagnosed with diabetes in 2014. The number of peoplein a population with diabetes who are obese and thenumber of people in a population with diabetes who arenot obese could be assessed using a cross-sectionaldesign, this would be an example of an analytical crosssectional study.2. Answer choices b, c, d, e and f are correct. Changes inHIV virulence could affect HIV-related mortality (survivaltime) and, thus, would affect prevalence. Any other factorswhich affect survival of HIV-infected persons would alsoaffect prevalence. Migration could also affect assessmentof HIV prevalence if people migrate in or out of the studyarea based on their HIV status. Changes in HIVdiagnostics could affect the timing of HIV diagnosis and/orhow likely people are to get tested and, thus, could affectprevalence. Answer choice a is not correct because HIV isnot a curable disease. HIV treatment may help an HIVinfected person live longer but will not affect whether ornot they have HIV. Therefore, HIV prevalence is notaffected by HIV treatment. Note that if a disease wascurable with treatment then that disease’s prevalencecould be affected by treatment.ERIC at the UNC CH Department of Epidemiology Medical Center
2013, and Epidemiology 718, Epidemiologic Analysis of Binary Data course lectures, 2009-2013. Answers to Practice Questions 1. Answer choices a, b and d are correct. A cross-sectional study design could be used to assess the prevalence of diabetes among adults in the United States in 2014. A cross-sectional study design could also be used to assess