Transcription
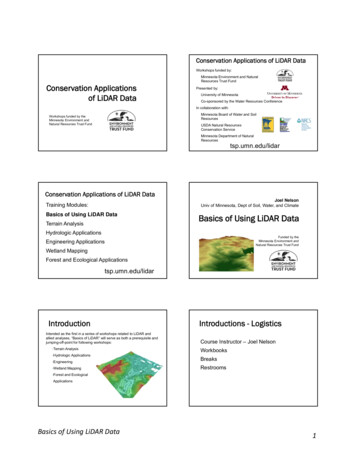
Conservation Applications of LiDAR DataWorkshops funded by:Minnesota Environment and NaturalResources Trust FundConservation Applicationsof LiDAR DataPresented by:University of MinnesotaCo-sponsored by the Water Resources ConferenceIn collaboration with:Minnesota Board of Water and SoilResourcesWorkshops funded by theMinnesota Environment andNatural Resources Trust FundUSDA Natural ResourcesConservation ServiceMinnesota Department of NaturalResourcestsp.umn.edu/lidarConservation Applications of LiDAR DataJoel NelsonUniv of Minnesota, Dept of Soil, Water, and ClimateTraining Modules:Basics of Using LiDAR DataTerrain AnalysisBasics of Using LiDAR DataHydrologic ApplicationsFunded by theMinnesota Environment andNatural Resources Trust FundEngineering ApplicationsWetland MappingForest and Ecological Applicationstsp.umn.edu/lidarIntroductionIntended as the first in a series of workshops related to LiDAR andallied analyses, “Basics of LiDAR” will serve as both a prerequisite andjumping-off-point for following workshops: Terrain Analysis HydrologicApplications Engineering Wetland ForestMappingIntroductions - LogisticsCourse Instructor – Joel NelsonWorkbooksBreaksRestroomsand EcologicalApplicationsBasics of Using LiDAR Data1
Introductions – Student IntrosCourse ObjectivesStudentsLecture and Hands-on Format Who uses ArcGIS 10? Raster Data Who uses LiDAR data currently? What is LiDAR? Who calculates products or does rasterprocessing from LiDAR data? LiDAR ProductsLecture 1 – Raster DataAbout Raster DataCredit – Tim Loesch - MNDNRRaster Data Less used today than thevector data model Raster environment andprinciples not as wellunderstood Raster DataStructure/ModelMost users familiar withaerial photos or satelliteimagery Regular set of cells in agrid pattern Typically square Attribute valuesassociated with eachlocation (cell) Models “continuous”data wellKey featuresCredit – IBMBasics of Using LiDAR Data Cell size UnitsCredit – ESRI2
Raster Data Analysis - Advantages History FlexibleRaster Data Analysis – Disadvantages Tradeoff – higher Data structureresolution comes atgreater storage costand speed ofprocessing Wide range of variables Simple to complex – single cell,networks, groups of cells Well-developed Wide variety of applications Precision limited to cellsizeContinuous Data – i.e. elevation “Stairstep” edges Often assigned a single“value” for a singleattribute rather than ahost of attributes percellCredit – ESRIRaster Data Analysis - Map AlgebraRaster Data Analysis Credit – ESRIMap Algebra – Raster CalculatorBasic to complexMathematical (MapAlgebra), neighborhood(moving window)distance, surface,statistical, etc. Raster layers combined viamathematical combinations Cell-by-cell – added, subtracted,divided, or multipliedVariety of usesCredit – ESRI Change detection – e.g. year 2000data subtracted from year 2010data Terrain attributes – e.g. SPI –multiply effect of one variable byanotherCredit – ESRIRaster Data AnalysisNeighborhood FunctionsMoving window of cellsswept across all raster cells,typically multiplying valuesby data found around centercell Very common in rasteranalysis Slope, hillshade, filter, andkriging calculations forexample, all employ amoving-window approach Basics of Using LiDAR DataWorking with RasterData3
Working in the Raster EnvironmentRaster Grid File Structure Grid Alignment Resampling AggregationGrid AlignmentProper Grid Alignment Snap Raster SettingsSnap Raster SettingArc GRIDS are notsingle files Several folders withassociated files Linked – cannotwork independentof one another Use ArcCatalog tocopy, move orrename Can export intovariety of single filetypes - .img, .e00,etc.VS.Resolution The cells in theoutput raster arealigned with the cellsof the snap raster. The lower-left cornerof the extent issnapped to a cellcorner of the snapraster. The output cell sizeis same as the snapraster cell size.Credit – Sean Vaughn- MNDNRFile StructureCell size should be same for all inputsIf not Nearest neighbor resampling automaticallyoccurs Resampled to coarsest resolution of allinputs Esp. not recommended for continuous data– i.e. ElevationAggregate/Resample Changing theresolution (Upscaling) –if cells evenly divisible,use AGGREGATE If not evenly divisible orchanging thealignment, then useRESAMPLE You can downscale,but this does not createany new informationElevation Data DEMsCredit – Sean Vaughn- MNDNRBasics of Using LiDAR Data4
Raster Elevation Data Sources Stereophotography Topographic Groundmaps (elevation contours)survey (GPS, other) LiDARStereo Photography View shape oftopographic surface Overlapping photographs View from twoperspectives (parallax) Old technology – hasbeen used extensively inSoil Survey and forestryCredit – Steve Kloiber- MNDNRTopographic/Contour DataSurvey GPS survey or TotalStationContour line joins points ofequal elevation Small areas Labor intensive Can interpret slope, relief,shape/size of valleys and hills Very precise Paper and digital Also called contour maps Digital leaves visualizationup to the userCredit – Steve Kloiber - MNDNRRaster Elevation Data FormatsWhat is a DEM?Models of Topography Digital Elevation Model (DEM)Multiple ways of representing elevation Triangulated irregular network Contours (Vector) Digital file that: Contains elevation of terrainover a specified area Is arranged as a fixed-gridinterval over the earth surface Is geo-referenced Can be manipulated to createother elevation-dependentdata products Digital elevation model (Raster)Each has advantages and disadvantagesDEM is used most often for terrain analysisand watershed delineationCredit – Steve Kloiber- MNDNRBasics of Using LiDAR Data5
Digital Elevation Model (DEM) Consists ofpixels or cells Valueassignedrepresentsaverageelevation ofgrid cellCredit – Steve Kloiber- MNDNRDigital Elevation Model (DEM)DEMs are a common way of representing elevation whereevery grid cell is given an elevation value. This allows for veryrapid processing and supports a wide-array of analyses.Credit – Steve Kloiber- MNDNRDEMCharacteristicsResolutionDensity of elevation measurements– Determines level of detail of surface representation– 30m coarse – 1m fine–Effect of Cell Size - ResolutionCoarse ResolutionInterpolationCalculation used to find elevation of unspecifiedlocation– Various techniques/algorithms: Kreiging, TheissenPolygons, Spline, IDW, Bilinear, Nearest Neighbor–Fine ResolutionDEM Resolution TradeoffDEM ComparisonLower resolution faster processingWhy so much interest in LIDAR? Higher resolution data than we ever thoughtpossible Opens up opportunities to describe andcharacterize landscapes in ways previously notfeasibleHigher resolution more precision,maintains small featuresComparison to existing national standard productUSGS DEMLiDAR DEMHorizontal Resolution30 meters 1 meterVertical Resolution7‐15 meters 15 cmContour Interval5‐20 feet1‐3 feetBasics of Using LiDAR DataCoarsetoFine6
LiDAR Derived DEMDEM ComparisonUSGS 30m DEMCell Size: 1 meter sqVertical Error: 15 cm1LiDAR 3m DEM1.5 mil points / sq mile2.5 miUSGS Standard DEMCell Size: 30 meter sqVertical Error: “Equal to orbetter than 15 m.”21600 points / sq mile1Varies based on project specifications2 http://edc.usgs.gov/guides/dem.htmlCredit – Tim Loesch - MNDNRDEM ComparisonLiDAR 3 meter Elevation DataBasics of Using LiDAR DataUSGS 30 meter Elevation DataHillshade DEM3m vs 30m7
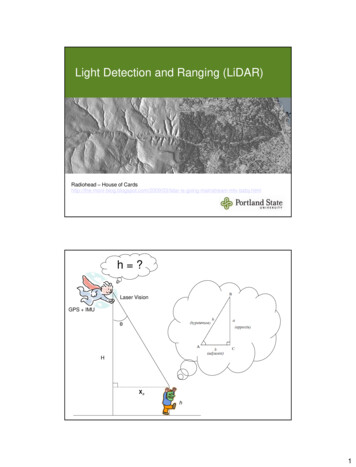
Contour Comparison – Vector ProductEnd of Lecture 1Questions/Comments?2 ft contours createdfrom LIDAR data10 ft contours createdfrom standard 30mDEM dataLecture 2 – What is LiDAR?LiDARWhat is LiDAR? Light Detection AndRanging – a remotesensing system used tocollect topographic data Produces highresolution, accurate,land-elevationinformationCredit – ESRILiDARHow is LiDAR datacollected?Airborne survey: Covers the surface withmultiple discrete laserpulses Up to 150,000 persecond Collects the returnsTime distance GPS LocationLiDAR Survey EquipmentLight Detection andRanging Laser Rangefinder IMU (INS) GPS On board computerProduces accurate landelevation dataCredit - USGSBasics of Using LiDAR Data8
LiDAR Survey EquipmentLaser Rangefinder Inertial Measurement Unit(IMU)Records distance totarget Time * c / 2 Wavelengths differVarious scan ratesPitch Gyroscopes andaccelerometer Records roll, pitch, yaw ofaircraft .005 degree pitch & roll .008 degree heading 1064 nm RollLiDAR Survey EquipmentYawCredit - USGSLiDAR Survey EquipmentLiDAR Survey EquipmentOn board computerGlobal PositioningSystem (GPS) Differentially corrected Provides cm accuracyof aircraft Credit – NASA Records data Laser distance and intensity IMU info GPS infoAllows cm accuracy oflaser pulse Converts into X, Y, Z Millions of points On-board displayCredit - USGSLiDAR Data ResolutionBased on collectiondensity 1 point/meter to 8points/meter with groundcontrol point validationSupports 2 foot contoursto sub 1-foot contoursdepending on collectCredit - USGSLiDAR Products End-product is accurate,with geographicallyregistered longitude,latitude, and elevation(x,y,z) for every data point Several file types andderivative productsavailable to essional/papers/Pap808/p808.htmBasics of Using LiDAR Data LAS point cloud, DEM,contours, hydrologicbreaklines9
LiDAR Data CollectionReturnsLiDAR Returns: Multiple discrete return pulsesLiDAR Intensity: Magnitude or strength-of-return pulseMetadata: Information about how data was collected—READ IT!All returns can be used Forest canopy Intensity image Vegetation mappingSingle ReturnMultiple returnsWaveformReturnsCredit - USGSReturnsSingle ReturnMultiple returnsReturnsSingle Return1st return2nd returnMultiple returns3rd returnWaveformReturnsWaveformReturns4th returnCredit - USGSCredit - USGSIntensityCredit - USGSBasics of Using LiDAR Data Intensity amount ofenergy reflected for eachreturn Different surfaces reflectdifferently based onwavelength of laser Example at 1064nm (NIR),water absorbs, vegetationhighly reflective Can be used to build blackand white near-IR imagesCredit - USGS10
Minnesota Mapping InitiativeIn the beginning .MN LiDAR Data Red River Collect – 2006 Obi Sium – DNR Waters/FEMA Technical Group to developstandardsGovernor’s Council on GeographicInformation HighResolutionElevationData?Digital Elevation Committee Working to achieve publicly available,high accuracy elevation datastatewide Federal, State and CountyrepresentativesMinnesota Mapping InitiativeMinnesota Mapping InitiativeClean Water Fund of the LegacyAmendmentSeveral unsuccessful attempts to securefunding at the state levelWorked with counties to ensure consistent data Technical advice and assistance Standards and accuracyCredit – Tim Loesch - MNDNR Citizens of the state have investedin Water Quality High Resolution Elevation data canbe used for all future water qualityprojectsSecured 5.6 million in funding Funds in Division of EcologicalResources/Waters Project led by ManagementResources/MISCredit – Tim Loesch - MNDNRMinnesota Mapping InitiativeStatewide LiDAR Coordination and CollaborationTwo committees are tasked with LiDAR data development,management, and deploymentMulti-Government Partnership Credit – Tim Loesch - MNDNRUSGS, EPS1. MN Digital Elevation Committee Technical Advice http://www.mngeo.state.mn.us/committee/elevation Potential funding opportunities 2. MN Digital Elevation Committee - Research and EducationMnDOT, MnDNR, MnGEOSubcommittee GIS technical expertise Project management Mission Statement: Design and promote best practices with LiDAR data for Minnesota Ensure Survey and Validation Coordinationthere is consistency in data development, application, and training. Data Coordination esearch education Training:County and Local Governments Course Planning and Design Survey Points and Data validation SurveyCredit – Tim Loesch - MNDNRBasics of Using LiDAR Data11
LiDAR AcquisitionLiDARAcquisitionStandards Defined by the MN DigitalElevation Committee Based on the recent USGSBase LiDAR Specification. 15 centimeter RMSEz. 2-foot vertical accuracy (95% confidence). 1-meter horizontal accuracy.Coordinate system UTM Zone 15, NAD83 horizontal datum. NAVD88 vertical datum Vertical units in meters.LiDAR StatusMN LiDAR Data – What’s Available –What’s NotAvailable for Download Elevation DataCalculate on your own conditioned DEM DEM – 1m and 3m Buildingsor contours – e.g. 5m Points are processed todetermine what theybounced off of Bare Earth Custom resolution DEM Hillshade Point Classification Hydrologically Bare Earth points ContoursElevation DataMN LiDAR Project Activities Cars and otheranthropomorphic thingsDerived Products Terrain/TIN Slope Bridge decksAssociated Data Flow Accumulation Vegetation (High, Hydro Breaklines BuildingsMedium, and Low) Stream Power Index Water(SPI) Compound TopographicIndex (CTI)Basics of Using LiDAR Data ASPRS has developeda set of standardclassifications forLiDAR derived dataCredit – Tim Loesch - MNDNR12
MN LiDAR Project ActivitiesMN LiDAR Data ValidationPoint ClassificationVertical Accuracy QA/QC Automated Classification Purpose: Can identify features with 70-74% accuracy Data Validation – we got what weManual Classification Data Integrity – we want people toboughttrust the data Needed to get higher accuracies Typically done with Air Photos and other sources ofdata Compare LiDAR elevations withSurveyed Points 100 surveyed validation points per Typically the most time consuming portion of anycountyproject and the most likely to be farmed overseas 20 points in each of 5 cover categories Help from county surveyorsCredit – Tim Loesch - MNDNRError and AccuracyWhat’s the value of your data?How is accuracy measured?LiDAR Error andAccuracy National Standard for Spatial Data Accuracy(NSSDA) Addresses accuracy of the product at ground scale Squared Root Mean Square Error (RMSE2) National Map Accuracy Standard (NMAS) Accuracy based on Contour Interval at published mapscaleError and AccuracyError and Accuracy Comparison of NDDSA and NMASValidation Points Level ground away from breaks in topography Open, visible skyNSSDA Accuracy(z2)Required Accuracy forTested Data for “Testedto Meet”0.15 ft or 4.60 cm0.30 ft or 9.10 cm0.10 ft10.30 ft or 9.25 cm0.60 ft or 18.2 cm0.20 ft L3B – Brush20.61 ft or 18.5 cm1.19 ft or 36.3 cm0.40 ft L4F – Forested41.22 ft or 37.0 cm2.38 ft or 72.6 cm0.79 ft L5U - UrbanNMAS ContourIntervalEquivalentNSSDA RMSE (z)0.551.52 ft or 46.3 cm2.98 ft or 90.8 cm0.99 ft103.04 ft or 92.7 cm5.96 ft or 181.6 cm1.98 ftBasics of Using LiDAR Data Five cover classes – 20 points per class (30preferred) L1O – Open terrain L2T – Tall Grass13
Error and AccuracyError and AccuracyLiDAR points Interpolated Value 372.115 Types of Accuracy Fundamental Accuracy Best Case Scenario Supplemental Accuracy Consolidated AccuracyObserve Interpolated value vs. Actual(Surveyed Point) Open terrain tested to 95% accuracy371.93 Accuracy for Cover Classes other than Open terrain All Cover Class Accuracies CombinedError and AccuracyWinona County Validation PointsError and Accuracy RMSE Calculations RMSE(z) Sqrt(sum(Zdata(i) – ZCheck(i))2 / n) Vertical AccuracyError and Accuracy 95% Rate 1.96 * RMSE2LiDAR Project ActivitiesWinona County Validation Report--------- Report Summary --------Error Mean:Error Range:Skew:RMSE(z):NMAS/VMASAccuracy(z) (90% CI):ASPRS/NSSDAAccuracy(z) (95% CI):-0.116[-0.435,0.143]-0.3050.161RMSE across cover Types 0.265 0.315176 control points included in summary out of 176- 0 control points turned off- 0 control points returned no-dataBasics of Using LiDAR DataOverallUrbanControl Z Surface Z .111386.810387.048-0.238ForestedControl 4864494.2264857065.579BrushControl 2620283.975Tall 2T10Open--------- Control Points ---------14
LiDAR Project ActivitiesAccuracy ComparisonsWinona County Validation ReportVertical Error ��4’2’2.4’-0.4NSSDARMSEz0.6’18.5 cm1.2’37.0 cm-0.5175225275325375425Credit – Tim Loesch - MNDNRAccuracy and What it Means LiDAR SystemLimitationsNational Accuracy Standards Specifications Cannot penetrate: Water (near-infrared Lasers) USGS Base LiDAR Specifications V13 Heavy canopy cover Rain, snow, clouds NDEP Guidelines For Digital Elevation Data Limited window of opportunity to collect Vegetation and snow free periods in the springand fall Flooding is bad too! High winds hinder collectionEnd of Lecture 2Questions/Comments?Lecture 3 – LiDAR Applications andProductsCredit – ESRIBasics of Using LiDAR Data15
Potential LiDAR ApplicationsWater ResourcesWater QualityFloodplain mapping Storm water management Drainage basin delineation Shoreline erosion Geology Sinkhole identificationGeologic/geomorphic mappingTransportationRoad and culvert designCut and fill estimation Archaeological siteidentification Agriculture Erosion control structure designSoils mappingPrecision farming Watershed modeling Wetland reconstruction Land cover/land use mappingForestry Forest characterization Fire fuel mappingFish and Wildlife Management Drainage and water control Walk-in Accessibility Habitat ManagementEmergency Management Debris removal Hazard MitigationCredit – Tim Loesch – MN DNRLIDAR –EmergencyManagementHurricane Katrina How muchdebris andwhere? Volumecut/fillstatistics Aid DebrisRemovalLIDARLIDAR May 2004 –Pre-Ivan May2004 –SeptemberPre-Ivan2004 –Post-IvanBasics of Using LiDAR Data16
LIDARLIDAR August31st, 2005 –PostKatrinaLiDAR ApplicationsBare Earth,Vegetative, andStructuralApplicationsCourtesy of Dodson & AssociatesBare are Earth Analysis Bare Earth –Top: Digital Surface Model (DSM)Bottom: Digital Elevation Model (DEM)Buildings and trees removedAutomatic and manual filteringShows bare earth surface DEMProvides elevation “base layer” for furthercalculationsCredit – Tim Loesch - MNDNRBasics of Using LiDAR Data17
Bare Earth – Example of Removing ArtifactsBare Earth –Initial Bare Earth Surface from LiDARFiltered Bare Earth SurfaceCredit – Tim Loesch - MNDNRBare Earth –Contours – Initial Bare Earth Surface3/27/2012MN GIS/LIS Fall WorkshopsSlide courtesy of SanbornBare Earth –Contours - Filtered Bare Earth SurfaceCredit – Tim Loesch - MNDNRCredit – Tim Loesch - MNDNRHydrologicModelingTerrain AnalysisModel real landscapeprocessesUtilize base layer DEM Identify appropriatewater conveyance WatershedsCredit – Adam Birr – MN Department of AgricultureBasics of Using LiDAR Data18
Vegetation – Canopy HeightVegetation - Hillside with deciduousvegetationCredit – Tim Loesch - MNDNRCredit – Tim Loesch - MNDNRVegetation - Profile of redit – Tim Loesch - MNDNRStructures - Lidar Point CloudCredit – Tim Loesch - MNDNRBasics of Using LiDAR DataCredit – Tim Loesch - MNDNRFirst Return Digital Surface Model (DSM)Credit – Tim Loesch - MNDNR19
Bare Earth DEM(no vegetation or buildings)Difference Image– height of buildings and treesCredit – Tim Loesch - MNDNRCredit – Tim Loesch - MNDNRSoftwareSoftware ArcGIS, IDRISI, Open Source GIS viewers ArcHydro TauDEM LAS Reader ArcMAP Extensions LiDAR Analyst, LP360, etc Stand-Alone Programs MARS AutoCAD Stand-Alone Viewers (free) Civil 3D Qcoherent (www.qcoherent.com) Fugro EarthData (www.fugroviewer.com)Credit – Tim Loesch - MNDNR Sanborn tware – Training PurposesESRI – ArcGIS Spatial AnalystESRI Extension – Additional costFairly robust set of general rasterprocessing toolsSpatial Analyst Surface (Slope, Curvature) Hydrologic modeling Reclassify Raster analysis Zonal Statistics3D Analyst (ArcScene, ArcGlobe) Conditional Cut/Fill Neighborhood Raster Calculator Line of Sight 3D PerspectiveSome specialized tools Hydrology GroundwaterCredit – Steve Kloiber - MNDNRBasics of Using LiDAR Data20
3D Analyst ESRI Extension –Additional cost Specificallydesigned forelevation data 3D visualization Creating & workingwith TINs Cross-section toolArcHydro Free Extension forArcGIS(Maidment) Suite of tools forgeospatialhydrology Semi-complicatedinstall Terrain analysisfocused on streamand watersheddelineation Tools foranalyzing sinksand reconditioningDEM AGREECredit – Steve Kloiber - MNDNRCredit – Steve Kloiber - MNDNRWhitebox GATTau DEM Free toolbox forArcGIS 9.3 (Tarboton) Easy install Specialized terrainanalysis tools focusedon stream andwatershed delineation Tools not found in thestandard ArcGISextensions orArcHydro D-infinity flowdirectionCredit – Steve Kloiber - MNDNR Free stand aloneprogram (Lindsay) Open source Fairly robust suite ofterrain analysis tools Handles LAS data(LiDAR) Many hydrologicanalyses Uses Python asnative languageCredit – Steve Kloiber - MNDNRGetting Ready for LiDAR – Hardware Bigger is better Workstations Duo or Quad Core 3.0ghz 4Gb RAMLiDARRepresentations 256 RAM Display OPEN GL High Speed disks – storage is cheap External hard drive for backupCredit – Tim Loesch - MNDNRBasics of Using LiDAR Data21
LiDAR RepresentationsBare Earth FilteringPoint CloudTriangulated IrregularNetwork (TIN)Raster – DEMVector – ContoursTerrainCredit - USGSBare Earth vs. First ReturnCredit – Tim Loesch - MNDNRLiDAR RepresentationsPoint CloudTriangulatedIrregular Network(TIN)Raster – DEMVector – ContoursTerrainCredit – Grit May - IWITIN Triangles Hillshaded andColored by ElevationCredit – USGSBasics of Using LiDAR DataCredit - USGSTIN – With Breakline enforcementCredit – Tim Loesch - MNDNR22
LiDAR RepresentationsInterpolating to RasterPoint CloudTriangulatedIrregular Network(TIN)Raster – DEMVector – ContoursTerrainCredit – USGSCredit – USGSLiDAR RepresentationsVector ContoursPoint CloudContours TriangulatedIrregular Network(TIN)Interpolation processRaster – DEMVector – ContoursTerrainCredit – Tim Loesch - MNDNRLiDAR RepresentationsTerrain Data Structure Point CloudTriangulatedIrregular Network(TIN) Data structure specific to elevation dataTIN model represents surfacesTerrains use pyramids to represent multiplelevels of resolutionData Inputs Raster – DEM Vector – Contours Credit – Tim Loesch - MNDNRBasics of Using LiDAR DataData Outputs TerrainMass Points – TINBreaklinesTINSRastersCredit – Grit May, IWI23
LiDAR ProductsLiDAR Additional Products Several file types andderivative productsavailable to end-usersLAS point cloud, DEM,contours, hydrologicbreaklines, etc.Breaklines Breaklines identify changes in landscapeelevation Too small or continuous to be reliably recorded withLiDAR Stream banks, curbs, centerlines, water/landinterfaceUsed to influence interpolation for contours Can help enforce stream and lake elevations Generated from Air PhotosLiDARGrammetryCredit – Tim Loesch - MNDNRBreaklinesLiDARGrammetry Classify points byintensity Trace aroundwater intensityvalues to create acontourNote Water Elevation ChangeCredit – Penn StateCredit – Tim Loesch - MNDNRBreaklinesMN LiDAR DataDeliveryCredit – Tim Loesch - MNDNRCredit – Tim Loesch - MNDNRBasics of Using LiDAR Data24
MN LiDAR Data DeliveryMN LiDAR Data Delivery Four WaysWhat Data Do People Use?Data Currently Divided between Red River Valleyand rest of the State Primary use products Raster Digital Elevation Model Red River Valley - Complete Rest of State – In Progress Contours http://gis.rrbdin.org/lidardownload/index.htmlMost consumers don’t bother with the raw LiDAR data Not a lot of tools available but this list is growing ArcGIS extensions are now available to read LAS formatLiDAR data Derived products from LiDAR is a growing researchfieldMN LiDAR Data Delivery – Red River ftp.lidar.dnr.state.mn.us ftp.lmic.state.mn.us/pub/data/elevation/lidar/data Interactive Beta Viewer to come April 1st – DataServices May 11thMN LiDAR DataDelivery FormatInteractive Viewer MN DNR FTP Site ftp.lidar.dnr.state.mn.usFile GeodatabasesData OrganizationGraphically browsedatasets – downloadcustomized extents Tiling Scheme County Project http://gis.rrbdin.org/lid Quarter quarter quarterardownload/index.htmlquad (1/16th of a quad)(Raw)Not all data types tiled thesame MN DNRFTP LiDARQuickDownloadGuideWhatGeographicScale?What DataType?Where ToGet ItMN LiDAR DataDelivery FormatMN GEO (formerly LMIC) FTPSite DEMLidar.state.mn.us/data/countyCountyContoursSize /lidar/dataFile GeodatabasesData Organization Tiling Scheme CountyFTP DownloadSite Project Quarter quarter quarter quadDEM(1/16th of a quad) (Raw)Not all data types tiled the ty Size limitationsBare Earth PointsBasics of Using LiDAR Data25
MN LiDAR DataDelivery FormatMN DNR InteractiveDownload and ViewerMN LiDAR DataDelivery FormatThings to know Beta Viewer AvailableApril 1st Use third party FTPSoftware - Filezilla Data ServicesAvailable May 11th Know what you wantbefore you download Mobile App AvailableJune 1st Interactive webdownload pagecoming in near future RTM – Read the Manual! Several helpful Readme’sMN LiDAR DataDelivery Format - LAS FilesDelivery Format - LASLAS filesLAS – Common LiDAR Data Exchange Format Stores a variety of point informationIndustry Standard Number of returns Easily transferred from system to system Return Number Less volume and more easily transferred than ASCII IntensityRetains flight information and instrument parameters X,Y, Z values GPS, IMU, Laser Pulse Range Scan DirectionCurrent version is LAS 1.1 (5/05) Classification 1.2 has been proposed and in final review Scan Angle Rank 2.0 has been proposed GPS t/asprs las format v11.pdfLAZ files Compressed LAS filesVisualizationLidar data can be visualized a number of waysVisualization Shaded Relief images can reveal very subtlerelief Especially with high detail data Helpful for data validation and looking for anomaliesand errors in the data 3-Dimensional viewingCross-sectionsContour generationTriangulated Irregular Networks (TIN)Credit – Tim Loesch - MNDNRBasics of Using LiDAR Data26
Shaded relief imagery3/27/2012MN GIS/LIS Fall WorkshopsMN GIS/LIS Fall WorkshopsSinkhole3/27/20123/27/2012MN GIS/LIS Fall WorkshopsCredit – Tim Loesch - MNDNR2006 color NAIP airphotoSinkhole3/27/2012Credit – Tim Loesch - MNDNR3/27/2012MN GIS/LIS Fall WorkshopsSinkhole – Cross-sectionMN GIS/LIS Fall WorkshopsBasics of Using LiDAR Data3/27/2012MN GIS/LIS Fall Workshops27
3/27/2012MN GIS/LIS Fall Workshops3/27/2012MN GIS/LIS Fall Workshops3/27/2012MN GIS/LIS Fall WorkshopsBasics of Using LiDAR Data3/27/2012MN GIS/LIS Fall WorkshopsCredit – Tim Loesch - MNDNRCredit – Tim Loesch - MNDNR3/27/2012MN GIS/LIS Fall WorkshopsCredit – Tim Loesch - MNDNRCredit – Tim Loesch - MNDNR3/27/2012MN GIS/LIS Fall WorkshopsCredit – Tim Loesch - MNDNRCredit – Tim Loesch - MNDNR28
3/27/2012MN GIS/LIS Fall WorkshopsCredit – Tim Loesch - MNDNRCredit – Tim Loesch - MNDNRCredit – Tim Loesch - MNDNRCredit – Tim Loesch - MNDNRCredits/Acknowledgements Tim Loesch – MN Dept. of Natural Resources Sean Vaughn – MN Dept. of Natural Resources Steve Kloiber – MN Dept. of Natural Resources Dr. Adam Birr – MN Dept. of Agriculture Jake Galzki – University of Minnesota Dr. Jay Bell – University of Minnesota Ann Lewandowski – University of Minnesota Les Everett – University of MinnesotaCredit - Marvin H. Treu – University of Nebraska - OmahaBasics of Using LiDAR Data29
Basics of Using LiDAR Data Joel Nelson Univ of Minnesota, Dept of Soil, Water, and Climate Funded by the Minnesota Environment and Natural Resources Trust Fund Introduction Intended as the first in a series of workshops related to LiDAR and . by