Transcription
G. Mandlburger, Ch. Briese, N. Pfeifer1Progress in LiDAR sensor technology – chance and challenge for DTMgeneration and data administrationGottfried Mandlburger 1,2, Christian Briese 1,2, Norbert Pfeifer 2, Vienna1Vienna University of Technology, Christian Doppler Laboratory for “Spatial Data from LaserScanning and Remote Sensing”, Gusshausstr. 27-29. 1040 Wien2Institute of Photogrammetry and Remote Sensing, Vienna University of Technology, Gusshausstr.27-29. 1040 WienABSTRACTAirborne laser scanning - also referred to as LIDAR - became a standard method for the acquisition of topographic data.However, since the first commercial flights in 1994 a significant development in the sensor technology can be observed.These developments lead to a high increase in data volume due to a significant higher number of determined echoes aswell as due to an increased number of information stored per echo.Next to a short presentation of the current sensor developments this paper focuses on the current challenges inmanagement of ALS data including the storage of additional information provided by full-waveform ALS sensors.Furthermore, advanced procedures for DTM generation integrating geometric criteria with these additional attributesper echo are discussed.1. INTRODUCTIONAirborne laser scanning (ALS) - also referred to as LIDAR (Light Detection and Ranging) - becamethe standard method for acquisition of topographic data, especially for the reconstruction of digitalterrain models (DTM) (Kraus and Otepka, 2005). For terrain determination so-called filteringalgorithms were developed that perform an automatic classification of the acquired point cloud intoterrain and off-terrain points (Sithole and Vosselman, 2004). However, for high qualityrequirements a certain amount of human control is still necessary, i.e. manually correctingclassification errors of the automatic procedures. In any case, the DTM from ALS is a standardproduct, offering higher quality than other methods. This holds especially, but not only, in forestedterrain due to the vegetation penetration capability of laser ranging. This property also builds thebase for the successful application of ALS in forestry (Hyyppä et al., 2004). Next to terrainreconstruction, topographic applications as building or city model reconstruction from airbornelaser scanning are a major topic of research but did not mature to the state of DTM extraction yet.Since the first commercial flights worldwide in 1994 (personal communication with J. Lindenbergerand P. Friess) the development of the sensor technology was tremendous (e.g. increase in pointdensity, etc., cf. section 2). These developments, but also the acceptance of the measurementmethod by surveying authorities and users, e.g. hydraulic engineers, lead to an increase in datavolume. In the beginning point clouds were provided in ASCII (list of xyz-triples) on CDs, now thebinary exchange via hard disks (capacity e.g. 200GB) is common. Additionally to the increase inthe number of points, also the attributes of data delivered have changed. The new data are: intensityresp. amplitude measures, GPS-time stamps per emitted pulse, trajectory information (after Kalmanfiltering for combined GPS and IMU processing), and the full-waveform information of thebackscatter. At least some of the mentioned parameters are contained in the binary LAS file format(LAS, 2007) released by the ASPRS, which is gradually becoming a standard for LIDAR dataexchange. This is now available to photogrammetric researchers. However, with the development of
2G. Mandlburger, Ch. Briese, N. Pfeiferprocessing algorithms this information can also be used beneficially for applications. Filteringalgorithms for terrain reconstruction may use, e.g. the full-waveform information in order toincrease accuracy and reliability in the filtering process (cf. section 5). Also, trajectory informationsupports strip adjustment of laser scanning data with extended ground control for increasing theaccuracy of the point cloud product (Kager, 2004, Csanyi and Toth, 2007). It is expected that in thisway precision well below the decimetre will be reached for the single point, if the backscatteringobject surface is defined appropriately.While some of the chances offered by the sensor development are becoming apparent, thechallenges are much clearer. The entire data, including point attributes, flight path information,ground control, and meta data have to be managed. As project data with 1 Tera-Byte, e.g., 1010points, are not uncommon, quick data access requires high-performance spatial indexing. There isno standard for full-waveform data, and it should be discussed, if a) the entire digitized waveformshall be stored, or b) echo width and amplitude, which are a result of a more advanced echo analysisapproach, or c) the cross section (m2) of each echo which can be obtained with a very limited set ofassumptions (Wagner et al., 2006), or d) ground reflectance (Höfle and Pfeifer, 2007), whichrequire assumptions on target, i.e., ground surface, shall be used. Maintaining the information (onechoes, the flight path, etc.) throughout the entire workflow of airborne laser scanning dataprocessing can be seen as good practice, but is subject to discussion as well. The most importantchallenge is verifying that the full-waveform and the other attributes listed above carry indeedinformation (and not only data), and developing methods for exploiting it automatically in a reliableway.This paper is structured as follows. Section 2 gives more details on the sensor development and thecurrent state of the technology. This builds the basis for Section 3, where the first steps in exploitingthe attribute information, namely echo decomposition and strip adjustment, are presented shortly. InSection 4 a proposal for management of airborne laser scanning data, under consideration of theprevious sections, is made. Section 5 presents developments on DTM extraction exploiting the newpossibilities. Finally, the paper is summarised and an outlook into future research for advancedDTM generation from ALS data is provided.2. SENSOR DEVELOPMENTAs already mentioned in the introduction, a significant progress in the ALS sensor developmenttook place in the last years. ALS systems still use almost solely the round trip time measurementprinciple for ranging (one exception is the research system ScaLARS, which applies the phasedifference measurement principle (Hug and Wehr, 1997)), but in the last years, the frequency ofrange measurements developed from a few kHz to about 200kHz. This progress lead to a significantincrease in the data volume and allows nowadays a much more efficient and detailed acquisition ofthe topography. Likewise the range spectrum increased. The maximum flying height increased from1km to 5km.Furthermore, while the first systems either allowed to store the range to the first or last echo, currentsystems allow the simultaneous storage of both echoes. More advanced systems even allow thedetermination of intermediate echoes. Next to the range, intensity recording, characterising thereflectance behaviour, was introduced. This development expanded to the full-waveformdigitisation (Wagner et al., 2006).We can nowadays distinguish between two different types of commercial ALS sensor systems:discrete echo and full-waveform scanners. While discrete echo scanners detect a representativetrigger signal for multiple echoes in real time using analogue detectors, full-waveform ALS systemsdigitise the entire analogue echo waveform, i.e. the time-dependent variation of received signalpower, for each emitted laser beam (typically with an interval of 1 ns). In contrast to the “classical”
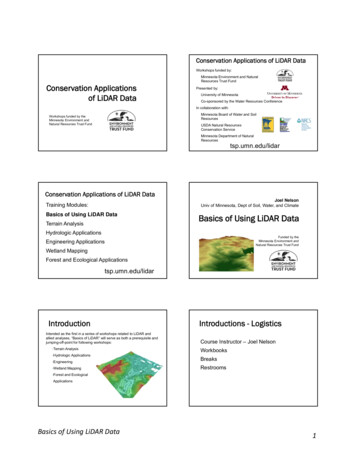
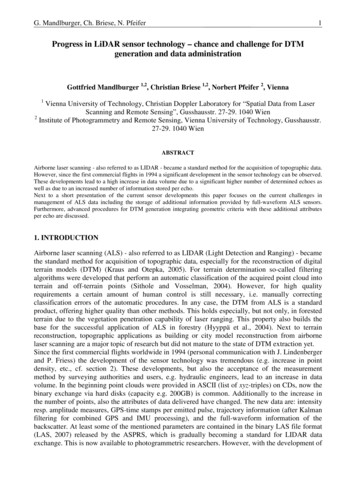
G. Mandlburger, Ch. Briese, N. Pfeifer3discrete echo systems, the full-waveform ALS systems allow an echo determination in postprocessing adapted to the individual needs based on the stored waveforms.Additionally, in order to increase the data coverage rate by an increase in the flying height, pulserepetition rate and maximum range, the so-called multipulse technology was introduced. Whilestandard ALS systems just allow a consecutive pulse emission and detection, this technique enablesto detect the echoes of multiple laser pulses travelling through the atmosphere simultaneously.Moreover, some data providers use multiple scanners on one airborne platform, e.g. for increasedside-looking or for forward and backward looking.Finally, also the hardware developments of the other systems components, such as GPS and IMU(inertial measurement unit) as well as advanced software solutions for direct georeferencing andsubsequent fine-georefencing (cf. section 3.2) have to be mentioned. While one could recognise anincrease in accuracy and measurement frequency of the position and orientation sensors (e.g. kHzIMU frequency), advanced software solutions help to determine accurate trajectory information.Moreover, calibration procedures (e.g. for the determination of the relative position of the sensorson the moving platform) were improved in a way that current ALS point clouds have an absoluteaccuracy in plane of about 20-40cm and in height of about 10-15cm.3. PREPROCESSING AND GEOREFERENCINGThis section focuses on the determination of the echoes and their additional parameters as well ason the georeferencing of the data. While the echo and attribute (typically just an intensity value)determination of discrete echo ALS systems is performed in real time during data acquisition thisprocedure, which is discussed in the following subsection, has to be done in a separate processingphase in the case of full-waveform ALS. Independent of the final application of the ALS data, thetrajectory of the laser scanner has to be determined based on the position and orientationinformation in order to georeference the ALS measurements. Subsequently, with the resultingtrajectory the position of the synchronised echoes can be determined in one coordinate frame. Then,the georeferencing of the data can be checked by an analysis of the height differences betweenoverlapping strips and/or to external reference data. In the case of higher accuracy requirements afine-georeferencing process has to follow (cf. section 3.2). Finally, the georeferenced ALS echoescan be stored together with their attributes (echo ID, GPS-time, intensity, echo width, etc.) in atopographic database, which can be accessed for further processing (cf. section 4).3.1. Determination of echo parametersThis subsection describes the determination of the echoes and their additional parameters in thepreprocessing step of full-waveform ALS data. The digitized full-waveform signal per emittedpulse is the result of a convolution of the emitted laser pulse with the illuminated object surface(Wagner et al., 2006). Usually it is assumed that the emitted pulse can be well approximated by aGaussian bell curve and that the resulting waveform can be well modelled by the summation ofGauss curves that represent the backscattered energy (Hofton et al., 2000, Wagner et al., 2006, c.f.fig. 1).In this phase of modelling the waveform, the first step is typically the determination of the numberof echoes and their approximate position and amplitude by searching all local maxima in therecorded signal. Based on these approximate values a model of the waveform can be fitted byminimising the residuals to the recorded waveform information. In the case of a Gaussiandecomposition the individual Gaussian curves describe the backscattered signal per echo (dottedcurves in fig. 1).
4G. Mandlburger, Ch. Briese, N. PfeiferFig. 1: Modelling of the recorded waveform (black dots) by Gaussian decomposition; Red: Sum of all Gaussianfunctions, Black dotted lines: individual Gaussian functions per echo; Next to the Distance Ri further echo parameters,like the amplitude Ai and the echo width EWi, which characterise the individual echoes, can be determined.Based on the individual curves further characteristic attributes, like the maximum amplitude valueAi and the echo width EWi, can be determined for each echo. While the amplitude describes thebackscattering properties of the illuminated surface, the echo width describes the range variations ofall small surface elements that contributed to that echo. Therefore, a big echo width (in relation tothe width of the emitted pulse) indicates that surface elements at different ranges contributed to thatecho, while a small echo width indicates a rather flat surface in respect to the beam direction. Basedon these attributes the so-called backscatter cross section, which is a measure of the electromagneticenergy intercepted and reradiated by objects backwards towards the sensor, can be determined (cf.Wagner et al., 2006).3.2. GeoreferencingFor the transformation of the ALS data (range and angle observations) into one common coordinatesystem the time dependent position and orientation of the laser scanner have to be determined. Asmentioned in the introduction this requires a Position and Orientation system (POS). Together withthe laser scanner the POS forms a multiple sensor system, for which the relative orientation and thetime lags between the components (GPS antenna, IMU, and laser scanner) have to be known. Tosome extent these parameters can be observed by total station measurements on the ground, but anumber of parameters, e.g. the IMU mounting orientation and time lags, are better determinedduring flight within a calibration procedure. Approaches for the calibration have been presented in(Burman, 2002), (Filin, 2003), and (Kager, 2004).Based on the mounting calibration the coordinates of the echoes can be determined within onecoordinate frame by direct georeferencing. However, in practice often deficits in the directgeoreferencing of the point cloud can be found, e.g. by analysing differences between overlappingALS strips. Therefore, for advanced accuracy requirements strip adjustment techniques arenecessary leading to an improved georeferencing of the ALS data. This can be done either bycalibration (Burman, 2002, Kager, 2004) or by applying corrections to the points directly(Crombaghs et al., 2000, Kraus and Pfeifer, 2001). The resulting fine-georeferenced data(coordinates of all echoes and their attributes) are the basis for the derivation of subsequent models.Due to the typically high amount of data an adequate data management is essential (see the nextsection).
G. Mandlburger, Ch. Briese, N. Pfeifer54. ALS DATA MANAGEMENT IN TOPDMIt has been pointed out in the previous sections that modern ALS sensors provide data for a moredense and detailed description of the earth’s surface at the price of an increased data volume. Evensmall projects of several dozens or hundreds of square kilometres require nowadays an efficient andflexible system for data handling. For administration of huge amounts of elevation data, theprogram system TopDM (Topographic Data Management) was developed at the Institute ofPhotogrammetry and Remote Sensing (I.P.F.) in Vienna. Initially designed for storage ofcountrywide elevation data from photogrammetry and other traditional surveying techniques,TopDM has proved to be well suited for management of ALS data over the last years.4.1. General concept and current stateTopDM (Hochstöger, 1996, Warriner and Mandlburger, 2005) is basically a database managementsystem (DBMS) founded on a geo-relational database like TOPDB (Loitsch, Molnar, 1991) orother, commercially available systems (e.g. Oracle Spatial). The communication between TopDMand the DB is realized via an abstract database interface utilizing the database language TOPSQL a query language based on standard ANSI-SQL with extensions regarding geometric/topologicaltypes and operators. Using TOPSQL, geometric and attribute related conditions can be combined ina single SQL statement.The main goal of TopDM is an efficient long-term storage and archiving of primary topographicdata (original data) and derived products (e.g. DTM). Apart from geometry (coordinates) andcoding (geometric type and meaning) this requires also storage of information about other dataproperties (accuracy, compilation method, creator of data, etc.) to allow detailed data selection.Additional important aspects are flexible support of data formats for data import and export as wellas rigorous geo-coding of the administrated data. The latter includes also transformations betweendifferent coordinate systems and geodetic dates, which gain special importance for ALS data asthey are originally captured in a geocentric reference system (e.g. WGS84) and normally to beprocessed in the national coordinate system. In this respect TopDM mainly focuses on regional ornational surveying authorities and is e.g. used by the Federal Office of Metrology and Surveying(A), swisstopo (CH), Ordnance Survey (GB) and several surveying authorities in Germany. Abovethat, with the increasing amount of topographic data as provided by modern ALS sensors, TopDMbecomes a basic component of today’s large DTM projects, e.g. ALS DTM of Tyrol, LowerAustria, Vienna, Neusiedlersee (Attwenger and Chlaupek, 2006). Within a sophisticated DTMproduction system, TopDM first serves as data source of the original point cloud. From here dataare passed to applications for filtering and DTM modelling. The end products (e.g. DSM, DTM,classified points, hill shadings) are finally returned to the TopDM database for storage and deliveryto customers.4.2. New developmentThe general concept as described above is based on the administration of the xyz-coordinates only.As pointed out in previous sections (and as it will be shown in the next section), additional pointrelated attributes like scan angle, echo width, amplitude and the more can be used to improve thederived DTM. Therefore, an extension of the existing TopDM table system was designed andfinally implemented allowing storage of additional attributes per point ( per echo). According tothe available sensor data different table types may be applied to preserve e.g. information provided
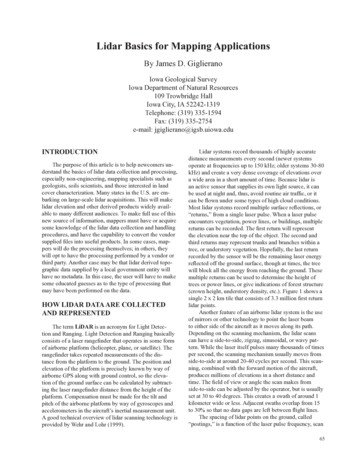
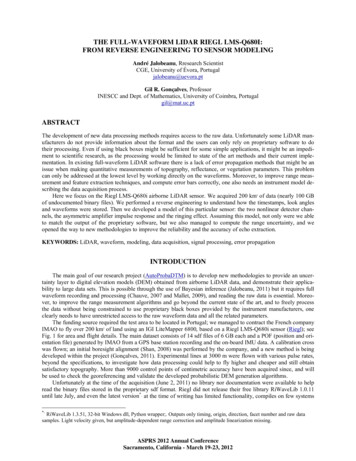
6G. Mandlburger, Ch. Briese, N. Pfeiferby LAS data files (LAS, 2007) or data from full-waveform laser scanners. Examples of tabledefinitions are shown in Tab. 1.CCDefinition for Table of Type: TDLASTABC C(IDOBJINTEGERUNIQUE INDEX NOT NULLCOORDINATES LINEINDEX NOT NULLGPSTIMENUMBER(15.6)NO INDEX NOT NULLINTENSITYINTEGERNO INDEX NOT NULLRETURNNUMBER INTEGERNO INDEX NOT NULLRETURNCOUNT INTEGERNO INDEX NOT NULLSCANDIRBOOLEANNO INDEX NOT NULLSCANEDGEBOOLEANNO INDEX NOT NULLECHOCLASSINTEGERNO INDEX NOT NULLSCANANGLEINTEGERNO INDEX NOT NULLUSERDATAINTEGERNO INDEX NOT NULLPOINTSRCIDINTEGERNO INDEX NOT NULL.)SYSNUM AYARRAYARRAYARRAYARRAYARRAYCCDefinition for Table of Type: TDFWFTABC C(IDOBJINTEGERUNIQUE INDEX NOT NULLCOORDINATES LINEINDEX NOT NULLGPSTIMENUMBER(12.3)INDEX NOT NULLAMPLITUDENUMBER(12.3)INDEX NOT NULLECHOWIDTHNUMBER(12.3)INDEX NOT NULLRANGENUMBER(12.3)INDEX NOT NULLSCANANGLENUMBER(12.3)INDEX NOT NULLPULSEIDINTEGERINDEX NOT NULLECHOCLASSINTEGERINDEX NOT NULL.)SYSNUM AYARRAYARRAYa)b)Tab. 1: Excerpt from the TopDM table definitions for administration of topographic data containinginformation from LAS files (a) or full-waveform laser scanners (b)One of the most important additional point-related attributes is the GPS time of the emitted pulse.This time stamp can serve a) as a unique identifier for all laser pulses and allows b) to find andbring together multiple echoes descended from the same pulse, c) to order echoes chronologicallywhich may speed up subsequent data processing remarkably, and d) to line up echoes and trajectoryinformation allowing to assign specific echoes to a certain flight line and to locate the scannerposition and orientation corresponding to a certain echo. The latter may be used to reconstructflight-line separated point clouds from patch-wise delivered data e.g. for strip adjustment.Finally, fig. 3a-f show the resulting point clouds when applying selection criterions using differentadditional point-related attributes as they can be derived directly from the TopDM database.Detail fig. 3a-fFig. 2: DSM hill shading of flight strip 4, Leithagebirge 2007.The fig. 3a-f show terrain with different surface characteristics. There is wooden area in thesouthern part delimited by a V-shaped horizontal street, a steep slope running from northwest tosoutheast, a medium slope running from northeast to southwest and finally a bare level area in thenorth. As a reference fig. 3a shows all available echoes. The selection of a certain GPS time range(fig. 3b) results in a segment of point data along the flight axis, whereas a reduction of the availablescan angle (fig 3c) narrows the width of the flight strip. Fig 3d and 3e show all points withamplitudes greater than 75 DN (digital numbers) and echo widths greater than 1.7ns respectively.The resulting point sets are highly (inverse) correlated. Since the echo width describes the heightvariation within the reflected signal, high values can be observed in the wooden area and at steepslopes whereas low values appear in bare and flat areas. The situation is more or less reversed forthe amplitude, where bare and level areas (e.g. street) are characterized by high values. The lastexample in fig. 3f shows all points related to echo class 2, which means that the points are the first
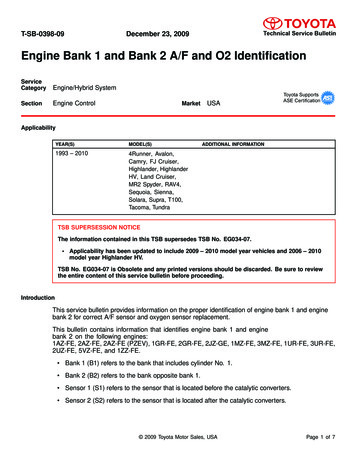
G. Mandlburger, Ch. Briese, N. Pfeifer7echoes of pulses containing multiple echoes. This is normally the case in areas covered byvegetation, which clearly comes out in fig. 3f.Fig 3a: Point cloud (all echoes)Fig. 3b: Selection by GPS timeFig. 3c: Selection by scan angleFig 3d: Selection by amplitueFig 3e: Selection by echo widthFig 3f: Selection by echo classThe respective SELECT conditions for fig. 3a-f are as follows:3a WHERE (COORDINATES .X. WINDOW (20525. 313395. 20660. 313495.)) AND (AGGREGATE 'STRIP4’)3b WHERE (COORDINATES AND (GPSTIME 555675.5 AND GPSTIME 555678.0)3c WHERE (COORDINATES AND (SCANANGLE -1.5 AND SCANANGLE 6.5)3d WHERE (COORDINATES AND (AMPLITUE 75)3e WHERE (COORDINATES AND (ECHOWIDTH 1.7)3f WHERE (COORDINATES AND (ECHOCLASS 2)5. CHANCE AND CHALLENGE FOR DTM GENERATIONDuring the process of data acquisition and echo determination no interpretation resp. classificationof the determined echoes, which were reflected from different object surfaces, is performed.However, for the generation of a DTM the classification of the ALS data into terrain and off-terrainpoints is essential. In the past, many different solutions for filtering ALS data were published (cf.Sithole and Vosselman, 2004). All these approaches have in common that they rely only upongeometric criteria (typically the height relation of neighboured points) for the elimination of offterrain points.Within the following subsection visualisations of the additional echo parameters from a small testarea in the Leithagebirge 2006 (cf. Doneus and Briese, 2006) are presented. In the subsequentsubsection the potential of the additional echo parameters for DTM generation are presented.5.1. Surface characteristics from echo parametersIn fig. 4, next to a shading of the digital surface model (DSM) of the first echo point cloud,visualisations of the amplitude and the echo width of the last echo point cloud are presented. Onecan recognise that the echo width in areas with low vegetation is significantly increased compared
8G. Mandlburger, Ch. Briese, N. Pfeiferto open or wooded terrain with high trees. Furthermore, in the amplitude visualisation vegetationareas can be recognised quite accurately.Fig. 4: Left: Digital surface model determined from the first echo point cloud; middle: amplitude (so-called intensity) ofechoes extracted from the waveform, right: echo width model of the last echo point cloudUsing this test suite Doneus and Briese (2006) demonstrated that the classification of the ALSpoints into terrain and off-terrain points with standard algorithms considering the geometric relationbetween neighboured points did not work properly for the areas with low vegetation. Therefore theyproposed an additional pre-filter step eliminating all echoes with a significantly higher echo width.By this means the quality of the DTM could be improved in areas with low vegetation. However,within this simple procedure the definition of the threshold for the echo width might be critical.Therefore, in the following subsection an advanced concept for the consideration of additional fullwaveform information into the filtering and classification process for DTM generation is provided.5.2. Echo parameter exploration in DTM generation by Robust InterpolationRobust Interpolation (Kraus and Pfeifer, 1998) is a well known approach for the classification ofALS data into terrain and off-terrain points. Within this section we expand this approach to theusage of individual a-priori weights of the ALS point cloud. These weights can be determined basedon the additional echo parameters (e.g. based on the echo width). Using these a-priori weights forrobust interpolation allows to combine the additional knowledge of the echo attributes with thegeometric criteria within the robust surface estimation.This procedure is demonstrated in fig. 5 for a profile extracted from the full-waveform ALScampaign Leithagebirge 2006. For this example the a-priori weights are defined using the echowidth parameter. Points with a small echo width get a high a-priori weight, whereas the weight ofpoints with higher echo width is significantly decreased. As can be seen in figure 5a-b the wideningof the echo width parameter can be observed in regions with low vegetation. In these areas theDTM determined without individual weights is too high due to the fact that the last echo is amixture of reflections of small objects at different ranges above the DTM surface. Using robustinterpolation with individual weights leads to a more reliable DTM (especially near the road in themiddle of the profile). It is less affected by reflections in low vegetation.
G. Mandlburger, Ch. Briese, N. PfeiferFig. 5a: Shading of the DSM and selected last echo pointswithin a profile coloured by the echo width.9Fig. 5b: Profile view: Last echo points coloured by theecho width.Fig. 5c: DTM generation by robust estimation with a-priori weights determined from the echo attributes (in this casejust using the echo width) demonstrated on a profile; Black dots: Last echo point cloud, Red surface: DTM withoutconsidering individual weights. Green surface: Improved DTM by robust interpolation with individual weights.6. CONCLUSIONThe paper presents the current chances and challenges for DTM generation and data managementespecially for ALS data. It focuses on the additional echo attributes that can be determined fromfull-waveform systems. Within the area of data administration the paper proposes a concept forstoring and accessing further information of an ALS flight mission as well as of each individualALS echo. Whereas legacy data administration systems rely solely on point (xyz) information, ourapproach provides also attribute data. This is the basis for maintaining and exploiting the full echoinformation within all subsequent processing steps.Next to advanced consideration in data management the improvement of DTM generation based onthese additional attributes was demonstrated. However, we have explored preliminary conceptswhich will have to be extended and proven in the future. There is a need to study the additionalparameters provided by the full-waveform sensors in much more detail. The presented results show,however, that the provided information can be useful for DTM determination and other modellingtasks. Further attributes per echo might be additionally provided by other sensors (e.g. passiveimage data). Therefore, algorithms which combine geometric information provided by the ALSpoint cloud with additional information from active and passive sensors will become important.
10G. Mandlburger, Ch. Briese, N. Pfeifer7. REFERENCESAttwenger, M., Chlaupek, A. (2006): Erstellung eines grenzüberschreitenden digitalenGeländemodells im Nationalpark Neusiedler See-Seewinkel/Fertö Hanság aus LaserscannerDaten. Angewandte Geoinformatik 2006, Beiträge zum 18. AGIT-Symposium", J. Strobl, T.Blaschke, G. Griesebner (ed.), ISBN3-87907-437-2, S. 16 - 23.Burman, H. (2002): Laser Strip Adjustment for Data Calibration and Verification. InternationalArchives of Photogrammetry and Remote Sensing, Vol. 34/3, Graz, Austria.Csanyi, N., Toth, C. (2007): Improvement of Lidar data accuracy using lidar-specific groundtargets. Photogrammetric Engineering & Remote Sensing 73(4). 385-296.Crombaghs, M., Brügelmann, R. and de Min, E. (2000): On the adjustment of overlapping strips oflaseraltimeter height data. In: International Archives of Photogrammetry and Remote Sensing,Vol. XXXIII, 3A, Amsterdam, Netherlands, pp. 230–237.Doneus, M., Briese, C. (2006): Digital terrain modelling for archaeological interpretation withinforested areas using full-waveform laserscanning. In: M. Ioannides, D. Arnold, F. Niccolucciand K. Mania (Editors), The 7th International Symposium on Virtual Reality, Archaeology andCultural Heritage VAST.Filin, S. (2003): Recovery of systematic biases in laser altimetry data using natural surfaces.Photogrammetric Engineering & Remote Sensing, 69.Hochstöger, F. (1996): Software for Managing Country-Wide Digital Elevation Data. In:International Archives for Photogrammetry and Remote Sensing, Vol. XXXI, Part B2, Vienna,Austria, 1996, S. 160–163Hofton, M.A., Minster, J.B. & Blair, J.B. (2000): Decomposition of Laser Altimeter Waveforms.IEEE Transactions on Geoscience and Remote Sensing, 38: 1989-1996.Höfle, B., Pfeifer, N. (2007): Correction of laser scanning intensity data: Data and
G. Mandlburger, Ch. Briese, N. Pfeifer 1 Progress in LiDAR sensor technology – chance and challenge for DTM generation and data administration Gottfried Mandlburger 1,2, Christian Briese 1,2, Norbert Pfeifer 2, Vienna 1 Vienna University of Technology,