Transcription
CALCULATING SOLAR PHOTOVOLTAIC POTENTIAL ON RESIDENTIALROOFTOPS IN KAILUA KONA, HAWAIIByCaroline CarlA Thesis Presented to theFACULTY OF THE USC GRADUATE SCHOOLUNIVERSITY OF SOUTHERN CALIFORNIAIn Partial Fulfillment of theRequirements for the DegreeMASTER OF SCIENCEGEOGRAPHIC INFORMATION SCIENCE AND TECHNOLOGYMay 2014Copyright 2014!Caroline Carl!
ACKNOWLEDGEMENTSI would like to thank my loving husband Bill and beautiful baby girl Delainey for all theirsupport throughout this entire process. Without their patience, I could never havecompleted this work.I would also like to thank Professor Su Jin Lee for guiding me through this process andalways going above and beyond. Thank you for taking on this work with me, which hasbeen the greatest learning experience of my life.!""!
TABLE OF CONTENTSACKNOWLEDGEMENTSiiLIST OF FIGURESviLIST OF EQUATIONSviiLIST OF TABLESviiiABSTRACTixCHAPTER 1: INTRODUCTION11.1 Renewable Energy and Trends in Solar Photovoltaic Energy Production11.2 Electricity Demand in Hawaii41.3 Growth of Solar Photovoltaic in Hawaii51.4 Solar Photovoltaic Research on Hawaii Island7CHAPTER 2: LITERATURE REVIEW102.1 Modeling Solar Radiation102.2 Solar Radiation Models with GIS122.2.1 Esri’s Solar Analyst142.3 Calculating Rooftop Area172.4 Calculating Photovoltaic Potential from Solar Radiation192.5 Solar Mapping Projects as Decision Support Tools232.6 Hawaii Solar Mapping Projects24!2.6.1Oahu242.6.2Kauai262.6.3Hawaii Island272.6.4Statewide27"""!
CHAPTER 3: METHODS293.1 Description of Study Area293.2 Data303.2.1LiDAR data303.2.2Tax Map Key Parcel Data323.2.3Aerial Imagery333.2.4PV Production on Active Residential Site333.3 Research Design3.3.13.3.23.3.3Isolating Building Rooftops for Sample Set34363.3.1.1 Stratified Parcel Selection363.3.1.2 Digitizing Rooftops38Estimating Terrain Parameters and Incoming Solar Radiation393.3.2.1 Terrain Parameters: Slope and Aspect393.3.2.2 Estimating Solar Radiation40Spatial Analysis for Selected Rooftops443.3.3.1 Raster to Point443.3.3.2 Spatial Join473.3.4 Calculating PV Potential on Building Rooftops493.3.550Statistical Analysis for Extrapolation to Study AreaCHAPTER 4: RESULTS524.1 Distribution of Lot Sizes, Rooftop Area, Terrain Parameters, and PVPotential524.2 Correlation Analysis544.3 Rooftop and Lot Size Correlation58!"#!
4.4 Regression Analysis594.5 Extrapolation to Study Area: Rooftop Area, Average and TotalPV Potential614.6 Comparison with Real Home PV Production63CHAPTER 5: CONCLUSION AND DISCUSSION665.1 Project Assumptions685.2 Review of Methodology705.2.1 LiDAR Performance705.2.2 Modeling Solar Radiation715.2.3 Rooftop Area Estimation725.2.4 Estimating PV Potential735.3 Future research5.3.1 LiDAR755.3.2 Optimizing Solar Radiation Model76REFERENCES!7477#!
LIST OF FIGURESFigure 1.1 Breakdown of electric energy sources in Hawaii4Figure 2.1 Incoming solar radiation components10Figure 3.1 Study area LiDAR coverage30Figure 3.2 Elevation with 2-meter spatial resolution from LiDAR32Figure 3.3 Flowchart for calculating PV potential for this study35Figure 3.4 Sample set of rooftops38Figure 3.5 Map showing aspect39Figure 3.6 Map showing slope40Figure 3.7 Incoming solar radiation surface43Figure 3.8 Points of solar radiation on rooftops45Figure 3.9 Aspect points on rooftop46Figure 3.10 High resolution sample rooftop image from Google Earth46!#"!
LIST OF EQUATIONSEquation 1: Suri et al. photovoltaic potential calculation20Equation 2: Hofierka and Kanuk photovoltaic potential21Equation 3: Jakubiec and Reinhart 201222Equation 4: Jakubiec and Reinhart 2012 adapted from NRELPVWatts Version 222!#""!
LIST OF TABLESTable 3.1 Tax map key (TMK) parcel data attributes33Table 3.2 Stratified parcel selection37Table 3.3 Samples design for digitization38Table 3.4 Input parameters for area solar radiation tool in ArcGIS42Table 3.5 Final rooftop layer attribute table used for PV potential calculation48Table 3.6 PV potential calculated data for rooftop layer attribute table50Table 4.1 Statistical summary of sample set parcel attributes in six classes53Table 4.2 Standard correlation showing the relationship between variablesacross all classes55Table 4.3 Standard correlation table showing the relationship between variablesacross all 224 samples57Table 4.4 Bivariate fit modeling the correlation between rooftop and lot size foreach class 1-6 and the total sample set58Table 4.5 Average PV potential least squares regression analysis59Table 4.6 Total PV potential least squares regression analysis60Table 4.7 Regression analysis average and total PV potential62Table 4.8 Solar panel information used for model versus as built in samplehome61Table 4.9 Recorded PV production data compared with adjusted model65!!!!#"""!
ABSTRACTAs carbon based fossil fuels become increasingly scarce, renewable energysources are coming to the forefront of policy discussions around the globe. As a result,the State of Hawaii has implemented aggressive goals to achieve energy independence by2030. Renewable electricity generation using solar photovoltaic technologies plays animportant role in these efforts. This study utilizes geographic information systems (GIS)and Light Detection and Ranging (LiDAR) data with statistical analysis to identify howmuch solar photovoltaic potential exists for residential rooftops in the town of KailuaKona on Hawaii Island. This study helps to quantify the magnitude of possible solarphotovoltaic (PV) potential for Solar World SW260 monocrystalline panels on residentialrooftops within the study area.Three main areas were addressed in the execution of this research: (1) modelingsolar radiation, (2) estimating available rooftop area, and (3) calculating PV potentialfrom incoming solar radiation. High resolution LiDAR data and Esri’s solar modelingtools and were utilized to calculate incoming solar radiation on a sample set of digitizedrooftops. Photovoltaic potential for the sample set was then calculated with the equationsdeveloped by Suri et al. (2005). Sample set rooftops were analyzed using a statisticalmodel to identify the correlation between rooftop area and lot size. Least squares multiplelinear regression analysis was performed to identify the influence of slope, elevation,rooftop area, and lot size on the modeled PV potential values. The equations built fromthese statistical analyses of the sample set were applied to the entire study region tocalculate total rooftop area and PV potential.!" !
The total study area statistical analysis findings estimate photovoltaic electricenergy generation potential for rooftops is approximately 190,000,000 kWh annually.This is approximately 17 percent of the total electricity the utility provided to the entireisland in 2012. Based on these findings, full rooftop PV installations on the 4,460 studyarea homes could provide enough energy to power over 31,000 homes annually.The methods developed here suggest a means to calculate rooftop area and PVpotential in a region with limited available data. The use of LiDAR point data offers amajor opportunity for future research in both automating rooftop inventories andcalculating incoming solar radiation and PV potential for homeowners.! !
CHAPTER 1: INTRODUCTION1.1 Renewable Energy and Trends in Solar Photovoltaic Energy ProductionAround the globe, concern is mounting over conventional carbon based energyproduction. The issues at hand are numerous and include increasing atmospheric carbondioxide concentrations from greenhouse gas emissions, environmental safety of energyproduction techniques, volatile energy prices, and depleting carbon based fuel reserves toname a few (Nguyen and Pearce 2010; Choi et al. 2011). As a result, countries are facingan increasing challenge to diversify energy sources and bringing renewable generation tothe forefront of policy discussion.In the United States, a rise in renewable energy generation has been supported bythe availability of federal tax credits and programs in individual states (U.S. EnergyInformation Administration 2013a). Many states are implementing renewable portfoliostandards, or renewable energy standards, that outline goals to increase electricitygeneration from renewable resources (U.S. Energy Information Administration 2013a).These policies seek to remove barriers to install renewable generation and can includegrant programs, loan programs, and state renewable electricity tax credits. The Databaseof State Incentives for Renewables & Efficiency (DSIRE) provides an outline of staterenewable portfolio standards available throughout the nation (North Carolina StateUniversity 2013).In 2012, about 12 percent of U.S. electricity was generated from renewablesources (U.S. Energy Information Administration 2013b). The United States EnergyInformation Administration states that the five renewable sources most often utilizedinclude biomass, water, geothermal, wind and solar (U.S. Energy Information!%!
Administration 2013b). Of these, hydropower (water) contributed 7 percent of renewableelectricity generation (U.S. Energy Information Administration 2013c). The othercommon renewable sources make up the remaining 5 percent including wind (3.46percent), biomass (1.42 percent), geothermal (0.41 percent), and solar (0.11 percent)(U.S. Energy Information Administration 2013c). The study presented in this manuscriptfocuses on renewable generation from solar energy.Solar energy is received from the sun’s light rays hitting the earth and iscommonly referred to as solar radiation (U.S. Energy Information Administration 2013d).Solar radiation can be harnessed and converted to electricity by photovoltaic (PV)technologies. Photovoltaic cells produce electricity by absorbing photons and releasingelectrons that can be captured in the form of an electric current (Knier 2011). Cells can beused individually to power small electronics or grouped together into modules and arraysto generate larger amounts of power (U.S. Energy Information Administration 2013d).PV array systems are becoming an increasingly popular means for powering residentialand commercial locations in the form of distributed generation (Loudat 2013).The photovoltaic market in the United States has grown tremendously in the lastdecade (U.S. Energy Information Administration 2013a). PV is a robust technology thatpossesses a great deal of potential because it is both scalable and geographicallydispersed (Pearce 2002; Zekai 2004; Nguyen and Pearce 2010; Choi et al. 2011). In anarticle in Renewable Energy Focus, Dianna Herbst (2009) explains how PV productionhas been doubling every two years, increasing by an average of 48 percent each yearsince 2002, making it the world’s fastest growing energy technology. In 2012, PV!&!
technology consisted of 12 percent of all new U.S. electricity generation (InterstateRenewable Energy Council (IREC) 2013).Despite a banner year for solar technologies in 2012, it only comprises 0.11percent of overall electricity generation in the United States and many barriers to thewide scale adoption of photovoltaic production still exist (U.S. Energy InformationAdministration 2013c). Initial cost is a major barrier to implementation of PV systems(Súri and Hofierka 2004). Even with falling prices, renewable sources of energy are stillexpensive compared to traditional fossil fuel generation. The expense of installation andlack of information to quantify PV technology capacity, and thus predicting return oninvestment, are a few of the barriers facing the industry today (Choi et al. 2011; Herbst2012). Beyond financial factors there are a number of social and regulatory factors thatcan influence a consumer’s decision to purchase solar panels.In addition to existing renewable portfolio standards and tax credits, many state,city and local governments to break down barriers for distributed PV installation haveimplemented GIS-based modeling and decision support tools (Voivontas,Assimacopolous and Mourelatos 1998). Online solar potential maps are one type ofdecision support tool that is becoming increasingly popular throughout cities in theUnited States. Currently cities such as Boston, Denver, New York, Portland, San Diego,and San Francisco host online solar potential mapping sites available to the public. Theseallow users to evaluate the geographical, technological and financial factors that affectsystem performance and then predict the costs and benefits associated with installingsolar PV panels for both residential and commercial buildings.!'!
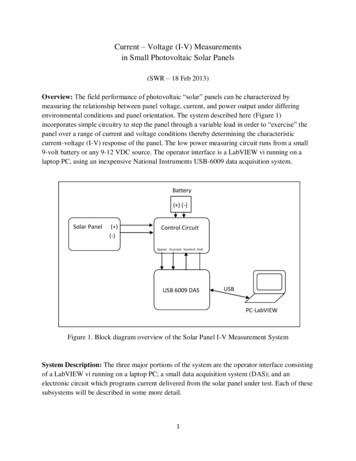
1.2 Electricity Demand in HawaiiThe economic consequences of fossil fuel dependence are profound in Hawaii.Figure 1.1 outlines the breakdown of electric energy sources as of February 2013 (U.S.EIA 2013e). The state relies on petroleum for 73 percent of its electricity generation and,with no indigenous fossil fuel resources like oil or coal, Hawaii must import the majorityof its energy resources (Piwko, et al. 2012; State of Hawaii Department of Business,Economic Development and Tourism (DBEDT) 2013a). The island chain is located over2,500 miles from any major land mass which greatly increases the cost of transport andtranslates into electricity rates that are three times greater than the U.S. average (Piwko etal. 2012; DBEDT 2013a; U.S. EIA 2013e).!"#" %&'()* ,- ,.'567-0!%.!8"97!(.!/,*-01,23!4'.!:"03; !'.! 0;1!% .!?,0* ,-3;1!'.!)* ,-!%.!Figure 1.1 Breakdown of electric energy sources in Hawaii(Source: Electric Power Monthly, U.S. EIA 2013e)Despite the state’s dependence on imported oil, there simultaneously exists anabundance of renewable energy generation sources including geothermal, ocean power,wind, and sunshine. To harness these, the state has one of the most aggressive cleanenergy goals in the nation. The Hawaii Clean Energy Initiative (HCEI) was launched in!(!
2008, when the governor of the State of Hawaii and the U.S. Department of Energysigned a historic agreement committing the state to achieve 70 percent clean energy
19.12.2012 · solar radiation, (2) estimating available rooftop area, and (3) calculating PV potential from incoming solar radiation. High resolution LiDAR data and Esri’s solar modeling tools and were utilized to calculate incoming solar radiation on a sample set of digitized rooftops. Photovoltaic potential for the sample set was then calculated with the .