Transcription
Lidar 101:An Introduction to Lidar Technology,Data, and ApplicationsNational Oceanic and Atmospheric Administration (NOAA)Coastal Services CenterCoastal Geospatial Services DivisionCoastal Remote Sensing ProgramNovember 2012
For More Information:Keil Schmid, NOAA Coastal Services CenterKeil.Schmid@noaa.gov, (843) 202-2620Authors and Contributors:Jamie Carter, Keil Schmid, Kirk Waters, Lindy Betzhold,Brian Hadley, Rebecca Mataosky, and Jennifer Halleran,NOAA Coastal Services CenterSuggested Citation:National Oceanic and Atmospheric Administration(NOAA) Coastal Services Center. 2012. “Lidar 101: AnIntroduction to Lidar Technology, Data, and Applications.”Revised. Charleston, SC: NOAA Coastal Services Center.NOAA Coastal Services Center2234 S. Hobson Ave.Charleston, SC 29405(843) 740-1200www.csc.noaa.govRegional Offices:NOAA Pacific Services Center, NOAA Gulf Coast Services Center, andOffices in the Great Lakes, Mid-Atlantic, Northeast,and West Coast
Table of Contents1.Introduction . 12.What Is Lidar? . 2Overview . 2What Is Lidar? . 3Lidar Platforms. 4Basic Terminology . 5Basic Principles and Techniques . 7Applications – A Quick Overview . 9History. 11Summary . 113.Data Produced by Lidar Sensors. 13Overview . 13Improvements over Previous Data . 13Vertical Accuracy. 13Horizontal Resolution . 14Temporal Resolution. 16Accuracy. 16Accuracy Assessment Techniques . 17Descriptive Terms . 17Data Types. 18Points . 18Digital Elevation Models (DEMs) . 20Contours. 23Summary . 244.Use of Lidar Data. 25Overview . 25Obtaining Lidar. 25U.S. Interagency Elevation Inventory . 26Digital Coast (NOAA Coastal Services Center) . 27
Loading Data into a GIS. 27Lidar Data and ArcGIS . 28Metadata. 39Summary . 395.Data Customization and Specification. 41Overview . 41Data Attributes. 41Return Numbers. 43Classification . 45Breaklines. 47Accuracy Specification and Tests. 48Qualitative Review of Lidar Data . 50Data Attribute Specification in Digital Coast . 53Summary . 556.Examples of Coastal Lidar Applications . 56Overview . 56Shoreline Mapping. 56Inundation Mapping . 61Wetland Habitat Delineation . 64Summary . 69Table of Abbreviations. 70Works Cited. 71
1. IntroductionLight detection and ranging (lidar) mapping is an accepted method of generating precise anddirectly georeferenced spatial information about the shape and surface characteristics of theEarth. Recent advancements in lidar mapping systems and their enabling technologies allowscientists and mapping professionals to examine natural and built environments across a widerange of scales with greater accuracy, precision, and flexibility than ever before. Severalnational reports issued over the past five years highlight the value and critical need of lidardata. The National Enhanced Elevation Assessment (NEEA) surveyed over 200 federal, state,local, tribal, and nongovernmental organizations to better understand how they use enhancedelevation data, such as lidar data. The over 400 resulting functional activities were grouped into27 predefined business uses for summary and benefit-cost analysis (NDEP, 2012). Several ofthese activities will be described in more detail in the applications section of this document.There are many considerations and trade-offs that must be understood in order to make sounddecisions about the procurement, processing, and application of lidar data. This documentprovides introductory and overview information, as well as in-depth technical information, tosupport decision-making in all phases of lidar projects. While the information presented here isnot comprehensive, it covers aspects of the technology that are the most common subjects ofdiscussion within the coastal management community.1
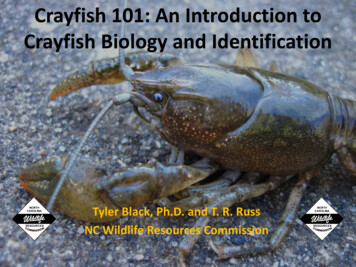
2. What Is Lidar?OverviewLidar has become an established method for collecting very dense and accurate elevation dataacross landscapes, shallow-water areas, and project sites. This active remote sensing techniqueis similar to radar but uses laser light pulses instead of radio waves. Lidar is typically “flown” orcollected from planes where it can rapidly collect points over large areas (Figure 2-1). Lidar isalso collected from ground-based stationary and mobile platforms. These collection techniquesare popular within the surveying and engineering communities because they are capable ofproducing extremely high accuracies and point densities, thus permitting the development ofprecise, realistic, three-dimensional representations of railroads, roadways, bridges, buildings,breakwaters, and other shoreline structures.Collection of elevation data using lidar has several advantages over most other techniques.Chief among them are higher resolutions, centimeter accuracies, and ground detection inforested terrain. This section will address 1) the basics of lidar, 2) the terminology, and 3) someexamples of how the data are routinely used.Figure 2-1. Schematic diagram of airborne lidar performing line scanning resulting in parallel lines of measuredpoints (other scan patterns exist, but this one is fairly common)2
What Is Lidar?Lidar, which is commonly spelled LiDAR and also known as LADAR or laser altimetry, is anacronym for light detection and ranging. It refers to a remote sensing technology that emitsintense, focused beams of light and measures the time it takes for the reflections to bedetected by the sensor. This information is used to compute ranges, or distances, to objects. Inthis manner, lidar is analogous to radar (radio detecting and ranging), except that it is based ondiscrete pulses of laser light. The three-dimensional coordinates (e.g., x,y,z or latitude,longitude, and elevation) of the target objects are computed from 1) the time differencebetween the laser pulse being emitted and returned, 2) the angle at which the pulse was“fired,” and 3) the absolute location of the sensor on or above the surface of the Earth.There are two classes of remote sensing technologies that are differentiated by the source ofenergy used to detect a target: passive systems and active systems. Passive systems detectradiation that is generated by an external source of energy, such as the sun, while activesystems generate and direct energy toward a target and subsequently detect the radiation.Lidar systems are active systems because they emit pulses of light (i.e. the laser beams) anddetect the reflected light. This characteristic allows lidar data to be collected at night when theair is usually clearer and the sky contains less air traffic than in the daytime. In fact, most lidardata are collected at night. Unlike radar, lidar cannot penetrate clouds, rain, or dense haze andmust be flown during fair weather.Lidar instruments can rapidly measure the Earth’s surface, at sampling rates greater than 150kilohertz (i.e., 150,000 pulses per second). The resulting product is a densely spaced network ofhighly accurate georeferenced elevation points (Figure 2-2)—often called a point cloud—thatcan be used to generate three-dimensional representations of the Earth’s surface and itsfeatures. Many lidar systems operate in the near-infrared region of the electromagneticspectrum, although some sensors also operate in the green band to penetrate water and detectbottom features. These bathymetric lidar systems can be used in areas with relatively clearwater to measure seafloor elevations. Typically, lidar-derived elevations have absoluteaccuracies of about 6 to 12 inches (15 to 30 centimeters) for older data and 4 to 8 inches (10 to20 centimeters) for more recent data; relative accuracies (e.g., heights of roofs, hills, banks, anddunes) are even better. The description of accuracy is an important aspect of lidar and will becovered in detail in the following sections.3
Figure 2-2. Lidar point and surface productsThe ability to “see under trees” is a recurring goal when acquiring elevation data using remotesensing data collected from above the Earth’s surface (e.g., airplanes or satellites). Most of thelarger scale elevation data sets have been generated using remote sensing technologies thatcannot penetrate vegetation. Lidar is no exception; however, there are typically enoughindividual “points” that, even if only a small percentage of them reach the ground through thetrees, there are usually enough to provide adequate coverage in forested areas. In effect, lidaris able to see through holes in the canopy or vegetation. Dense forests or areas with completecoverage (as in a rain forest), however, often have few “openings” and so have poor groundrepresentation (i.e., all the points fall on trees and mid-canopy vegetation). A rule of thumb isthat if you can look up and see the sky through the trees, then that location can be measuredwith lidar. For this reason, collecting lidar in “leaf off” conditions is advantageous for measuringground features in heavily forested areas.Lidar PlatformsAirborne topographic lidar systems are the most common lidar systems used for generatingdigital elevation models for large areas. The combination of an airborne platform and ascanning lidar sensor is an effective and efficient technique for collecting elevation data acrosstens to thousands of square miles. For smaller areas, or where higher density is needed, lidar4
sensors can also be deployed on helicopters and ground-based (or water-based) stationary andmobile platforms.Lidar was first developed as a fixed-position ground-based instrument for studies ofatmospheric composition, structure, clouds, and aerosols and remains a powerful tool forclimate observations around the world. NOAA and other research organizations operate theseinstruments to enhance our understanding of climate change. Lidar sensors are also mountedon fixed-position tripods and are used to scan specific targets such as bridges, buildings, andbeaches. Tripod-based lidar systems produce point data with centimeter accuracy and are oftenused for localized terrain-mapping applications that require frequent surveys.Modern navigation and positioning systems enable the use of water-based and land-basedmobile platforms to collect lidar data. These systems are commonly mounted on sport-utilityand all-terrain vehicles and may have sensor-to-target ranges greater than a kilometer. Datacollected from these platforms are highly accurate and are used extensively to map discreteareas, including railroads, roadways, airports, buildings, utility corridors, harbors, andshorelines.Figure 2-3. Mobile lidar collected from a vehicle (left) and a boat (right) (images courtesy of Sanborn and Fugro)Airplanes and helicopters are the most common and cost-effective platforms for acquiring lidardata over broad, continuous areas. Airborne lidar data are obtained by mounting a systeminside an aircraft and flying over targeted areas. Most airborne platforms can cover about 50square kilometers per hour and still produce data that meet or exceed the requirements ofapplications that demand high-accuracy data. Airborne platforms are also ideal for collectingbathymetric data in relatively clear, shallow water. Combined topographic and bathymetriclidar systems on airborne platforms are used to map shoreline and nearshore areas.Basic TerminologyA discussion of lidar often includes technical terms that describe the level of accuracy (a veryimportant aspect of lidar data), data collection, and the ensuing processing steps. LAS – abbreviation for laser file format; the LAS file format is a public file format for theinterchange of 3-dimensional point cloud data between data users. Although developedprimarily for the exchange of lidar point cloud data, this format supports the exchange5
of any 3-dimensional x,y,z tuplet. LAS is a binary file format that maintains informationspecific to the lidar nature of the data while not being overly complex. RMSE – abbreviation for root mean square error; a measure of the accuracy of the datasimilar to the measure of standard deviation if there is no bias in the data. Accuracy z , Fundamental Vertical Accuracy (FVA) – a measure of the accuracy of thedata in open areas at a high level of confidence (95%); calculated from the RMSE usingthe formula RMSE x 1.96 FVA. Classification – data that have been processed to define the type of object that thepulses have reflected off; can be as simple as unclassified (i.e., object not defined) tobuildings and high vegetation. The most common is to classify the data set for pointsthat are considered “bare earth” and those that are not (unclassified). Return Number (First/Last Returns) – many lidar systems are capable of capturing thefirst, second, third, and ultimately the “last” return from a single laser pulse. The returnnumber can be used to help determine what the reflected pulse is from (e.g., ground,tree, understory). Point Spacing – how close the laser points are to each other, analogous to the pixel sizeof an aerial image; also called “posting density” or “nominal point spacing.” The pointspacing determines the resolution of derived gridded products. Pulse Rate – the number of discrete laser “shots” per second that the lidar instrument isfiring. Systems used in 2012 were capable of up to 300,000 pulses per second. Morecommonly, the data are captured at approximately 50,000 to 150,000 pulses persecond. Intensity Data – when the laser return is recorded, the strength of the return is alsorecorded. The values represent how well the object reflected the wavelength of lightused by the laser system (e.g., 1,064 nanometer for most commercial topographysensors in the U.S.). These data resemble a black and white photo but cannot beinterpreted in exactly the same manner. RTK GPS (Real Time Kinematic GPS) – satellite navigation that uses the carrier phase (awaveform) that transmits (carries) the Global Positioning System (GPS) signal instead ofthe GPS signal itself. The actual GPS signal has a frequency of about 1 megahertz,whereas the carrier wave has a frequency of 1500 megahertz, so a difference in signalarrival time is more precise. The carrier phase is more difficult to use (i.e., theequipment is more costly); however, once it has been resolved, it produces a moreaccurate position in relation to the higher frequency. DEM, or Digital Elevation Model – a surface created from elevation point data torepresent the topography. Often a DEM is more easily used in a geographic informationsystem (GIS) or computer-aided design (CAD) application than the raw point data it isconstructed from.6
Basic Principles and TechniquesThe basic idea (Figure 2-4) is fairly straightforward: measure the time that it takes a laser pulseto strike an object and return to the sensor (which itself has a known location due to directgeoreferencing systems), determine the distance using the travel time, record the laser angle,and then, from this information, compute where the reflecting object (e.g., ground, tree, car,etc.) is located in three dimensions.Figure 2-3. Basic lidar data collection schematic from aircraft (Jie Shan, Purdue University)In reality, to achieve a high level of accuracy, this process is a bit more complicated since it isimportant to know, within a centimeter or so, where the plane is as it flies at 100 to 200 milesper hour, bumping up and down, while keeping track of hundreds of thousands of lidar pulsesper second. Fortunately, several technologies—especially the Global Positioning System (GPS)and precision gyroscopes—came together to make it possible.Major advancements in Inertial Measuring Units (IMU) or Inertial Navigation Systems (INS) havebeen instrumental in making the exact positioning of the plane possible. These systems arecapable of measuring movement in all directions and parlaying these measurements into aposition. They are, however, not perfect, and lose precision after a short time (e.g., 1 second). Avery highly sophisticated GPS unit, which records several types of signals from the GPSsatellites, is used to “update or reset” the INS or IMU every second or so. The GPS positions arerecorded by the plane and also at a ground station with a known position. The ground stationprovides a “correction” factor to the GPS position recorded by the plane.7
Likewise, lidar systems have advanced considerably. Early commercial units were capable of10,000 points per second (10 kilohertz) and were large and bulky. Newer systems are morecompact, lighter, have higher angular precision, and can process multiple laser returns in the air(i.e., a second laser shot is emitted before returns from the previous laser shot are received),allowing for pulse rates of over 300,000 per second (300 kilohertz).Multiple return systems, which are common, can capture up to five returns per pulse (Figure 25). This can increase the amount of data by 30% or more (100,000 pulses/second 130,000returns/second) and increases the ability to look at the three-dimensional structure of the“features above the ground surface,” such as the forest canopy and understory.Figure 2-4. Multiple returns from single pulse8
Applications – A Quick OverviewLidar, as a remote sensing technique, has several advantages. Chief among them are highaccuracies, high point density, large coverage areas, and the ability of users to resample areasquickly and efficiently. This creates the ability to map discrete changes at a very high resolution,cover large areas uniformly and very accurately, and produce rapid results. The applicationsbelow are examples of some common uses of lidar. Updating and Creating Flood Insurance Rate Maps (Figure 2-6) – This application is amajor driver in the development and use of lidar data. The application was largelybrought about when hurricanes hit North Carolina and the existing mapped flood zoneswere quickly shown to be inadequate.Figure 2-5. Lidar-derived floodplain used to delineate flood boundaries contrasted with previously mappedFederal Emergency Management Agency (FEMA) flood zone boundaries (courtesy of John Dorman, NorthCarolina Flood Mapping Program) Forest and Tree Studies – A very costly and time-consuming aspect of timbermanagement is the effort spent in the field measuring trees (Figure 2-7). Typically asample of trees is measured for a number of parameters and the results are statisticallyextrapolated throughout the harvest area. Trees must be measured to determine howmuch wood is present, when it is most appropriate to harvest, and how much to9
harvest. High-resolution, small-footprint lidar has been used to count trees and measuretree height, crown width, and crown depth. From these measurements, the standingvolume of timber can be estimated on an individual tree basis, or on a stand level withlarger footprint lidar.Figure 2-6. Tree canopy information (H height, CW crown width, S spacing) gathered from lidar (courtesy of Mississippi State University) Coastal Change Mapping – Mapping the coastal zone is an application that highlightsthe use of lidar data (Figure 2-8) along with GIS layers to increase the utility of both datasets. This highly dynamic region changes on very short timescales (e.g., waves, tides,storms), contains many natural habitats that are highly dependent on elevation, and isdensely populated. As a result, the rapid changes can affect significant populations andhabitats, both of which are becoming less tolerant to change (i.e., there is less ability toretreat). Lidar data provide the ability to measure specific events as well as longer-termtrends. This provides information that can be applied to immediate restoration solutionsfor critical areas, as well as sustainable planning to minimize future impacts.10
Figure 2-7. Coastal studies undertaken by the U.S. Geological Survey on Dauphin Island before andfollowing Hurricane KatrinaHistoryLidar technology is not new; it was developed over 40 years ago and was initially used formapping particles in the atmosphere. In this ground-based application, there was far lesspositional complexity (i.e., the position of the laser did not move) than in airborne mapping.During the 1980s, the development of GPS opened up the applications to moving sensors(airborne lidar). Bathymetric lidar was actually one of the first uses of airborne lidar. Thesurface of the water provided a “reference” that de-emphasized the absolute location of theairplane. The early 1990s saw the improvement of the IMU and the ability to begin achievingdecimeter accuracies. Some of the earlier non-bathymetric airborne applications were in themeasurement of glaciers and how they were changing. Ground-based lidar (terrestrial scanning)is also beginning to be used as a way to densely map the three-dimensional nature of featuresand ground surfaces to an extremely high level of accuracy (1 centimeter).SummaryLidar, which can also be referred to as LiDAR, LADAR, airborne laser altimetry, or airborne laserswath mapping, is a widespread and common data layer for a wide variety of applications.Topographic lidar data are typically gathered from airplanes and have benefited from recentadvancements in GPS and IMU technology. The technique can provide a dense suite of highlyaccurate elevation measurements over a large area. While lidar cannot penetrate through11
trees, the point coverage is dense enough to allow for ample ground measurement throughsmall holes in the canopy in most forested environments. Many of the traditional elevationapplications benefit from this increased accuracy and coverage, and new applications are beingmade possible because of the rich data density and high quality.12
3. Data Produced by Lidar SensorsOverviewThis section will review some of the aspects that make lidar an attractive data source for coastalmapping and natural resource management applications. The data products from lidartechnology can be delivered in several formats. This section looks at the various formats andtheir differences and the ways in which the data are verified and quantified. In essence, thissection will provide an overview of lidar data and the GIS products that are derived directlyfrom it.Improvements over Previous DataLidar data represent several important improvements over previous and commonly usedvertical data sets generated for U.S. Geological Survey (USGS) topographic quad maps. The dataavailable through the National Elevation Dataset (NED) have largely been created usingphotogrammetric techniques. The resulting accuracy of the NED is on the order of 3 meters or10 feet (Gesch, 2007) with 10- to 30-meter resolution. Photogrammetric elevation generation isa time-consuming, labor-intensive process, especially for high-accuracy products, and thereforeis a data set that is not updated often. Moreover, the ability to map areas hidden by or belowtrees is limited because the technique inherently requires that a location be visible from twovantage points (i.e., two images). The result is that much of the NED are fairly old, have verticalaccuracies that limit coastal applications, and have horizontal resolutions that preclude thedefinition of coastal features. Lidar, while similar in cost to photogrammetry, is a more rapidtechnique that relies largely on new technology to produce results. Note that the NED is beingupdated with lidar data as they become available, particularly for the newer 1/9th arc-second(about 3 meters) resolution NED, but as of 2011 only 28% of the U.S. excluding Alaska had lidarcoverage.Vertical AccuracyThe vertical accuracy of lidar data is much better than that of older elevation data that did notinclude lidar sources. For example, Gesch (2007) reviewed a recent version of the NationalElevation Dataset using high-accuracy control points and found that the vertical RMSE wasapproximately 2.4 meters (8 feet). This is a marked improvement over the NED from 1999 thathad an RMSE of 3.7 meters and did not include high-accuracy lidar data. Interestingly, even theolder lidar data sets typically have RMSE values of less than 20 centimeters (8 inches) and retaingreat value due to this level of accuracy. The NED is currently incorporating lidar elevation datasets and will have improved performance and utility in time. The topic of different accuracymeasures, including RMSE, is considered in greater detail in Section 5 (“Data Customization andSpecification: Accuracy Specification and Tests”).Lidar-derived elevation values in areas with tree coverage are much more dependable thanthose produced by other techniques because of the sheer number of lidar points. This ability tomeasure elevations in most obscured areas (Figure 3-1) is one reason the accuracy of lidar ismuch better (10x) than previously collected data. However, it is important to note thatphotogrammetric digital elevation model
1. Introduction Light detection and ranging (lidar) mapping is an accepted method of generating precise a