Transcription
THE FULL-WAVEFORM LIDAR RIEGL LMS-Q680I:FROM REVERSE ENGINEERING TO SENSOR MODELINGAndré Jalobeanu, Rresearch ScientistCGE, University of Évora, Portugaljalobeanu@uevora.ptGil R. Gonçalves, ProfessorINESCC and Dept. of Mathematics, University of Coimbra, Portugalgil@mat.uc.ptABSTRACTThe development of new data processing methods requires access to the raw data. Unfortunately some LiDAR manufacturers do not provide information about the format and the users can only rely on proprietary software to dotheir processing. Even if using black boxes might be sufficient for some simple applications, it might be an impediment to scientific research, as the processing would be limited to state of the art methods and their current implementation. In existing full-waveform LiDAR software there is a lack of error propagation methods that might be anissue when making quantitative measurements of topography, reflectance, or vegetation parameters. This problemcan only be addressed at the lowest level by working directly on the waveforms. Moreover, to improve range measurement and feature extraction techniques, and compute error bars correctly, one also needs an instrument model describing the data acquisition process.Here we focus on the Riegl LMS-Q680i airborne LiDAR sensor. We acquired 200 km2 of data (nearly 100 GBof undocumented binary files). We performed a reverse engineering to understand how the timestamps, look anglesand waveforms were stored. Then we developed a model of this particular sensor: the two nonlinear detector channels, the asymmetric amplifier impulse response and the ringing effect. Assuming this model, not only were we ableto match the output of the proprietary software, but we also managed to compute the range uncertainty, and weopened the way to new methodologies to improve the reliability and the accuracy of echo extraction.KEYWORDS: LiDAR, waveform, modeling, data acquisition, signal processing, error propagationINTRODUCTIONThe main goal of our research project (AutoProbaDTM) is to develop new methodologies to provide an uncertainty layer to digital elevation models (DEM) obtained from airborne LiDAR data, and demonstrate their applicability to large data sets. This is possible through the use of Bayesian inference (Jalobeanu, 2011) but it requires fullwaveform recording and processing (Chauve, 2007 and Mallet, 2009), and reading the raw data is essential. Moreover, to improve the range measurement algorithms and go beyond the current state of the art, and to freely processthe data without being constrained to use proprietary black boxes provided by the instrument manufacturers, oneclearly needs to have unrestricted access to the raw waveform data and all the related parameters.The funding source required the test area to be located in Portugal; we managed to contract the French companyIMAO to fly over 200 km2 of land using an IGI LiteMapper 6800, based on a Riegl LMS-Q680i sensor (Riegl); seeFig. 1 for area and flight details. The main dataset consists of 14 sdf files of 6 GB each and a POF (position and orientation file) generated by IMAO from a GPS base station recording and the on-board IMU data. A calibration crosswas flown; an initial boresight alignment (Shan, 2008) was performed by the company, and a new method is beingdeveloped within the project (Gonçalves, 2011). Experimental lines at 3000 m were flown with various pulse rates,beyond the specifications, to investigate how data processing could help to fly higher and cheaper and still obtainsatisfactory topography. More than 9000 control points of centimetric accuracy have been acquired since, and willbe used to check the georeferencing and validate the developed probabilistic DEM generation algorithms.Unfortunately at the time of the acquisition (June 2, 2011) no library nor documentation were available to helpread the binary files stored in the proprietary sdf format. Riegl did not release their free library RiWaveLib 1.0.11until late July, and even the latest version* at the time of writing has limited functionality, compiles on few systems**RiWaveLib 1.3.51, 32-bit Windows dll, Python wrapper;. Outputs only timing, origin, direction, facet number and raw datasamples. Light velocity given, but amplitude-dependent range correction and amplitude linearization missing.ASPRS 2012 Annual ConferenceSacramento, California - March 19-23, 2012
and computes an incorrect origin vector, so that it could not be used in practice for accurate processing of large datasets. Therefore we decided to start to reverse engineer the sdf format soon after data acquisition.Figure 1. Study area in Portugal (data acquisition by IMAO France) showing the flight lines and coverage density.REVERSE ENGINEERING METHODOLOGYInput Data and Software used in the Reverse Engineering Procedure A set of raw binary sdf files taken with various acquisition parameters; Copies of the smallest files with modified records, headers or data blocks; The proprietary software RiAnalyze (Riegl), used to view waveforms, mirror angles and timestamps; Text output generated by RiAnalyze during the extraction (range, angle, time and points in the sensor frame); Various log files and sdh parameter files (text files) generated by the software.MethodologyWaveforms. Starting with the smallest sdf files (a few seconds of acquisition) we used a hex editor to find patterns. The sync field or record separator ‘ZZZZ’ was easily visible. The waveform data, stored as 1-byte unsignedinteger arrays, was quickly found by plotting a few selected records and comparing the graphs with the waves in theRiAnalyze viewer; an emitted pulse is followed by one or more wave blocks corresponding to different channels andrange intervals (the received wave is chopped into blocks, a block is recorded if the intensity exceeds a threshold,and the maximum number of blocks recorded for each pulse is fixed in advance). The block length was found(stored in 4-byte units, just before the data, along with the channel type). At first sight the two channels (Lo and Hi,respectively designed to acquire low and high power returns) did not look compatible, as the signals for a same return did not match; only a radiometric model could explain how two versions of the same signal were obtained.Timing. Then we looked for the various timestamps, a relative one stored before each data block and an absolute reference within the record containing them. We found them oddly stored as 5-bytes integers, and in 4 ns units(like the data block length), not as they appear in the viewer. However, the record-related timestamp was differentfrom the expected absolute timestamp, and we had to look deeper into the file to understand how the GPS time synchronization was encoded. Actually, after each scan line, a record that does not look like a wave was found; theseare the control blocks containing the synchronization timestamps and ancillary data (sensor temperatures, etc.).Eventually, a 5-byte 4 ns-encoded value was found but after subtraction it only gave a fraction of the expected value,and the rest was stored as a more classical 4-byte integer representing the number of ms since the beginning of theweek (Sunday 0:00). At last, a correct timestamp was decoded. From the RiAnalyze extraction results we figuredhow to add this absolute reference, the relative timestamp and the wave optimum location to form an absolute pulsetime, which matched the output files to 1μs (rounding errors).Header. We then managed to extract the constant and variable instrument parameters as they were given in thesdh files as ‘name value’ in the same order as in the binary fields in the sdf header. Switching between viewing options in the hex editor helped to find the encoding (big endian) and the size of each field. Knowing the names andASPRS 2012 Annual ConferenceSacramento, California - March 19-23, 2012
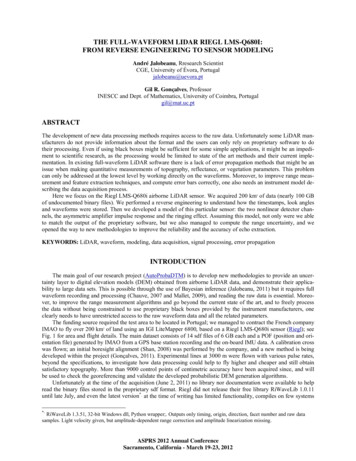
values was certainly helpful but insufficient to decode angles and compute ranges. Eventually, the use of the channels became clearer, as look-up tables were found and the characteristics of the channels were better understood.Scanning angle. The most difficult was to decode the angle θ, expected to be found in each record block as asingle float or integer representing a value between 60º and 120º. It turned out to be stored as 4 raw encoder valuesof 2 bytes each (was the onboard conversion too expensive for the embedded software?). It took some fiddling to getthe right combination of fine and coarse coefficients and offsets and convert the 4 integers into an scanning angle.We achieved 0.001º absolute deviation from the RiAnalyze output files.Ranging. Finding the range turned out to be more complicated than multiplying a travel time by c/2. In the end,we understood what the software computes and it motivated us to develop a radiometric model for the sensor. Afteradding a fixed combination of offset parameters, one has to add an amplitude-dependent offset, stored in the headeras a look-up table. We edited the files, by changing the parameters or replacing the data blocks with syntheticGaussian waves, to check and refine the equations for range and amplitude correction, and also for angle decoding.Geometry. Finally, once a range is computed and the angle is known, one needs a geometric model to obtain a3D point in the sensor frame; all we knew was that there were 4 mirror facets and a 60º field of view, and variousgeometric parameters were provided. We found a rotating square pyramid scheme that would be compatible with allthe constraints and parameter values, and that would produce the same results as RiAnalyze (up to rounding errors).Some fields in the pulse and control record blocks are still unexplained and we ignore them (e.g. the recordchecksum); the same is true for some header parameters, not essential to the decoding and extraction process.BINARY SDF FORMAT DESCRIPTIONFile StructureThe general structure is illustrated in Fig. 2; we keep the same color code in the following tables for clarity. Aheader is followed by rows of pulse records corresponding to a scan line, θ varying over the entire 60º field of view.Control records separate the rows and encode GPS time synchronization (when available) and housekeeping data.Each pulse record contains timing and angle information, the digitized emitted pulse, and a number of receivedwaveform blocks that can come from previously emitted pulses if there is more than one pulse in the air. The recordsare separated by 4-byte synchronization fields, and the record length is variable; these fields might be used in a simple indexing procedure if one needs random access to file records.Record Blocks and Reading AlgorithmThe header is read first; see Table 1 for a description of the fields. Throughout the file the big endian format isused and the bytes have to be reordered for little endian processors, most commonly used. The different blocks thatmake the pulse and control records are detailed in Table 2. When reading the Rec blocks, a flag determines the typeof record (pulse or control). We seek the first control record of the file to help synchronize the timestamps for thefirst row. The pulse records are processed as follows: timestamp, angle and the number of blocks are decoded fromRec. For each block DataHdr is decoded to get the type (emitted, high, or low), the block timestamp, and the numberof samples, then the corresponding wave is read, and so on. The emitted pulse comes first. For ground extraction,only the last received wave is considered, ignoring the others.Variable Decoding and ConversionTimestamps in Rec and Ctrl are stored as 5-bytes long integers. All other values are stored in a more conventional way (1, 2 or 4 bytes for integers, 4 bytes for floats). Each waveform sample occupies a single byte to minimize the storage space (the dynamic compression scheme is explained further).The variables and constants used for waveform extraction, renamed to simplify the equations, are shown in Table 3. The fields are decoded and converted according to rules derived from reverse engineering. In addition to unitconversion, offsets and factors are redefined, again to simplify the equations.In the header, the light velocity in the air is provided through a PPM correction factor. The range offsets r0 areprovided in mm but actually correspond to time delays, independent of the atmospheric conditions, hence the use ofthe light velocity correction. A 4 ns delay was also taken into account as a 0.60 m offset. The coarse angle encoderresolution K has a simple expression, but the fine encoders actually measure a time delay since the last coarse encoder step, hence the more complex expression of Kf involving pulse rate and number of pulses per scan line. Theencoder offsets are given in the header, but they had to be adapted, as their unit is not the same as the fine encoders.ASPRS 2012 Annual ConferenceSacramento, California - March 19-23, 2012
Figure 2. Q680 sdf format structure diagram showing the different types of blocks and their relative position.ASPRS 2012 Annual ConferenceSacramento, California - March 19-23, 2012
Table 1. Q680 sdf header structure: field name, length (bytes), type (u/i unsigned/signed integer, f float, s string),description and unit of each identified field. Big endian encoding.Names from sdh text file generated by RiAnalyze.ASPRS 2012 Annual ConferenceSacramento, California - March 19-23, 2012
Table 2. Q680 sdf block structure: field name, length (bytes), type (u/i unsigned/signed integer, f float, s string),description and unit of each identified field. Big endian encoding (conversion required for Intel-type processors).ACCURATE TIMING AND MTA PROCESSINGAccurate Pulse Time DeterminationThe time relative to an external synchronization timestamp is determined by adding the integer record and datatimestamps to the fractional pulse location within the wave block, obtained from signal processing (in italics).tE tRec tData tEmPulse andtR tRec tData tRecWave(1)For the emitted pulse, tEmPulse is obtained via simple Gaussian pulse estimation from 3 points near the optimum orthrough Gaussian fitting (Guo, 2011) but an estimation window should be used to avoid artifacts due to ringing effects in the tail (see Fig. 3). Given the high signal to noise ratio, the simple 3-point technique performs well.However, extracting the echo location tRecWave from the received signal is trickier, due to noise and various contaminants, and depends on the application, for instance topography or canopy mapping. Waveform processing is stillopen research (Mallet, 2009). Gaussian decomposition is a commonly used method (Hofton, 2000; Wagner, 2006)that provides a series of echo locations and is implemented in RiAnalyze (Riegl). Within the AutoProbaDTM project, we intend to improve the state of the art concerning the estimation accuracy and provide rigorous uncertaintyestimates as well, which are currently not available. We obtained more robust estimates of the ground echo (Jalobeanu, 2011) through the automatic selection of the estimation window size, allowing to reduce the bias when groundpeaks are contaminated by vegetation echoes; in these cases the Gaussian decomposition usually fails.GPS SynchronizationWhen available (it was in our dataset) GPS time synchronization enables one to use the emitted pulse time to interpolate the corresponding position and orientation in the POS file for direct georeferencing (sampled at 256 Hz inthe LiteMapper). W is the number of seconds since either the beginning of the day, or the beginning of the week;tsync is the current LiDAR ns timestamp counter at the moment of synchronization, therefore we have:T W 10-9 (tE - tsync)ASPRS 2012 Annual ConferenceSacramento, California - March 19-23, 2012(2)
Multiple Pulses in Air (MTA) ProcessingWhen there are multiple pulses in the air (number MTA) due to a combination of high repetition rate (PRR) andhigh altitude, the pulse emission times t are placed on a FIFO stack of size MTA so that we can compute:EΔt tR(n) - tE(n - Δn)(3)Table 3. Decoded variables and constants relevant to waveform extraction and processing, unit when applicable,and equations or sdf fields used. 3D vectors in bold, wave block processing results in italics.SENSOR RADIOMETRY AND RANGE ESTIMATIONRadiometric Information DecodingThe waveform data samples are stored in a simple 1-byte unsigned integer format, with 1 ns sampling interval.The instrument implements a dynamic range compression scheme through a nonlinear amplifier which reduces thefile size by a factor 2. The less sensitive channel (Lo) is almost logarithmic, while the other (Hi) has a more linearbehavior and is actually linear on [0,120]. To recover the original values the simplest way is to use the conversionarrays provided in the file header. This is valid for Gaussian pulse amplitudes, assuming the peaks are well separated, and should not be applied to raw wave sample values.ASPRS 2012 Annual ConferenceSacramento, California - March 19-23, 2012
Acorr F-1Lo[A] or(4)Acorr F-1Hi[A]The corrected amplitude ranges are [0,840] for Lo and [0,65565] for Hi. An intensity calibration needs to bedone (Shan, 2008) to transform these amplitudes and form intensity images.Ranging using Simple CorrectionsDue to various fixed time delays in the system, a range offset has to be added to the distance c Δt, however thisis not sufficient to obtain accurate results. Indeed, the transimpedance amplifier used in the receiver electronics exhibits sufficient nonlinearity to introduce a significant delay that depends on the amplitude.The simple solution is to use the provided look-up tables Δr with the underlying assumption is that the peaks arewell-separated; thus one can run a Gaussian fit, and use the estimated amplitude to correct the range as if the entireGaussian had been shifted. This is the solution that seems to be implemented in RiAnalyze (but not in the RiWaveLib library as it requires an amplitude to be known).1/2r r0Lo ΔrLo[A] c1/2 Δtorr r0Hi ΔrHi[A] c1/2 Δt(5)Accurate Radiometric Modeling and its ApplicationsThe simple processing just mentioned is based on assumptions that can be easily broken when consideringground peaks contaminated by low vegetation echoes. In such cases, classical Gaussian fitting can be replaced by arobust technique such as the one introduced by (Jalobeanu, 2011). In this work we had to account for ringing, notonly for contaminating peaks from real echoes. The ringing effect due to the amplifier is obvious (except when thesignal to noise ratio is very low) and false peaks could be extracted (see Fig. 3 for an illustration ).A solution consists of accurately modeling the overall impulse response (IR) of the amplifier. The easiest approach is to first neglect the nonlinearities and consider an amplitude-independent function made of a sum of Gaussians. Instead of performing a full deconvolution with the IR that requires regularization to avoid noise amplification,but which produces unwanted artifacts, we apply a partial deconvolution using only the peak positions and amplitudes from the IR, not trying to remove the effect of the Gaussian blur. This effectively removes the ringing andsuppresses the false detections. In practice we use the discrete kernel [1 0 0 0.03 0 0 0 0 0 0 0 0.04] and a Gaussianof full with at half maximum (FWHM) of 4.3 ns.IR modelRecWaveEmPulse-50510Figure 3. Accumulated normalized waves showing the ringing effect. Left: emitted pulses, right: received waves(single echo) and proposed impulse response (IR) model.The IR can be made amplitude-dependent, including the delay Δr function of the amplitude, for each channel.To be complete, the model should also include a nonlinear gain function f whose inverse would correspond to the F-1arrays. The IR model can be expressed as h(t,x) f(x) g(t-τ(x)) where τ is the signal-dependent delay function and gthe s
scribing the data acquisition process. Here we focus on the Riegl LMS-Q680i airborne LiDAR sensor. We acquired 200 km2 of data (nearly 100 GB of undocumented binary files). We performed a reverse engineering to understand h