Transcription
DOE/SC-ARM-TR-101Doppler Lidar (DL) Instrument HandbookRK NewsomDecember 2020R Krishnamurthy
DISCLAIMERThis report was prepared as an account of work sponsored by the U.S.Government. Neither the United States nor any agency thereof, nor any oftheir employees, makes any warranty, express or implied, or assumes anylegal liability or responsibility for the accuracy, completeness, orusefulness of any information, apparatus, product, or process disclosed, orrepresents that its use would not infringe privately owned rights. Referenceherein to any specific commercial product, process, or service by tradename, trademark, manufacturer, or otherwise, does not necessarilyconstitute or imply its endorsement, recommendation, or favoring by theU.S. Government or any agency thereof. The views and opinions ofauthors expressed herein do not necessarily state or reflect those of theU.S. Government or any agency thereof.
DOE/SC-ARM-TR-101Doppler Lidar (DL) Instrument HandbookRK NewsomR KrishnamurthyBoth at Pacific Northwest National LaboratoryDecember 2020Work supported by the U.S. Department of Energy,Office of Science, Office of Biological and Environmental Research
RK Newsom and R Krishnamurthy, December 2020, DOE/SC-ARM-TR-101Acronyms and AbbreviationsACFautocovariance functionADCARM Data CenterAGLabove ground levelAMFARM Mobile FacilityARMAtmospheric Radiation MeasurementASIAscension IslandCACTICloud, Aerosol, and Complex Terrain InteractionsCOMBLECold-Air Outbreaks in the Marine Boundary Layer ExperimentCORCórdoba, ArgentinaDLDoppler lidarDLWSTATSDoppler Lidar Vertical Velocity Statistics Value-Added ProductENAEastern North AtlanticFFTfast Fourier transformGoAmazonGreen Ocean Amazon 2014/15GPSGlobal Positioning SystemGVAXGanges Valley Aerosol ExperimentI&Qin-phase and quadrature signalsIMUinertial measurement unitIOPintensive operational periodIRinfraredLASICLayered Atlantic Smoke Interactions with CloudsLOlocal oscillatorMAOManacapuru, BrazilMOPAmaster oscillator power amplifierMOSAiCMultidisciplinary Drifting Observatory for the Study of Arctic ClimateMSLmean sea levelMURmaximum unambiguous rangeNAVNavigational Location and AttitudenetCDFNetwork Common Data FormNSANorth Slope of AlaskaOLIOliktok PointPECANPlains Elevated Convection at NightPPIplan position indicatorPSUpower supply unitRCFRadiometer Calibration Facilityiii
RK Newsom and R Krishnamurthy, December 2020, DOE/SC-ARM-TR-101RHIrange height indicatorRLRaman lidarSGPSouthern Great PlainsSNRsignal-to-noise ratioTBDTo be determinedTCAPTwo-Column Aerosol ProjectTWPTropical Western PacificUTCCoordinated Universal TimeVAPvalue-added productXPIAeXperimental Planetary boundary layer Instrumentation Assessmentiv
RK Newsom and R Krishnamurthy, December 2020, DOE/SC-ARM-TR-101ContentsAcronyms and Abbreviations . iii1.0 General Overview . 12.0 Contacts . 12.1 ARM Instrument Mentors . 12.2 Instrument Developer . 23.0 Deployment Locations and History . 24.0 Data Description . 74.1 Processed Data . 74.2 Raw Data . 94.2.1 Autocovariance Data . 114.2.2 Background Data . 164.3 Value-Added Products . 164.4 Annotated Examples . 164.5 Quiklook Plots . 205.0 Data Quality and Availability . 205.1 Data Availability . 205.2 Anemometer Comparison . 215.3 Bias from Hard Targets . 275.4 Radial Velocity Precision . 275.4.1 Linear Extrapolation . 295.4.2 Model-Based Extrapolation. 305.5 Beam Pointing Accuracy. 315.6 Potential Wind Farm Impacts on SGP . 316.0 Instrument Details. 326.1 Theory of Operation . 326.2 Specifications . 366.3 System Configuration and Scan Strategies . 386.4 Calibration . 386.4.1 Attenuated Backscatter Calibration . 386.4.2 Heading Calibration . 406.5 Operation and Maintenance . 456.5.1 User Manual . 456.5.2 Routine and Corrective Maintenance Documentation . 457.0 References . 45Appendix A – AET Raw Data Format . A.1v
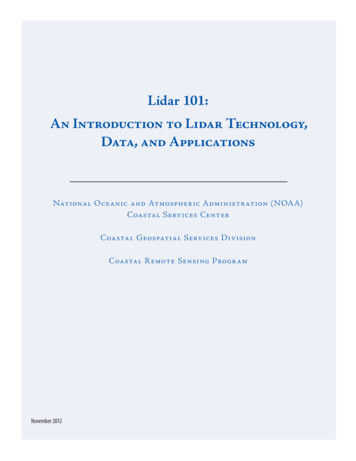
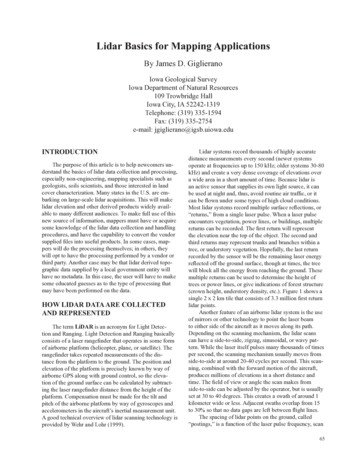
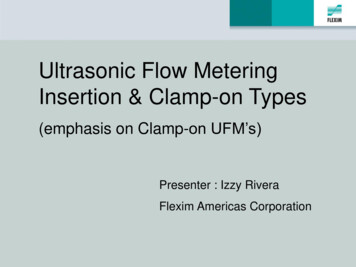
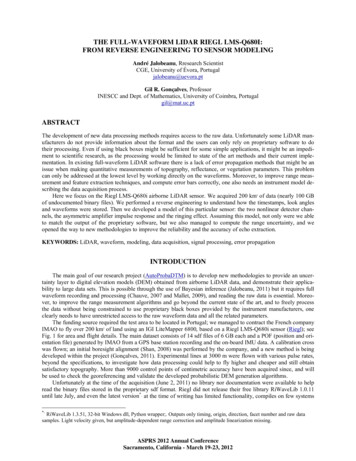
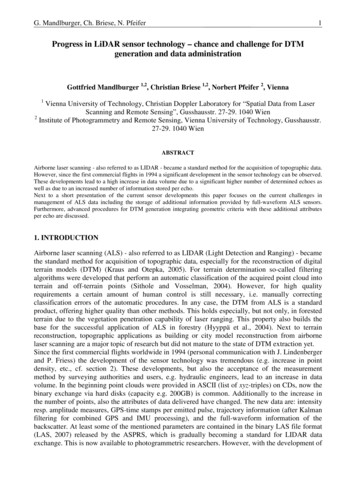
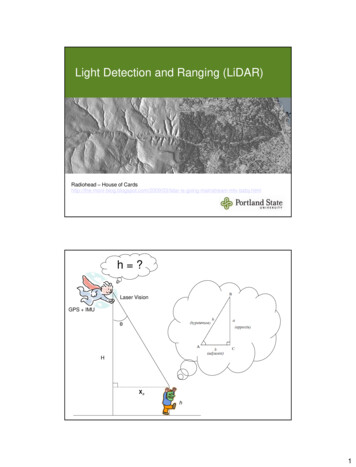
RK Newsom and R Krishnamurthy, December 2020, DOE/SC-ARM-TR-101Figures1The Halo Photonics Stream Line Pro and Stream Line (left), Stream Line XR (middle), andStream Line XR (right). . 32Current and past deployment locations for the ARM Doppler lidars. . 63The network of five Doppler lidars at SGP includes one Halo Photonics Stream Line at each ofthe extended facilities (E32, E37, E39, and E41) and one Stream Line XR and one Stream LineXR at the Central Facility (C1). . 74Examples of a) the autocovariance function, b) the raw atmospheric and noise spectra, and c) thenoise-floor-adjusted atmospheric Doppler spectrum. . 145Examples of Doppler spectra acquired under a) stable nocturnal conditions, and b) daytimeconvective conditions. . 146Examples of a) attenuated backscatter, b) SNR, c) unfiltered vertical velocity, and d) verticalvelocity for SNR 0.01. . 177a) Attenuated backscatter, and b) vertical velocity observed by the 0514-84 system at ENA C1between 10 and 12 UTC on 18 August 2019. . 188a) Attenuated backscatter, and b) vertical velocity as observed by the 0116-107 system at SGPC1 between 05:30 and 07:30 UTC on 23 July 2017. 189a) Attenuated backscatter, and b) vertical velocity as observed by the 0116-109 system atOliktok Point, Alaska between 13:30 and 15:30 UTC on 17 November 2019. . 1910 a) Unfiltered vertical velocity, and b) vertical velocity for SNR 0.01 as observed by the 0116109 system at Oliktok Point, Alaska between 12 and 13 UTC on 3 October 2019. 1911 This example shows how the range performance can be improved through reprocessing raw data. . 2012 Instrument placement during the lidar-anemometer comparison test at SGP C1 in June 2014. . 2213 The 10-m meteorological tower at SGP C1. 2214 Looking toward the 10-m meteorological tower from the 0514-83 Doppler lidar at SGP C1. . 2315 Looking toward the 10-m meteorological tower from the 0514-84 Doppler lidar at SGP C1. . 2316 1-min average radial velocities from the lidars (blue) compared to the corresponding 1-minaverage radial component of the anemometer winds (red) for a) 0514-83 versus anemometer, andb) 0514-84 versus anemometer. . 2417 Correlation diagram showing comparison between a) the average line-of-sight component of theanemometer versus the radial velocity measurements from 0514-83, and b) the line-of-sightcomponent of the anemometer versus the radial velocity measurements from 0514-84. 2418 Comparison dual-Doppler winds (blue) and anemometer measurements for a test conducted atSGP C1 from 17 to 21 June 2014. . 2619 Correlation diagram showing a comparison between the dual-Doppler-derived wind speed andthe wind speed measured by the Young wind sensor on the top of the 10-m meteorological towerat SGP. . 2620 Method of estimating the true variance from the autocovariance of the observed velocity timeseries. . 29vi
RK Newsom and R Krishnamurthy, December 2020, DOE/SC-ARM-TR-10121 Estimates of radial velocity precision as functions of SNR for a) 0910-09, b) 0910-07, c) 091008, d) 0514-84, e) 0116-107, and f) 0116-108. . 3022 a) Sample 10-min time series of vertical velocity from DL at 90 m AGL, b) Autocovariancefunction for the sample data set and respective linear or 2/3 fit, c) Vertical velocity varianceprofiles with and without noise correction. . 3123 Left: Locations of wind turbine relative to SGP. Right: Wind rose for all of 2019 at 90 m AGL asmeasured by the Doppler lidar at SGP C1. 3224 a) An example of an unshifted Doppler power spectrum, and b) the same spectrum after shiftingto baseband, i.e., complex demodulation. 3425 Components of the ARM Doppler lidar. . 3726 a) range-corrected SNR (red) and attenuated backscatter (blue), and c) attenuated backscattercalibration curve. . 3927 Attenuated backscatter factory calibration curves for six of the ARM DLs. . 4028 The old procedure for leveling involves placing a small circular level on the scanner plate whilethe scanner is in a vertical position. 4129 Example showing the SNR obtained from a hard-target scan. . 4230 a) Schematic top view of the Stream Line and/or Stream Line XR lidar with the scanner in itshome position, and b) the geometry for determining the home point direction of the lidar. . 4231 a) side view, and b) top view of the Halo Stream Line lidar illustrating a hypothetical offsetbetween the reported beam direction and the actual beam direction. . 4432 Flip test results for 0910-07 showing a) the azimuth offset, and b) the elevation offset. 45Tables1ARM Doppler lidars listed by vendor, model, serial number, and year acquired by ARM. . 22Deployment history for 0910-07 (Stream Line). . 43Deployment history for 0910-08 (Stream Line). . 44Deployment history for 0910-09 (Stream Line). . 45Deployment history for 0514-82 (Stream Line Pro). . 56Deployment history for 0514-83 (Stream Line). . 57Deployment history for 0514-84 (Stream Line). . 58Deployment history for 0116-107 (Stream Line XR). . 59Deployment history for 0116-108 (Stream Line). . 510 Deployment history for 0116-109 (Stream Line Pro). . 611 Deployment history for 0720-193 (Stream Line XR ). . 612 Doppler lidar scan type identifier used in the datastream names. . 813 Primary variables in the site dl scan type facility .b1 datastream. . 814 Processed and raw files collected between 15 and 16 UTC during CACTI on 14 December 2018. . 9vii
RK Newsom and R Krishnamurthy, December 2020, DOE/SC-ARM-TR-10115 Primary variables in the site dlacf facility .a0 datastream. . 916 The number of samples in the range dimension (nsamples) and the number lags (nlags) used torepresent the ungated ACFs in the raw data files (AET format). . 1117 Radial velocity offset parameter for each of the ARM Doppler lidars listed by serial number. . 1518 Primary variables in the site dlbackground facility .a0 datastream. . 1619 Data availability for all systems except 0319-160 and 0720-193, which was not available at thetime of this writing. . 2120 Results of the dual-Doppler-anemometer comparison. . 2721 Absolute mean radial velocity bias, 𝝁𝝁𝝁𝝁𝝁𝝁, and standard deviation, 𝝈𝝈𝝈𝝈𝝈𝝈, for measurements againsthard targets at SGP. . 2722 Specifications of the ARM Doppler lidars. . 3623 Typical system settings used in the operation of the ARM Doppler lidars. . 38viii
RK Newsom and R Krishnamurthy, December 2020, DOE/SC-ARM-TR-1011.0General OverviewThe Doppler lidar (DL) is an active remote-sensing instrument that provides range- and time-resolvedmeasurements of radial velocity, attenuated backscatter, and signal-to-noise ratio (SNR). The principle ofoperation is similar to radar in that pulses of electromagnetic energy (infrared in this case) are transmittedinto the atmosphere; the energy scattered back to the transceiver is collected and measured as atime-resolved signal. From the time delay between each outgoing transmitted pulse and the backscatteredsignal, the distance to the scatterer is inferred. The radial or line-of-sight velocity of the scatterers isdetermined from the Doppler frequency shift of the backscattered radiation. The DL uses a heterodynedetection technique in which the return signal is mixed with a reference laser beam (i.e., local oscillator)of known frequency. An onboard signal-processing computer then determines the Doppler frequency shiftfrom the power spectra of the heterodyne signal. The energy content of the Doppler spectra can also beused to estimate attenuated backscatter.The DL operates in the near-infrared (IR;1.5 microns) and is sensitive to backscatter from micron-sizedaerosols. Aerosols are ubiquitous in the lower troposphere and behave as ideal tracers of atmosphericwinds. In contrast to radar, the DL is capable of measuring radial velocities under clear-sky conditionswith very good precision (typically 10 cm/sec). Also, most of the U.S. Department of EnergyAtmospheric Radiation Measurement (ARM) user facility DLs have full upper-hemispheric scanningcapability, enabling three-dimensional mapping of turbulent flows in the atmospheric boundary layer.When the scanner is pointed vertically the DL provides height- and time-resolved measurements ofvertical velocity. Radial velocities are defined to be positive for motion away from the lidar.The DL is a small self-contained system that is easily portable and has relatively modest powerrequirements. The instrument is housed in a rugged environmentally controlled container, requires onlyexternal electrical power and internet, and will run unattended for weeks or months on end with little orno operator intervention. Control of the system is facilitated through either a direct connection to theonboard instrument computer or remotely via the internet. The control software enables the user to easilymodify a variety of instrument settings and schedule a variety of different scans.Researchers who are considering use of ARM resources should consider how the existing suite ofDoppler lidars might be used to address their science questions. Researchers should therefore be awarethat the lidars can be configured in a number of different ways, and that the current operationalconfiguration can be modified for specific intensive operational periods (IOPs). Specifically, researchersshould consider how different scan strategies might be used to address their research goals.2.0Contacts2.1 ARM Instrument MentorsRob NewsomPacific Northwest National Laboratory902 Battelle BoulevardP.O. Box 999, MSIN K9-301
RK Newsom and R Krishnamurthy, December 2020, DOE/SC-ARM-TR-101Richland, Washington 99352Phone: 509-372-6020Fax: 509-372-6168email: rob.newsom@pnl.govRaghavendra KrishnamurthyPacific Northwest National Laboratory902 Battelle BoulevardP.O. Box 999, MSIN K9-24Richland, Washington 99352Phone: 509-375-7310email: raghavendra.krishnamurthy@pnnl.gov2.2 Instrument DeveloperHalo PhotonicsUnit 2, Bank FarmBrockamin, Leigh, WorcestershireUnited Kingdom WR6 5LA GBPhone: 44 (0) 1886 833489Web site: www.halo-photonics.comGuy Pearson: guy@halo-photonics.comJustin Eacock: jus@halo-photonics.com3.0Deployment Locations and HistoryAs of the beginning of 2021, the ARM facility operates 11 coherent Doppler lidar systems at various sitesaround the world. To date, these systems have primarily been used to make high-resolution measurementsof vertical velocity, attenuated backscatter, and horizontal winds in the atmospheric boundary layer.ARM acquired its first three Doppler lidars in 2010 from Halo Photonics. The remaining systems werealso acquired from Halo Photonics through additional procurements in 2014, 2016, 2019, and 2020. Table1 lists the current ARM Doppler lidar inventory by vendor, model, serial number, and year acquired.Table 1.ARM Doppler lidars listed by vendor, model, serial number, and year acquired by ARM.VendorModelSerial numberYear acquiredHalo PhotonicsStream Line0910-072010Halo PhotonicsStream Line0910-082010Halo PhotonicsStream Line0910-092010Halo PhotonicsStream Line Pro0514-822014Halo PhotonicsStream Line0514-832014Halo PhotonicsStream Line0514-8420142
RK Newsom and R Krishnamurthy, December 2020, DOE/SC-ARM-TR-101VendorModelSerial numberYear acquiredHalo PhotonicsStream Line XR0116-1072016Halo PhotonicsStream Line0116-1082016Halo PhotonicsStream Line Pro0116-1092016Halo PhotonicsStream Line Pro0319-1602019As indicated in Table 1, the current inventory of Doppler lidars includes four models of Halo Dopplerlidars. The Stream Line, Stream Line XR and XR all incorporate many of the same design features,including an external scanner that permits the beam to be steered anywhere within the upper hemisphere,but the Stream Line XR and XR use enhanced signal processors and data acquisition cards, and transmithigher pulse energies compared to the standard Stream Line models. The Stream Line Pro, on the otherhand, uses an internal scanner with a reduced field of regard that only permits the beam to be steeredwithin 20o from zenith, for any azimuth angle. As such, the Stream Line Pro was designed primarily forvertical profiling. The ARM Stream Line Pros also use a 50-mm aperture as opposed to the 75-mmaperture in the Stream Line and Stream Line XR. This enables the Stream Line Pro to have a shorterminimum range than the Stream Line or the Stream Line XR. Section 6.2 discusses the performancespecifications in greater detail.Figure 1.The Halo Photonics Stream Line Pro and Stream Line (left), Stream Line XR (middle), andStream Line XR (right).Tables 2 through 11 summarize the deployment history for each of the ARM Doppler lidar systems listedin Table 1.3
RK Newsom and R Krishnamurthy, December 2020, DOE/SC-ARM-TR-101Table 2.Deployment history for 0910-07 (Stream Line).Deployment datesLocationStartEndSite-FacilityLatitude(deg North)Longitude(deg East)Altitude(m MSL)Comment20160503PresentSGP E4136.879945-97.086387340Top of profiling module2011042120160502SGP C136.605297-97.48649316Next to 915MHz2010101520101201SGP C136.60545-97.48579319Deck behind GIFTable 3.Deployment history for 0910-08 (Stream Line).Deployment datesLocationStartEndSite-FacilityLatitude(deg North)Longitude(deg East)Altitude(m MSL)Comment20160413PresentSGP E3936.819656-97.819869337Top of profiling module2015072320160408SGP S0136.607765-97.486988312On ground near 105.0038531583XPIA offsite IOP2010120620150104TWP C3-12.424547130.8915329.9Top of D VanTable 4.mobilePECAN offsite IOPDeployment history for 0910-09 (Stream Line).Deployment datesLocationLatitude (degSite-FacilityNorth)Longitude(deg East)Altitude(m MSL)CommentStartEnd20190825PresentANX S274.50344419.00452815COMBLE2018092320190430COR M1-32.12637-64.728541141CACTI2016090620171101ASI M1-7.9679-14.35039341LASIC2014010120150828MAO M1-3.21321-60.5982953GOAMAZON2012070120130619PVC M142.03046-70.0493257TCAP2011062120120331PGH M129.35884379.4582281942GVAX2010101520101130SGP S0136.60701-97.48796315SGP C1Near RCF4
RK Newsom and R Krishnamurthy, December 2020, DOE/SC-ARM-TR-101Table 5.Deployment history for 0514-82 (Stream Line Pro).Deployment datesLocationStartEndSite-FacilityLatitude(deg North)Longitude(deg East)Altitude(m MSL)20140801PresentNSA C171.322947-156.616098Table 6.CommentInstalled on GreatWhite deckDeployment history for 0514-83 (Stream Line).Deployment datesLocationStartEndSite-FacilityLatitude(deg North)Longitude(deg East)Altitude(m MSL)Comment20190419PresentSGP E3236.819656-97.819869335Top of trailer2016052420190419SGP E3736.310853-97.9274278389Top of trailer2014080120160512OLI M170.494856-149.886476Top of trailerTable 7.Deployment history for 0514-84 (Stream Line).Deployment datesLocationStartEndSite-FacilityLatitude(deg North)Longitude(deg East)Altitude(m MSL)Comment20141020PresentENA C139.091177-28.02682533Top of trailerTable 8.Deployment history for 0116-107 (Stream Line XR).Deployment datesLocationStartEndSite-FacilityLatitude(deg North)Longitude(deg East)Altitude(m MSL)Comment20160502PresentSGP C136.605295-97.486581319Top of RL utility vanTable 9.Deployment history for 0116-108 (Stream Line).Deployment datesLocationStartEndSite-FacilityLatitude(deg North)20190419PresentSGP E3736.310853-97.9274278389Top of trailer2016050320190419SGP E3236.819656-97.819869335Top of trailer5Longitude(deg East)Altitude(m MSL)Comment
RK Newsom and R Krishnamurthy, December 2020, DOE/SC-ARM-TR-101Table 10. Deployment history for 0116-109 (Stream Line Pro).Deployment datesLocationStartEndSite-FacilityLatitude(deg North)Longitude(deg East)Altitude(m MSL)Comment20160604PresentOLI M170.494856-149.886476Top of trailer2016050320160524SGP E3736.310853-97.9274278389Top of trailerTable 11. Deployment history for 0720-193 (Stream Line XR ).Deployment datesLocationStartEndSite-FacilityLatitude(deg North)Longitude(deg East)Altitude(m MSL)20200930PresentSGP S0136.6052-97.4857314Deployed at C1 insupport of IOP2020082620200930SGP E3236.819656-97.819869335Temporary replacementfor 0514-83CommentFigures 2 and 3 show the locations where ARM Doppler lidars have been or are currently deployed. Theobservatories include the Southern Great Plains (SGP), North Slope of Alaska (NSA), Eastern NorthAtlantic (ENA), and Oliktok Point (OLI). Currently, there is one Stream Line Pro at NSA C1, one StreamLine Pro at OLI M1, one standard Stream Line at ENA C1, five systems at SGP, and one spare unit. Thefive SGP systems include four Stream Line models at the boundary facilities (E32, E37, E39, and E41),one Stream Line XR at the Central Facility (SGP C1), and one Stream Line XR that functions as a sparebut otherwise operates at C1. The first ARM Mobile Facility (AMF1) has one Stream Line, and thesecond ARM Mobile Facility (AMF2) has one Stream Line Pro.Figure 2.Current and past deployment locations for the ARM Doppler lidars.6
RK Newsom and R Krishnamurthy, December 2020, DOE/SC-ARM-TR-101Figure 3.4.0The network of five Doppler lidars at SGP includes one Halo Photonics Stream Line at eachof the extended facilities (E32, E37, E39, and E41) and one Stream Line XR and one StreamLine XR at the Central Facility (C1).Data DescriptionThe ARM Doppler lidars can be configured to output processed and/or raw data. The processed datainclude range-resolved measurements of radial velocity, intensity (signal-to-noise ration [SNR] 1), andattenuated backscatter. The raw data include the Doppler spectra from which the processed data areobtained. Processed data are routinely logged, whereas raw data are only logged during selected IOPs dueto the data volume.Both processed and raw data are available (in netCDF format) for download using the ARM DataDiscovery tool (https://adc.arm.gov/discovery/). This section describes the contents and format of theprocessed and raw data files.4.1 Processed DataProcessed data files obey the following naming convention: site dl scan type facility .b1, where site is the site name (e.g., sgp, nsa, ena, etc.), scan type is the scan type identifier, and facility isthe facility designation (e.g., C1, E32, M1, S2, etc.)(ARM Standards Committee 2016). Seven scan typeidentifiers are currently in use: these are listed in Table 12.7
RK Newsom and R Krishnamurthy, December 2020, DOE/SC-ARM-TR-101Table 12. Doppler lidar scan type identifier used in the datastream names.Scan typeidentifierDescriptionfptFixed-beam stare. This can be either a slant-path or a vertical stare.ppiSingle-pass full-360o plan position indicator scanppi2Single- or multi-pass full or limited sector plan positio
31 a) side view, and b) top view of the Halo Stream Line lidar illustrating a hypothetical offset between the reported beam direction and the actual beam direction. 44 32 Flip test results for 0910 -07 showing a) the azimuth offset, and b) the elevation offset. 45 Tables 1 ARM Doppl