Transcription
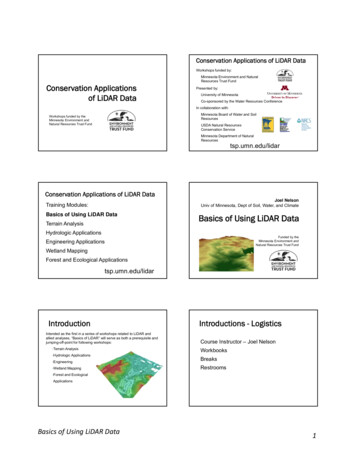
65Lidar Basics for Mapping ApplicationsBy James D. GiglieranoIowa Geological SurveyIowa Department of Natural Resources109 Trowbridge HallIowa City, IA 52242-1319Telephone: (319) 335-1594Fax: (319) 335-2754e-mail: jgiglierano@igsb.uiowa.eduINTRODUCTIONThe purpose of this article is to help newcomers understand the basics of lidar data collection and processing,especially non-engineering, mapping specialists such asgeologists, soils scientists, and those interested in landcover characterization. Many states in the U.S. are embarking on large-scale lidar acquisitions. This will makelidar elevation and other derived products widely available to many different audiences. To make full use of thisnew source of information, mappers must have or acquiresome knowledge of the lidar data collection and handlingprocedures, and have the capability to convert the vendorsupplied files into useful products. In some cases, mappers will do the processing themselves; in others, theywill opt to have the processing performed by a vendor orthird party. Another case may be that lidar derived topographic data supplied by a local government entity willhave no metadata. In this case, the user will have to makesome educated guesses as to the type of processing thatmay have been performed on the data.HOW LIDAR DATA ARE COLLECTEDAND REPRESENTEDThe term LiDAR is an acronym for Light Detection and Ranging. Light Detection and Ranging basicallyconsists of a laser rangefinder that operates in some formof airborne platform (helicopter, plane, or satellite). Therangefinder takes repeated measurements of the distance from the platform to the ground. The position andelevation of the platform is precisely known by way ofairborne GPS along with ground control, so the elevation of the ground surface can be calculated by subtracting the laser rangefinder distance from the height of theplatform. Compensation must be made for the tilt andpitch of the airborne platform by way of gyroscopes andaccelerometers in the aircraft’s inertial measurement unit.A good technical overview of lidar scanning technology isprovided by Wehr and Lohr (1999).Lidar systems record thousands of highly accuratedistance measurements every second (newer systemsoperate at frequencies up to 150 kHz; older systems 30-80kHz) and create a very dense coverage of elevations overa wide area in a short amount of time. Because lidar isan active sensor that supplies its own light source, it canbe used at night and, thus, avoid routine air traffic, or itcan be flown under some types of high cloud conditions.Most lidar systems record multiple surface reflections, or“returns,” from a single laser pulse. When a laser pulseencounters vegetation, power lines, or buildings, multiplereturns can be recorded. The first return will representthe elevation near the top of the object. The second andthird returns may represent trunks and branches within atree, or understory vegetation. Hopefully, the last returnrecorded by the sensor will be the remaining laser energyreflected off the ground surface, though at times, the treewill block all the energy from reaching the ground. Thesemultiple returns can be used to determine the height oftrees or power lines, or give indications of forest structure(crown height, understory density, etc.). Figure 1 shows asingle 2 x 2 km tile that consists of 3.3 million first returnlidar points.Another feature of an airborne lidar system is the useof mirrors or other technology to point the laser beamto either side of the aircraft as it moves along its path.Depending on the scanning mechanism, the lidar scanscan have a side-to-side, zigzag, sinusoidal, or wavy pattern. While the laser itself pulses many thousands of timesper second, the scanning mechanism usually moves fromside-to-side at around 20-40 cycles per second. This scanning, combined with the forward motion of the aircraft,produces millions of elevations in a short distance andtime. The field of view or angle the scan makes fromside-to-side can be adjusted by the operator, but is usuallyset at 30 to 40 degrees. This creates a swath of around 1kilometer wide or less. Adjacent swaths overlap from 15to 30% so that no data gaps are left between flight lines.The spacing of lidar points on the ground, called“postings,” is a function of the laser pulse frequency, scan65
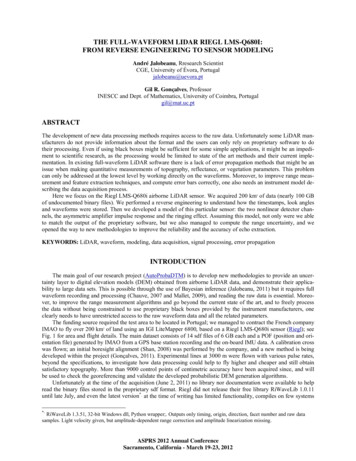
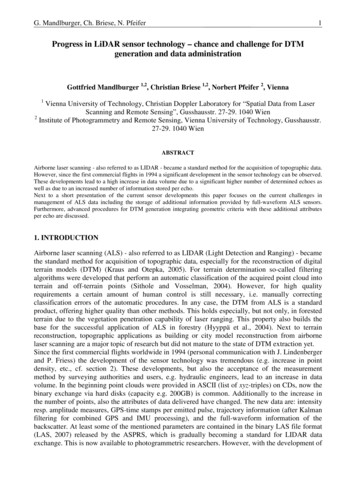
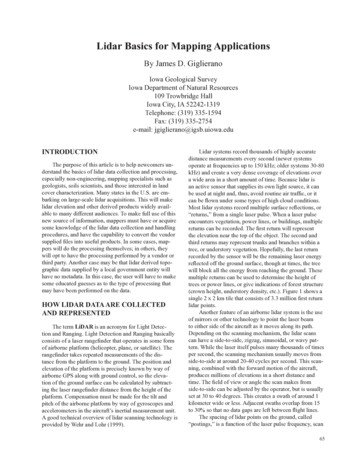
66D G TAL MAPP NG TECHN QUES ‘06Figure 1. Gray scale image consisting of 3.3 million lidarfirst return points or “postings.” First returns indicate thetops of trees and buildings as well as bare ground in openareas. White areas are data voids where no returns wererecorded, usually due to non-reflecting water surfaces.frequency, and flight height (Baltsavias, 1999). Whilethere is usually a nominal posting spacing specified in alidar project, actual data points have variable spacing thatare smaller and larger than the specified spacing. Mappers need to be aware of these effects when viewing finalproducts that were derived from the raw data. The secondaspect is that, because the laser scans from side to side,it interacts with the ground in different ways, dependingon the angle of incidence. Lidar pulses at the edge of ascan will strike the sides of buildings, whereas pulses atthe center of a scan will only strike the roof tops. Likewise, pulses at the edges of scans will pass through treesat an angle. Sometimes this will create “shadows” on theother side where no lidar passes through. In addition, lessenergy will return to the lidar receiver as it reflects awayfrom the aircraft. This is evident in the intensity imagescreated from the intensity values for each return: onecan see overall darkening of the intensity at the edges ofswaths. Edges of swaths appear darker than the returns atcenters of swaths.HOW LIDAR POINTS ARE PROCESSEDINTO TINS AND DEMSIn the Spring of 2005, the Iowa Department of Natural Resources (DNR) and others, had lidar with a nominalresolution of 1 meter collected by a commercial vendorover the Lake Darling watershed located in WashingtonCounty, Iowa. The vendor’s lidar system collected a firstand last return from each lidar pulse. From the first andlast returns, a so-called “bare earth” return was createdusing a proprietary classification algorithm developed bythe vendor. These classification systems try to sort outnon-bare earth returns (tree tops, buildings, power lines,automobiles) from bare earth returns. To distinguish bareearth in forested areas, differences in elevation betweenthe first and last returns, relative changes in elevation,and slope were used. Intensity data were used to identifyvegetation and man-made materials. The lidar data forthe Lake Darling watershed were collected in April withmostly leaf-off conditions. There are some data voids inforested areas due to non-penetration of the laser throughtree canopy, but these areas are generally less than 10meters across and are easily filled in by interpolation.Leaf-on conditions and tall crops, such as corn, do notallow easy penetration of the laser beam to the ground andshould be avoided.Lidar data for the Lake Darling area were suppliedby the vendor in ASCII text format, consisting of 2 x 2kilometer tiles with x and y coordinates, z elevations, andintensity values. With a nominal 1 meter posting spacing, some tiles had up to 3.3 million points. Postings nearthe center of the flight lines were close to the nominal 1meter spacing (Figure 2), while toward the ends of scans,the points converge with the start of the next scan (Figure3). While some scans converge, others diverge. Wherethe scans converge, the points can be less than half ofthe nominal spacing, and likewise, where they diverge,they can be twice the nominal spacing. Because somepoints can be as close as 0.5 meters, the tiles were initiallyinterpolated to create grids with 0.5 meter resolution, withthe idea that no data points should be merged or averagedwith any other points. There is a tendency among someusers to create grids with resolutions of 3, 5, and even10 meters to save storage space or reduce the volume ofdata to process. We desired to create the grids as close aspossible to the native resolution of the lidar data to evaluate their full potential to represent the smallest surfacefeatures.To make digital elevation models (DEM) from thetiles, the Surfer 8 software fer.shtml) was used. This softwarefirst creates a triangulated irregular network (TIN) beforeit interpolates the points into a raster DEM; however, oncethe DEM tiles were initially put together into mosaics, itbecame obvious that there were noticeable gaps betweeneach tile. To remedy this, a C program was created tosort through the ASCII text files of the adjacent tiles andfind points within a 3 meter buffer of the edge of the tileto be processed. Then the tiles were reprocessed addingthe 3 meter buffers. When these raster tiles were mergedtogether into a mosaic, the gaps were almost completelyeliminated. Leica Imagine (http://gi.leica-geosystems.
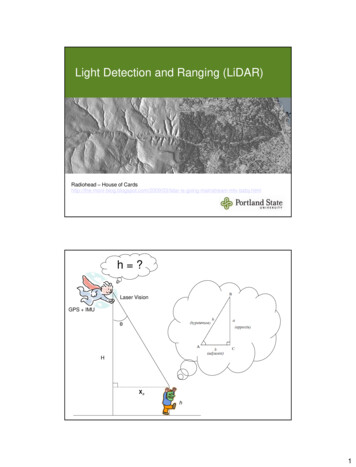
L DAR BAS CS FOR MAPP NG APPL CAT ONSFigure 2. Data near the middle of a lidar flight line. Posting spacing is around one meter at the center of back andforth scans.67the smallest topographic features, including small slopechanges of less than half-a-meter, even in forested areas.There were some data voids due to lack of penetrationthrough the dense tree canopy, but there were enough datapoints to show good definition of incised stream channels,meander scars, and gullies (Figure 4). Man-made featuressuch as road ditches and embankments, terraces, anddams were also well defined. Tillage patterns are evidentas regular lineated textures on crop fields parallel to theroad grid. These are not scanning artifacts as the individual scans are at a slight angle to the east-west flight lines.Because the bare earth processing does not remove100% of the forest artifacts, a distinctive bumpy patternis left in the bare model, which indicates the presence offorest cover (Figure 5). During field examination, it wasnoticed that different canopy structures were representedby different patterns in the artifacts. n the tall canopyfloodplain forest, most of the bumps were removed, whichleft a mostly smooth surface, while on side slopes withthick understory or brush cover, the texture on the shadedrelief image is rougher in appearance. nterestingly, thebare earth processing removed nearly all of the numeroustree falls in the stream channels, which allows drainage tracing programs to work well when following flowpaths downstream. Also, areas with pine trees were verysmooth, which indicated nearly complete penetration bythe laser beam.HOW TO USE LIDAR PRODUCTS FORMAPPING APPLICATIONSFigure 3. Data along overlap of two adjacent lidar flightlines (top and bottom of figure). The posting spacing ishighly variable at edges of flight lines. Some postings areless than one meter apart at the end of one and beginningof the next scan, while the distances between points in different sets of scans are as much as 1.5 meters apart.com/) was used to mosaic all the tiles into one large rasterDEM file. From the DEM, shaded relief images werecreated and compressed. DEMs and shaded relief imageswere then easily imported into ArcG S software (http://www.esri.com/) for display and further analysis.Field examination of the lidar bare earth shaded reliefimages was conducted in January, 2006. t was surprising how well lidar shaded the relief images representedOnce the raw lidar point tiles are processed intohigh-resolution DEMs, other useful mapping products canbe derived. The derived shaded relief image previouslymentioned (Figure 4) is very useful for visual display andinterpretation, and can be combined with colorized elevation images for extra information content. Another usefuldisplay product is the slope map, which can be derivedfrom the DEM using the grid processing tools found inalmost every G S package. Usually, a choice can be madewhether to calculate the slope rate in degrees or as percent(45 degree slope 100%). A slope map based on percentcan be grouped into slope classes typically used by soilsurvey mappers (slope class A 0-2%, B 2-4%, etc.)and readily compared to soil polygons displayed by slopeclass (Figure 6). Figure 7 shows the new level of detailavailable in slope classes derived from lidar data. n addition to the elevation component of the lidarreturn, many systems produce an intensity component thatindicates the strength of the lidar return. This intensityvalue is mostly influenced by the reflectance of the material struck by the laser pulse, but is also influenced by thescan angle. (Laser pulses directed away from the airplaneat significant angles do not reflect back as much lightenergy as a pulse directed straight down from the plane).Because most lidar systems use a laser that emits light in
68D G TAL MAPP NG TECHN QUES ‘06Figure 4. Portion of the bare earth shaded relief image of the Lake Darling watershed, showingnatural and man-made features readily apparent in the lidar data.Figure 5. Portion of a bareearth shaded relief imageshowing artifacts (bumpytexture) in deciduous forest areas. These artifactsare lidar elevations classified as bare earth, butprobably are from treetrunks, branches, or understory close to the groundand classified as bare earthby the vendor’s algorithm.
L DAR BAS CS FOR MAPP NG APPL CAT ONSFigure 6. Soil survey soil polygons shaded by slope class range: light shades are lower slopes anddarker shades indicate steeper slopes.Figure 7. Slope class ranges derived from Lake Darling lidar data. While low slope areas onlidar look similar to the soil polygons, lidar shows more detail on steep slopes such as gullies andstream channels.69
70D G TAL MAPP NG TECHN QUES ‘06the near-infrared portion of the spectrum (lidar used forLake Darling had a wavelength of 1064 nm), the intensity of lidar return is directly related to the near-infraredreflectance of the target material. An image constructedfrom the intensity component of the returns (Figure 8)looks very much like a black and white near-infraredaerial photograph. An intensity image has one interestingpeculiarity: tree shadows point away from the flight lines,so one can see shadows pointing in opposite directionsclose together at the edge of two flight lines. Becauseintensity is recorded from each lidar return, it is possibleto construct first return intensity images as well as lastreturn intensity images, and have them look quite different. This may especially occur in forested areas where thefirst return might mainly represent the treetops, while thelast return intensity represents many features, includingthe forest floor.VERTICAL ACCURACY TEST ANDINFLUENCE OF LAND COVERUsually, one of the first questions new users of lidarhave is about the vertical accuracy of the elevation data. n the Lake Darling project, the stated accuracy was 15cm (.5’) RMSE (root mean square error) in bare earthareas and 37 cm (1’) in vegetated areas. Because there areno high accuracy geodetic monuments in the watershedand access to survey grade GPS equipment was unavailable, another way to test the vertical accuracy neededto be found. Fortunately, a digital terrain model andassociated 2’ contours produced by aerial photographyand photogrammetric techniques for a road project wereavailable from the Washington County engineer’s office.This digital terrain model and contours were created by alocal aerial photography firm and had a stated vertical accuracy of 6.1 cm (.2’). The area covered by the model wasover 2 miles long and a quarter of a mile wide. The digitalterrain model consisted of elevation points and break lines(Figure 9) in CAD format. Using the 3D ANALYSTextension in ArcGIS, the photogrammetrically derivedterrain model was converted into a triangulated irregularnetwork or TIN, and interpolated into a 1 meter elevationgrid. The lidar elevation grid was subtracted from the gridmade by photogrammetry to produce a simple differencegrid. The overall average difference between the two gridswas only 3.3 cm (.11’). To compare the two grids to theirstated accuracies, the RMSE had to be calculated. First,the simple difference grid was multiplied by itself to create the squared difference grid. Using a polygon coverageof land cover from 2005, the mean squared differencewas calculated for each land cover class using the zonalstatistics command in ArcToolBox. By using the spatialcalculator function in the SPATIAL ANALYST extension, the square root of the values in the “mean” fieldFigure 8. Portion of a lidar intensity image of the Lake Darling watershed, constructed from bareearth return intensity values.
L DAR BAS CS FOR MAPP NG APPL CAT ONS71higher accuracy source, then the lidar meets its statedaccuracy of 15 cm in the bare ground areas, and under 37cm in the vegetated areas. This appears to be a good testof lidar accuracy because it includes many types of landcover conditions, not just a few high accuracy locations atbenchmarks on roads or nearby ditches.COMPARING OLD AND NEW DATAFigure 9. Portion of shaded relief digital terrain modelderived from low altitude aerial photos. The black dots areelevation mass points and the black lines are break lines.of the table was calculated, and the RMSE was foundfor each land cover class. The zonal statistic tool alsocomputes a “count” of cells for each class and a “sum” ofthe elevations within that class. By calculating the sum ofall the “count” field values and “sum” field values for allthe classes, and dividing the total sum by the total count,the average squared difference for the entire dataset wasfound. By taking the square root of this value, the RMSEwas found for the whole area. Initially, RMSE betweenthe lidar DEM and the photogrammetry DEM was foundto be .79 feet or 24.1 cm.Upon examination of the squared difference image, it was apparent that the terrain in several areas hadchanged significantly between the time of the airphotoflight in 2000 and the lidar flight in 2005. These mainlyincluded areas where the installation of sediment retention structures and dams, and road grading had occurred.When these areas were digitized and excluded from thesquared difference calculation, the overall RMSE wasfound to be .57 feet or 17.4 cm (Figure 10). The RMSEof the row crop area was .46’ (14.3 cm), grass areas .62’(18.9 cm), and forested areas .85’ (25.8 cm). If the DEMderived by photogrammetric means is accepted as theOne of the first tests of any new lidar data set is tocompare it with the existing DEM derived from the 10’contours from the USGS topographic quadrangle mappingprojects of the latter half of the last century. Displayed atsmaller scales, it is difficult to see much difference between the shaded relief images derived from the 30 meterresolution National Elevation Dataset or NED (http://ned.usgs.gov/) and lidar shaded relief. Only when the display is zoomed into larger scales is it possible to see themarked differences between the 30 meter NED (Figure11) and lidar DEM (Figure 12). Visible on the lidar image(but not on the 30 meter NED shaded relief image), areman-made features such as roadways, ditches, fence lines,terraces and dams. Natural features such as stream channels, gullies, and floodplains are also visible.Lidar excels at mapping topographically challengedareas: areas with little relief. Figure 13 is a shaded reliefimage, derived from the 30 meter NED, that shows typical glaciated terrain in north-central Iowa, east of SpiritLake in Dickinson County. Figure 14 shows the same areausing 1 meter resolution lidar, which focuses the indistinct mounds seen on the NED shaded relief into sharplydefined, circular, and elongated features. These are interpreted to be remnants of ice walled lakes, which formedon the surface of the glacier. These lakes had varyingamounts of sediment deposited in them, and after the icemelted, these sediments formed indistinct, low mounds(Quade et al., 2004).Figure 15 shows the Missouri River floodplain northof Council Bluffs, Iowa, in a view, which again, uses the30 meter resolution NED to create a shaded relief image.It reveals numerous defects in the original conversion ofwidely spaced contours on a very flat surface. With a 10’contour interval, there is not enough information to interpolate features on the floodplain adequately. The shadedrelief image reveals cross-shaped artifacts within theDEM, which were created by the interpolation software’sattempt to connect widely spaced data. Figure 16 showsthe great improvement afforded by interpolating a surfacefrom closely spaced lidar points (about 2 meter lidar postings). Missouri River meander scars, levees along drainage ditches, fence lines, interstate lanes, railroad right-ofways, borrow pits, and sewage lagoons are all visible onthe lidar shaded relief image.When using shaded relief images for on-screendigitizing, geological mappers will need to become accustomed to recognizing and separating man-made as well
72D G TAL MAPP NG TECHN QUES ‘06Figure 10. Root mean square error (RMSE) calculation of photogrammetrically derived DEM andlidar DEM, after 2000/2005 landscape-change areas removed from calculation.Figure 11. Portion of a shaded relief image made froma National Elevation Dataset (NED) 30 meter resolutionDEM. Area is from Lake Darling watershed in Washington County, Iowa.Figure 12. Portion of shaded relief image made from a 1meter resolution lidar DEM for the same area in Washington County, Iowa.
L DAR BAS CS FOR MAPP NG APPL CAT ONS73Figure 13. Portion ofa shaded relief imageshowing recently glaciatedterrain near Spirit Lake inDickinson County, Iowa.The shaded relief wascreated from a 30 meterresolution DEM from theNational Elevation Dataset(NED).Figure 14. Portion of alidar-derived shaded reliefimage of the same area ofglacial terrain near SpiritLake in Dickinson County,Iowa. Notice how theshapes of subtle, low reliefglacial features are nowreadily apparent.
74D G TAL MAPP NG TECHN QUES ‘06Figure 15. Portion ofa shaded relief imageshowing the MissouriRiver floodplain north ofCouncil Bluffs, Iowa. Theshaded relief image wascreated from a 30 meterresolution DEM from theNational Elevation Dataset(NED). Notice the crossshaped features that areartifacts of the interpolation of the original 10’contours from USGS topographic maps.Figure 16. Portion of alidar-derived shaded reliefimage of the same areaon the Missouri Riverfloodplain (see Figure 15).Notice the much finer detail showing the interstatecloverleaf, river meanderscars, borrow pits, and aditch and levee system.Lidar DEM was obtainedfrom the PottawattamieCounty GIS Department.
L DAR BAS CS FOR MAPP NG APPL CAT ONSas geomorphic features. Because shaded relief imagescan represent the encoding of relatively small changes inslopes, mappers will need to build up criteria for recognition of everyday features using the clues in contrast,shading, shape, texture, pattern, and context contained inthese images. n the past, geological mappers learned howto interpret aerial photos by poring over example afterexample of natural and man-made features. They alsolearned how to interpret geological features by looking atgeomorphic signatures on topographic maps. Lidar willrequire relearning and reinventing both techniques bymoving the geomorphic scale down to the realm of theairphoto, roughly at resolutions from 1 to 5 meters. Whilequalitative information on slopes was available by way ofstereo viewers and aerial photos, there has never been asmuch quantitative slope information available until nowwith the advent of lidar data. With digital elevation dataderived from lidar, new computer assisted classificationstrategies for geomorphic feature interpretation can be developed, as can new types of imagery to support manualinterpretations.SUMMARYLarge-scale lidar acquisitions will provide mapping professionals with an increase of new, high qualityelevation data to use as base maps for their projects. Totake full advantage of this new data source, those who are75mapping need to be aware of how lidar data are collectedand what data reduction processes commercial vendorsuse to make deliverable products for their clients. n manycases, mappers will want to manipulate the raw lidarreturns into their own T Ns, DEMs, and derived products,but sometimes they will only have access to vendor-supplied, finished products that have undergone unknownprocedures to make the visual appearance more appealing. Mappers can use shaded relief images derived fromlidar DEMs or T Ns for on-screen digitizing, as well asnew derivative products such as terrain slope and lidarintensity to identify geologic features and other features.Anyone using lidar data will be interested in the absolutevertical accuracy of elevations and will need to know howland cover type affects that accuracy.REFERENCESBaltsavias, E.P., 1999, Airborne laser scanning: basic relationsand formulas: SPRS Journal of Photogrammetry and Remote Sensing, no. 54, p. 199-214.Quade, D.J., Giglierano, J.D. and Bettis, III, E.A., 2004, Surficial geologic materials of the Des Moines Lobe of owa,Phase 6: Dickinson and Emmett Counties: DNR/ GS,OFM-0402, 1:100,000 scale, accessed at df.Wehr, A. and Lohr, U., 1999, Airborne laser scanning – an introduction and overview: SPRS Journal of Photogrammetryand Remote Sensing, no. 54, p. 68-82.
Data near the middle of a lidar flight line. Post-ing spacing is around one meter at the center of back and forth scans. Figure 3. Data along overlap of two adjacent lidar flight lines (top and bottom of figure). The posting spacing is highly variable at edges of flight lines. Some posting