Transcription
MICROCELLULAR NANOCOMPOSITE INJECTION MOLDING PROCESSMingjun Yuan(1), Lih-Sheng Turng(1)*, Rick Spindler(2), Daniel Caulfield(3), Chris Hunt (3)(1) Dept. of Mechanical Engineering, University of Wisconsin-Madison, Madison, WI 53706, USA(2) Kaysun Corporation, Manitowoc, WI 54221, USA(3) USDA Forest Products Laboratory, Madison, WI 53726, USAAbstractThis study aims to explore the processing benefitsand property improvements of combining nanocompositeswith microcellular injection molding. The molded partsproduced based on the Design of Experiments (DOE)matrices were subjected to tensile testing, impact testing,and Scanning Electron Microscope (SEM), TransmissionElectron Microscope (TEM), Dynamic MechanicalAnalysis (DMA), and X-ray Diffraction (XRD) analysis.Effects of processing conditions on the mechanicalproperties and microstructures have been studied. Theresults show that the supercritical fluid (N2) helps tofurther exfoliate and uniformly disperse the nano-clays inthe matrix during the course of molding process.Compared to the corresponding base polyamidemicrocellular parts, the microcellular nanocompositesexhibit better cell structures and cell distributions as wellas better mechanical properties.IntroductionPolymer-silicate nanocomposites represent a newclass of high performance materials. They offer improvedstiffness, heat resistance, barrier and flame retardation,and dimensional stability with a small clay load ( 10%).However, polymer nanocomposite is still economicallyunfavorable compared to conventional polymericmaterials.In microcellular injection molding, “supercritical”nitrogen or carbon dioxide is injected into the machinebarrel to create a single-phased polymer-gas solution. It iscapable of producing parts with a microcellular structure(microcells of 1 to 100 microns) while using lowerinjection pressure, shorter cycle time, and less material. Iteliminates the need of packing pressure, and improves thedimensional stability of the molded parts. Microcells alsogreatly enhance the part toughness of many polymericmaterials by acting as crack arrestors.Previous studies have shown that the addition of thenano-clay fillers greatly increases the viscosity of thepolymer [1]. On the other hand, blending supercritical gasinto polymer melt effectively reduces the viscosity andthe glass transition temperature of the polymer melt, aswell as the interfacial tension [2]. Hence, addingsupercritical gas into the nanocomposites renders amethod to tailor the rheological and surface properties ofthe polymer to facilitate better microcell formation andimproved mechanical properties. The batch process ofmicrocellular nanocomposite has been reported [3]. Butdevelopment of continuous or semi-continuousmicrocellular nanocomposite processes such as injectionmolding on the industrial scale is more appealingconsidering the property-to-cost ratio and broaderapplications.ExperimentsMaterials and experimental designsThree different types of base polyamide resins (B, D,F) and their corresponding nanocomposite counterparts(polyamide-clay nanocomposite A, C, E) were injectionmolded using a 150-ton injection-molding machineequipped with microcellular injection molding capability(MuCell process). The experiments were first executedbased on the L16 orthogonal array fractional factorialdesign. After screening the experimental parameters, theL9 orthogonal array (Table 1) design was then used inorder to increase the precision of experiments. The L9experiments contain four different operation variables atthree different levels. This study was focused on thenanocomposite C and its base resin D. Additionally, somespecific trials were conducted to obtain higher weightreduction parts and solid parts for the purpose of propertycomparison.TechniquesThe molded parts (standard dog-bone tensile testingbars and straight impact testing bars) were subjected totensile testing, impact testing, following ASTM-D-63802 and ASTM-D-256-02 standards, respectively. Thesamples were also examined by Scanning ElectronMicroscopy (JEOL SEM with accelerating voltage of 20kV), Transmission Electron Microscopy (JOELJEM100CX TEM), Dynamic Mechanical Analysis(DMA, Rheometrics DMTA-V), and X-ray Diffractionanalysis (XRD, STOE high resolution X-raydiffractometer with Cu Kα radiation at 40 kV and 25mA). SEM samples, TEM samples, and DMA sampleswere taken from the middle of the molded dog-bone bar.The SEM samples were characterized both in the meltflow direction and along the direction normal to the meltflow. The XRD samples were made by cutting and finepolishing the dog-bone in the middle plane in thethickness direction. Additional SEM micrographs weretaken of tensile testing fracture surfaces.Results and DiscussionThe SEM results of microcellular structure areexemplified in Figures 1 through 9. Micrographs inFigures 1 through 4 were taken at the centers of samples.*To whom correspondence should be addressed.ANTEC 2003 / 691
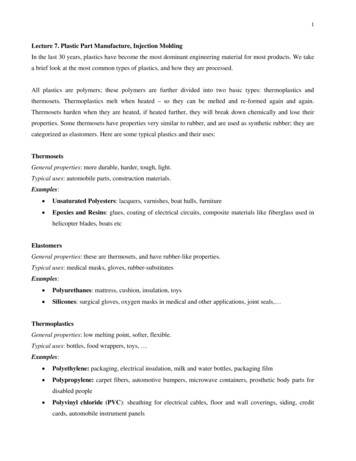
Figures 1 and 2 present the difference in cell structurebetween the microcellular nanocomposite, C, and its baseresin, D, microcellular samples under the same moldingcondition. Nanocomposite has relatively smoother cellwall whereas its base resin has rougher wall surface. Itimplies that the nanoclay affects the cell formation andstructure directly. Figures 1 and 3 show the comparisonof microcellular structures between samples of samenanocomposite under different operation conditions. Evenwith the same amount of SCF addition, Trial C9 gaveover 5-fold finer cells than Trial C3. Its cell density isabout 150 times higher than that of the latter. In this case,high melt temperature and small shot size contribute tofiner microcells.Comparison between Figures 3 and 4 presents somecontrolled nucleation and growth of microcells with thenanocomposite as compared to its base resin. Microcellswith smoother wall surface observed in thenanocomposite parts were normally smaller than those inthe base resin parts. The experiments do show a slightlybetter control over the cell size at increased gasconcentrations, possibly and partially because of a morehighly dispersed nano-clay phase in the polymer/gasmatrix. This is supported by TEM and XRD results.Figure 4 also indicates that the processing condition canimprove the cell wall surface quality of the base resin. Asthe weight reduction of part increases, the heterogeneouscell growth and formation of base resin becomes moreobvious as shown in Figure 4.For base resin under different experimentalconditions, the micrographs taken at the ends of samplecross-sections, as shown in Figure 5 and 6, show that theprocessing conditions also have some influence on thecell structure. It is understandable because nucleation andgrowth of cells are directly affected by the processingconditions such as melt temperature and injectionpressure and pressure drop rate.The micrographs in both Figures 7 and 8 show theentire sample cross-sections. It was verified that the solidboundary layer of microcellular nanocomposite partpresents little structural difference from its fully solidcounterparts. However, the gradual cell structuralvariation can be clearly seen from the surface layer to thecenter of part in the direction normal to the melt flowdirection (Figure 7). However, it is usual to see variationin cell structure and cell distribution across the partthickness along the melt flow direction. Elongatedmicrocells are visible in the vicinity of surface layer dueto the fountain flow and the shear force (Figure 8), whileuniform round shape cells occur in the center. The sametrend was seen in the base resin microcellular parts.At high weight reductions, even with the presence ofnano-particles in microcellular parts, it was observed thatthe cell coalescence may take place, and some open cellscan be formed under higher weight reduction conditions.It is also normal to see the irregular cell structure and celldistribution when the part weight reduction is high. Thebig voids can be easily found when the weight reductionof parts increases.The fractographs of microcellular nanocompositetensile testing bars are shown in Figure 10 (taken at a692 / ANTEC 2003quarter length to the edge). Combining with Figure 12, itcan be seen that the operation conditions affectsignificantly the fracture behaviors of microcellularnanocomposite. Based on the textures at the fracturedsurfaces, the molded parts under different processconditions exhibit a somewhat brittle, ductile, or hybridfracture behavior. Samples of Trial 1 in Table 1 (low melttemperature and shot size) have certain ‘brittle’ fracturedstructure across the entire cross-section. On the otherhand, samples of Trial 7 (high melt temperature and shotsize) exhibit a much more ductile and heavily stretchedfracture surface through the whole cross-section. Samplesof Trial 4 (median melt temperature and shot size),however, have a transition from ductile to brittle structurefrom the sides to the center.The results of mechanical property testing aretabulated in Table 2, and plotted in Figures 11, 12, and13. As expected, the finer and denser microcells in thepart usually lead to higher impact strength and lessreduction in tensile strength, unless some defects such ascoalescence and open cell occur in the cell formation. Thestress vs. strain curves of base resin microcellular part,microcellular nanocomposite part, and their solidcounterparts, are displayed in Figure 11. Both the solidbase resin parts and the solid nanocomposite parts are allvery ductile. The tensile modulus of microcellularnanocomposite part is usually higher than that of itscorresponding base resin microcellular part. It should benoted that the ductility of microcellular nanocompositedepends on the processing conditions, as shown in Figure12. From Table 2, it can be seen that the microcellularnanocomposite parts have smaller cell sizes and muchhigher cell densities under the same molding conditionsthan the base resin microcellular parts. This phenomenonwas also observed for the other two kinds ofnanocomposites. Under the similar molding processconditions, the differences in mechanical properties ofdifferent microcellular nanocomposite parts (A, E, C) arepresented in Figure 13.Some XRD results are depicted in Figures 15 and 16,in which p represents the direction parallel to the flowdirection and r represents the direction normal to the flowdirection. In the XRD tests, each sample was scanned inboth directions. Figure 15 shows the difference in thesetwo directions for nanocomposite A. The difference fornanocomposite C is shown in Figure 16. As evidenced inFigures 15 and 16, some clay decks or tactoids still existand orientate in the melt flow direction. Those clay decksor tactoids behave as the normal fillers in terms of flowand orientation. Across the flow direction, the clay ishighly dispersed. The disappearance of the 3.343 nm peakin microcellular nanocomposite part indicates that SCFhelps to further exfoliate and uniformly disperse the clayduring the course of melt processing. The nanoclaydispersion was also confirmed by the TEM micrograph(Figure 9).Dynamic rheological study is of special interests,because the bulk properties of the microcellularnanocomposite depend not only on the bulk properties ofthe matrix, but also on the size and spacing of the cells aswell as the physical and chemical properties of the nano
fillers in the matrix. Some results in studying foams withDMA have been reported [4]. But the issues inmicrocellular nanocomposite are far more complicatedbecause of the additional interfacial phenomenaintroduced with the clay/polymer/cell structure. Thepreliminary results in this study are shown in Figure 14. Itcan be seen that the elastic modulus of the basepolyamide microcellular part and the microcellularnanocomposite part follow the patterns of theircorresponding solid parts, respectively. The elasticmodulus of base resin microcellular part is smaller inmagnitude than that of microcellular nanocomposite part.However, the glass transition temperatures of thesematerials do not change too much. The phase anglecurves for the nanocomposite and the microcellularnanocomposite parts are flatter than those of the solidbase resin parts and microcellular parts.strong influence on cell structures and part properties.Microcellular nanocomposite can exhibit a behavior moreor less ductile depending on the processing conditions.Supercritical fluid in microcellular injection moldingfacilitates the exfoliation of nanoclay in nanocompositeparts.AcknowledgementsThe materials used in the study were generouslydonated by the RTP Company. Part of this research issupported by the National Science Foundation (DMI 0140396). Some experimental assistance from HrishikeshKharbas and Paul Nelson is acknowledged.References[1] Wang, H., Zeng, C. C., Elkovitch, M., Lee, L. J.,Koelling, K. W., Polym. Eng. & Sci., 41, 11, 2036-2046(2001).[2] Svoboda, P., Zeng, C., Wang, H., Yang, Y., Li, H.,Lee, L. J., and Tomasko, D., 2002 NSF DMII Granteeand Research Conference, San Juan, Puerto Rico, January7-10 (2002).[3] Zeng, C., Han, X., Lee, L. J., Koelling, K. W., andTomasko, D.L., ANTEC’2002.[4] C. W. Macosko, NATAS Proceedings, 18, 271, 1989.ConclusionsMicrocellular nanocomposite presents a new researcharea with numerous potential applications. Polyamidenanocomposites have been employed in microcellularinjection molding to achieve small, uniform cell size andhigh cell density. Effects of processing conditions on themechanical properties and microstructure have beenstudied. Both nano-clay and processing conditions haveTable 1 L9 fractional orthogonal experimental design with polyamide nanocomposite C and base polyamide DTrial for C,MeltTrial for D(F)TemperatureSupercritical Content(wt%)14500.2245034504Shot Size (mm)InjectionSpeedS/N Ratio for(%)Trial 20.54036.584900.416.5603594900.618.42036.07Table 2 Morphological and mechanical properties of polyamide microcellular nanocomposite parts C vs. polyamidemicrocellular parts DWeightCell size (microns)Cell densities (No. rial for C,Trial for Dreduction 41.0253032063900.1040.15663.5855.88CD(MPa)DANTEC 2003 / 693
Figure 1 SEM micrograph of cells along themelt flow direction (Sample C3)Figure 2 SEM micrograph of cells alongthe melt flow direction (Sample D3)Figure 3 SEM micrograph of cells alongthe melt flow direction (Sample C9)Figure 4 SEM micrograph of cells along themelt flow direction (Sample D9)Figure 5 SEM micrograph of cellsperpendicular to the flow direction (D5)Figure 6 SEM micrograph of cellsperpendicular to the flow direction (D9)Figure 7 SEM micrograph of cellsperpendicular to the flow direction (C5)Figure 8 SEM micrograph of deformedcells along the melt flow direction (C5)Figure 9 TEM micrograph ofmicrocellular nanocomposite (Sample A8)(a)(b)(c)Figure 10 Fractographs of microcellular nanocomposites (a: Sample C1, b: Sample C4, c: Sample C7)694 / ANTEC 2003
Figure 11 Tensile testing of microcellular nanocomposite CFigure 12 Tensile testing of microcellular nanocomposite CFigure 13 Comparison of mechanical properties for microcellularnanocomposites (A, C, E)Figure 14 DMA of microcellular nanocomposites (C0, C8, D0,D8)Figure 15 XRD of microcellular nanocomposites (C0, A2, A8)Figure 16 XRD of microcellular nanocomposites (C0, C3)ANTEC 2003 / 695
(polyamide-clay nanocomposite A, C, E) were injection molded using a 150-ton injection-molding machine equipped with microcellular injection molding capability (MuCell process). The experiments were first executed based on the L16 orthogonal array fractional factorial