Transcription
Southeastern Pennsylvania Transportation AuthorityFISCAL YEAR 2021OPERATING BUDGETFiscal Year 2022-2026 Financial ProjectionsEssential ServiceProvider to the Region
Government Finance Officers Association of the United States and Canada (GFOA) presented a Distinguished BudgetPresentation Award to Southeastern Pennsylvania Transportation Authority, Pennsylvania, for its Annual Budget forthe fiscal year beginning July 1, 2019. In order to receive this award, a governmental unit must publish a budgetdocument that meets program criteria as a policy document, as a financial plan, as an operations guide, and as acommunications device.This award is valid for a period of one year only. We believe our current budget continues to conform to programrequirements, and we are submitting it to GFOA to determine its eligibility for another award.iReturn toTable of Contents
Southeastern Pennsylvania Transportation AuthorityBoard MembersChairmanPasquale T. Deon, Sr.Vice-ChairmanHonorable Kenneth Lawrence, Jr.Bucks CountyPasquale T. Deon, Sr.Charles H. MartinChester CountyJoseph E. Brion, EsquireKevin L. Johnson, P.E.Montgomery CountyRobert D. Fox, EsquireHonorable Kenneth Lawrence, Jr.Delaware CountyThomas E. BabcockMark H. DamblyCity of PhiladelphiaMichael A. Carroll, P.E.Deborah MahlerGovernor’s AppointeeObra S. Kernodle, IVSenate MajorityLeader AppointeeHonorable Stewart J. Greenleaf, EsquireSenate MinorityLeader AppointeeWilliam J. Leonard, EsquireHouse MajorityLeader AppointeeHonorable Marcy ToepelHouse MinorityLeader AppointeeJohn I. KaneSEPTA OfficersGeneral ManagerLeslie S. RichardsDeputy General Manager TreasurerRichard G. BurnfieldGeneral CounselGino J. Benedetti, EsquireController to the BoardStephen A. Jobs, CPASecretary to the BoardCarol R. LoobyiiReturn toTable of Contents
Return toTable of Contents
Given the uncertainties surrounding the health and economic recoveryrate of the region, and taking into consideration the delayedimplementation of the fare increase, it is clear that actual ridership andoperating revenue ultimately realized in Fiscal Year 2021 will differ fromthe adopted baseline budget. The remaining 552 million in CARES Actoperating subsidies that SEPTA is eligible to receive, carefulmanagement of operating expenses, and aligning service to moreclosely match ridership requirements, should enable the Authority tomitigate operating revenue shortfalls that will occur during Fiscal Year2021.During the COVID-19 pandemic, SEPTA has proven to be an essentialbusiness partner to the communities the Authority serves by providingnecessary transportation to keep life-sustaining businesses functioning.SEPTA's heroic frontline employees continue to play a crucial role gettingother frontline workers including healthcare providers and other essentialworkers to their places of employment in a manner that prioritizes safetyand cleanliness above all else.Going forward, the safety of our customers and employees will continueto be a top priority as we recover from the COVID-19 pandemic. SEPTAmanagement has been working closely with all employees, unionrepresentatives and public health officials to implement routine testingand proactive measures to keep our customers and employees safe,including increased sanitization and deep cleaning measures ofequipment system-wide. Some of our ongoing efforts include sanitizingevery vehicle at least twice each day, sanitizing high touch surfaces onequipment, and working around the clock disinfecting and cleaning allopen stations. SEPTA has also prioritized personal safety while riding ourvehicles. We require facial coverings for all employees and customerswhen on SEPTA property, imposed passenger capacity limits on buses,trolleys and the Norristown High Speed Line, and installed socialdistancing decals on vehicle seating to indicate appropriate spacing.The Authority has also partnered with the Black Doctors COVID-19Consortium to provide testing for employees in communities that weserve. All of our decisions are guided by information from thePennsylvania Department of Health and CDC to help ensure a safeand healthy environment. SEPT A is closely monitoring the courseof the crisis and updating procedures and protocols accordingly.SEPTA's commitment to rebuilding the system was strengthened due totransportation funding received through passage of state legislationunder Act 89. Over the next two years, the Authority will take delivery of71 new paratransit vehicles, 45 multi-level regional railcars, and 140hybrid-electric buses. The new buses will increase the size of the energyefficient hybrid bus fleet to approximately 90% of SEPTA's overall buslVReturn toTable of Contents
Return toTable of Contents
SEPTA FY 2021 Operating BudgetTable of ContentsPREFACEGFOA Award . iSEPTA Board Members and Officers. iiGeneral Manager’s Memorandum . iiiTable of Contents . vi1. INTRODUCTION AND PROFILESEPTA History. 1SEPTA Service Profile at a Glance . 2SEPTA Rail & Transit Maps . 3Passenger Profile . 5Customer Satisfaction Ratings/Key Regional Transportation Trends . 7Strategic Business Plan . 9Key Performance Indicators. 102. THE BUDGET PROCESSBudget Development . 17Fiscal Year 2021 Calendar . 18Key Activities in the Budget Process. 193. FISCAL YEAR 2021 ASSUMPTIONS & CONSOLIDATED BUDGETAssumptions . 20Fiscal Year 2021 Consolidated Budget . 224. FINANCIAL & BUDGETARY POLICIESFinancial Planning Policies . 23Revenue Policies . 24Expenditure Policies . 25Description of Existing Debt and Debt Service Policies . 25Statement of Changes in Equity. 325. ORGANIZATIONAL STRUCTUREOperating Divisions. 33Operating and Staff Departments . 34Corporate Team Organization Chart . 36vi
SEPTA FY 2021 Operating BudgetTable of Contents6. THREE YEAR COMPARISON FISCAL YEARS 2019 - 2021Consolidated . 37City Transit Division . 38Victory Division . 39Frontier Division . 40Regional Rail Division . 417. FINANCIAL PROJECTIONSSummary of Assumptions . 42Financial Projections of Consolidated Budget . 438. OPERATING REVENUE AND SERVICE PLAN OVERVIEWAnnual Service Plan Overview . 44Revenue Assumptions by Category . 45Ten Year Revenue Trends. 46Summary of Operating Revenue. 479. OPERATING SUBSIDIESSubsidy Allocation and Detail . 48Service Stabilization Fund . 51Detail of Subsidies . 52Summary of Operating Subsidies . 53Detail of Local Subsidies and Other by County . 54Summary of Local Subsidies by County. 5510. OPERATING EXPENSESExpense Assumptions by Category . 56Ten Year Expense Trends . 58Summary of Operating Expenses . 60FY 2021 Budget – Detail of Expenses . 61FY 2021 Budget – Allocation By Company . 62FY 2020 Actual – Detail of Expenses . 63FY 2019 Actual – Detail of Expenses . 64viiReturn toTable of Contents
SEPTA FY 2021 Operating BudgetTable of Contents11. HEADCOUNT AUTHORIZATIONSHeadcount Designations . 65Fiscal Year 2021 Headcount Authorizations . 66Fiscal Years 2017-2021 Headcount Authorization . 69Headcount Authorization Cause of Change . 7212. DEPARTMENTAL SUMMARIES BY DIVISIONCorporate Staff. . 77Transit Police. . 86System Safety . 90Operations . 96Engineering, Maintenance and Construction . 111Deputy General Manager/Treasurer’s Staff . 122Deputy General Manager/Operations, EM&C and Vehicles . 131Finance . 138Planning and Strategic Initiatives . 148Employee Development and Relations . 156Human Resources . 164Procurement, Supply Chain and Disadvantaged Business Enterprise . 170Audit and Investigative Services . 178Customer Experience and Advocacy . 184Office of General Counsel. 191Public and Government Affairs . 19813. SUMMARY OF INTERDEPARTMENTAL EXPENSESFringe Benefits . 206Non-Departmental Expenses . 208CCT Connect ADA, Shared Ride Program and Other Expenses . 20914. SUMMARY OF CAPITAL IMPROVEMENT PROGRAMCapital Improvement Program . 211Fiscal Year 2021 Capital Budget (Source and Use of Funds) . 212Fiscal Year 2021-2024 Capital Program . 213Fiscal Year 2021 Capital Budget and FY 2021-2032 Capital Program . 214Capital Projects Impact Analysis on Operating Budget FY 2021-2026-SEPTA . 215Capital Projects Impact Analysis on Operating Budget FY 2021-2026-Outside. 218GLOSSARYAcronyms . 220Terms . 224viiiReturn toTable of Contents
1. Introduction and ProfileSEPTA’s HistoryGreater Philadelphia has evolved into a vibrant center of economic growth in the country andthe Southeastern Pennsylvania Transportation Authority’s (SEPTA) multi-modal transit systemhas been a catalyst for this development: providing service to three states and giving riders inthe region easy access to work, school, healthcare appointments, recreational outings, andmajor shopping destinations. The policy makers’ commitment to investing in transportation atthe federal, state, and local level has enriched the lives of residents, visitors, and tourists.SEPTA was created by the Pennsylvania GeneralAssembly in 1964 as a solution to the need for aregional approach to transit, which would provideneeded transportation for passengers, sharedservices to reduce expenses and greater access tofinancial markets tohelp maintain andexpand the system.On September 30,1968, after five yearsofnegotiations,SEPTA acquired thePhiladelphia Transportation Company. The PhiladelphiaTransportation Company was created January 1, 1940 and was responsible for the operation ofbuses, trolleys, trackless trolleys, and subway elevated lines: the Market-Frankford line and theBroad Street line in the Philadelphia area.In 1983, SEPTA was required to take over all operations of Conrail’s passenger railroad to beintegrated with the Authority’s existing transit services. Conrail, which was federally funded, hadoriginally assumed responsibility for the passenger services of the Pennsylvania Railroad andthe Reading Company in 1976. Both railroads went bankrupt due to the decline in the demandfor the transportation of coal, the introduction of superhighways, and the advance of air travel.After a difficult transition and a 108 day strike by Conrail railroad workers, SEPTA’s RegionalRail Division was established. Between Fiscal Years 2012-2016, Regional Rail had outpacedtransit in annual ridership growth and is a critical component in Southeastern Pennsylvania’seconomic engine.INTEGRATING SOUTHEASTERN PENNSYLVANIA’S TRANSIT NETWORK1964Created byPA rtLineReturn toTable of Contents1 S E P T A F Y 2 0 2 1 O p e r a t i n g B u d g e tReturn toTable of Contents
1. Introduction and ProfileToday, 56 years after its creation by the PennsylvaniaGeneral Assembly, SEPTA is the nation’s sixth largesttransit system, with a vast network of fixed routeservices including bus, subway, light rail, trolleybus,and Regional Rail, as well as ADA Paratransit andShared Ride programs. This network provides servicein Bucks, Chester, Delaware, Montgomery, andPhiladelphia Counties with connections into NewJersey and Delaware. SEPTA is also one of theregion’s largest employers, with a workforce ofapproximately 9,500 employees.SEPTA SERVICE PROFILE AT A GLANCEFIXEDROUTESREVENUEVEHICLESSTATIONS& RD LINE12182839.9BROAD STREET LINE11252526.8REGIONAL RAIL1339615526.3LIGHT RAIL815967018.0NORRISTOWN HIGH SPEEDLINE126222.5N/A459N/A1.1BUS & TROLLEYBUSADA PARATRANSIT/SHAREDRIDE(in millions)*Exact number varies as new buses are acquired and old vehicles are retired.2 S E P T A F Y 2 0 2 1 O p e r a t i n g B u d g e tReturn toTable of Contents
1. Introduction and Profile3 S E P T A F Y 2 0 2 1 O p e r a t i n g B u d g e tReturn toTable of Contents
1. Introduction and Profile4 S E P T A F Y 2 0 2 1 O p e r a t i n g B u d g e tReturn toTable of Contents
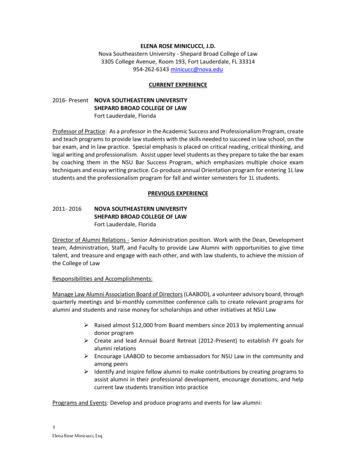
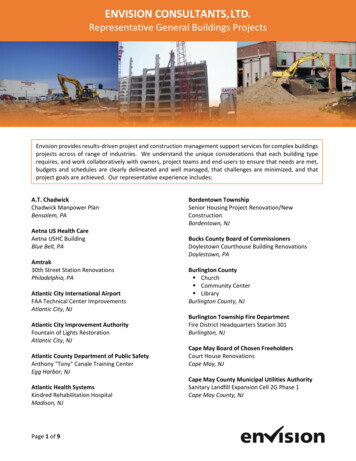
1. Introduction and ProfileSEPTA PassengersThe following charts serve to illustrate the demographic distribution of SEPTA ridership. Thisdata was recorded and compiled as part of the SEPTA 2018 Customer Satisfaction Survey.Due to COVID-19, the planned 2020 Customer Satisfaction survey has been postponed.Age ofAdult Passengers56 to 6515%66 to 755%76 or older1%46 to 5518%18 to 2514%26 to 3527%36 to 4520%Annual Household Income ofPassengers 75 k to 100 k8% 50 k to 75 k17% 100 k or more11% 35 k to 50 k16%5 S E P T A F Y 2 0 2 1 O p e r a t i n g B u d g e tUnder 15 k18% 15 k to 25 k15% 25 k to 35 k15%Return toTable of Contents
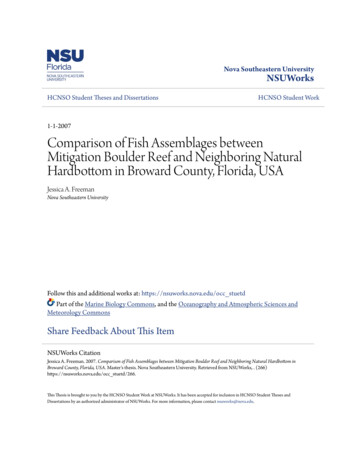
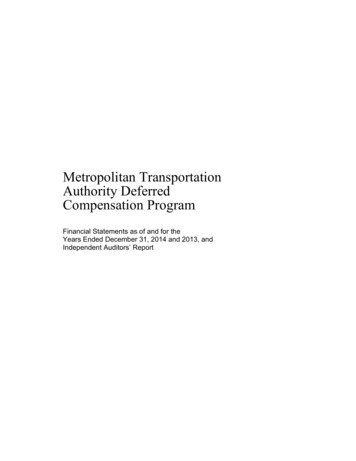
1. Introduction and ProfileEthnicity n Americanor BlackWhiteHispanic or LatinoAsian or PacificIslanderOtherNote: In the above chart, percentages total more than 100% as respondents were able to select multipleresponses to this question to more accurately reflect an individual’s racial and ethnic background.Gender ofPassengersMale39%Female61%6 S E P T A F Y 2 0 2 1 O p e r a t i n g B u d g e tReturn toTable of Contents
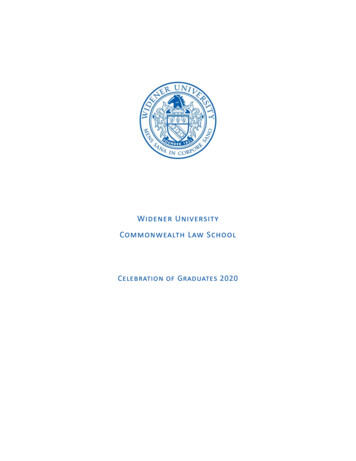
1. Introduction and ProfileCustomer Satisfaction RatingSEPTA conducted a Customer Satisfaction Survey from April 24, 2018 to May 4, 2018, resultingin 1,542 rider and 400 non-rider interviews (1,942 total respondents). Respondents had theoption of taking the survey online or via telephone interview. Riders provided ratings on a scaleof 0 – 10 and could provide observations on up to 3 modes taken within the last seven daysprior to their interview. A total of 2,840 mode observations were collected. In 2018, the averageoverall SEPTA Modal Performance Satisfaction rating was a 7.3.SEPTA Overall7.3Broad Street Line7.3Market-Frankford Line7.1City Bus7.2City Trolley7.2Suburban Trolley7.8Suburban Bus7.87.4Regional Rail0.01.02.03.04.05.06.07.08.09.0Note: In the above chart, “SEPTA Overall” score is weighted by mode ridership in order to berepresentative of overall rider population. Due to changes in methodology in how the survey wasconducted, the results were deemed not comparable to previous years’ results.10.0Key Regional Transportation TrendsTransit RidershipTotal ridership has decreased over the past five years due to a number of factors, such asincreased competition, structural changes in ridership patterns, and moderate gas prices. TheFiscal Year 2020 decrease was primarily due to the Covid-19 impact on the region thatcommenced in mid-March 2020.SEPTA RIDERSHIPUnlinked Passenger Trips400.0350.0300.0250.0200.0150.0100.050.00.0FY 08 FY 09 FY 10 FY 11 FY 12 FY 13 FY 14 FY 15 FY 16 FY 17 FY 18 FY 19 FY 20City Transit269.6 273.9 266.3 277.9 282.2 279.3 271.8 270.7 266.9 252.0 245.8 236.5 1.622.522.217.1Regional Rail .3Total325.2 329.5 321.0 334.0 339.3 337.3 330.2 330.1 326.1 308.3 302.7 292.9 223.5Note: Suburban includes both Victory and Frontier Transit Divisions.7 S E P T A F Y 2 0 2 1 O p e r a t i n g B u d g e tReturn toTable of Contents
1. Introduction and ProfileDriving RatesAutomobile use trends underscore the extent to which transit is increasingly becoming a modeof choice for residents of Southeastern Pennsylvania. As transit ridership increases, drivingrates decrease. Historically, the City of Philadelphia and Southeastern Pennsylvania drivingrates have been roughly one-third and two-thirds the national urban average, respectively. Inrecent years, as national driving rates have rebounded with improving economic conditions,local driving rates have remained flat. The most recent miles traveled data available is 2018.Daily Automobile Miles Traveled per Person (1991-2018)3025DAILY .75PHILADELPHIASOUTHEASTERN PASOUTH JERSEYUS URBAN AVERAGE8 S E P T A F Y 2 0 2 1 O p e r a t i n g B u d g e 41993199219910Return toTable of Contents
1. Introduction and ProfileStrategic Business PlanSEPTA’s former Strategic Business Plan was adopted by the Board in July 2014 for FiscalYears 2015 through 2019. The plan positioned SEPTA to evaluate and take advantage of keytrends and to meet the region’s evolving transportation needs. As the transportation industrycontinues to evolve faster than it ever has before, SEPTA is developing a new StrategicBusiness Plan to actively address these challenges and ensure that transit is the backbone ofmobility across the region. The former strategic plan is available at www.septa.org/strategicplan.While we progress the next Strategic Business Plan, in the interim, we will continue to focus ongoals that enhance SEPTA’s value proposition:SEPTA’s VALUE PROPOSITIONLeaders in Southeastern Pennsylvania agree that mass transit:Drives the Economy: The five counties of Southeastern Pennsylvania generate 42% of thestate’s economic output on 5% of its land, a degree of economic productivity and density that isonly possible with high-capacity mass transit.Supports Equity: Using mass transit is more affordable than driving, saving the averagePhiladelphia household close to 1,000 in annual cost of living expenses.Advances Sustainability: Using mass transit reduces carbon emissions from transportation,which at 28% is now the largest single sector source of carbon in the United States; inPhiladelphia, transportation only represents 25% of carbon emissions thanks to a culture of lowand no-carbon travel, including mass transit.Promotes Public Health and Safety: Using mass transit is ten times safer than driving andpromotes healthy lifestyles that meet physician recommendations for daily physical activity.9 S E P T A F Y 2 0 2 1 O p e r a t i n g B u d g e tReturn toTable of Contents
1. Introduction and ProfileBalanced Scorecard of Key Performance IndicatorsSEPTA’s former Strategic Business Plan established a “balanced scorecard” approach toperformance management. The Key Performance Indicators (KPIs) were designed to guidestrategy development based on a quantitative evaluation of progress during planimplementation. The KPIs were carefully selected to represent meaningful measures ofachievement towards strategic objectives across all business units.Progress updates on each KPI are posted quarterly at www.septa.org/strategic-plan.The balanced scorecard has six key focus areas: Safety and Security: develop a safety-first culture Financial Efficiency: responsibly manage resources The Customer Experience: provide best-in-class transportation services Resource Management: implement best management practices State of Good Repair and Reliability: reduce the backlog of capital repair needs Employee Growth: attract, develop, and retain a diverse, healthy, and versatileworkforceSafety and SecurityGoal Statement: to develop a safety-first culture that results in fewer customer and employeeincidents.Employee Lost Time Injuries per 200,000 Work HoursInjuries causing missed work divided by work hours times 200,000FY 2017FY 2018FY 2019FY 2020FY ote: KPI reporting metrics were revised in FY 2019 to report lost time injury data by the railroad andnon-railroad classification.10 S E P T A F Y 2 0 2 1 O p e r a t i n g B u d g e t3.43.320202021 004.003.002.001.000.002013LOST TIME RATEEMPLOYEE LOST-TIME PER 200,000 HOURSReturn toTable of Contents
1. Introduction and ProfileVehicle, Passenger, and Station IncidentsReported vehicle and passenger incidents per 100,000 miles; reported station incidents per 1,000,000passenger tripsFY 2019 ActualFY 2020 ActualFY 2021 GoalVehicle Incidents5.134.484.75Passenger Incidents3.713.383.51Station Incidents0.531.701.10Note: The COVID-19 situation has caused a significant decrease to service and ridership which in turnhas impacted the FY 2020 numbers. In light of this situation, in order to normalize the data, the FY 2021goal is calculated as a 1% reduction of the average of the past two years instead of the usual 2%.Financial EfficiencyGoal Statement: to responsibly manage resources in a manner that provides requisite budgetstability to grow the system.Operating Expenses per Unlinked Passenger TripGoal: Change in SEPTA is Below Change in Philadelphia CPI-U and Industry CPI-UTotal operating expenses divided by total unlinked passenger tripsFY 2018 ActualFY 2019 ActualFY 2020 ActualFY 2021 GoalOperating Expenses 1,371,790 1,411,366 1,403,458 1,530,984(in thousands)Unlinked Passenger Trips302,700292,857223,483*293,293(in thousands)Operating Expenses Per 4.53 4.82 6.28 5.22Unlinked Passenger Trip*FY 2020 Passenger Trips were significantly lower than the prior year due to the impact of Covid-19.OPERATING EXPENSES PER UNLINKED PASSENGER TRIPSEPTA VS. BENCHMARKS 7.00EXPENSE PER TRIP 6.28 6.00 4.93 5.00 5.22 4.00 3.87 3.0011 S E P T A F Y 2 0 2 1 O p e r a t i n g B u d g e tPHILA 021 GoalSEPTA20112010200920082007 2.00Return toTable of Contents
1. Introduction and ProfileUnlinked Passenger Trips per CapitaTotal unlinked passenger trips divided by total five county SEPTA populationFY 2017FY 2018FY 2019FY 2020FY 2021ActualActualActualActualGoalUnlinked Passenger Trips308,300302,700292,857223,483293,293(in thousands)Regional Population4,1194,1284,1344,134*4,134*(in thousands)Unlinked Passenger74.8573.3370.8454.0670.95Trips per Capita*Reflects most recent estimated data available.Note: FY 2020 Passenger Trips were significantly lower than the prior year due to the impact of Covid-19.120100806079.076.880.682.954.1202021 0920082007200620050TREND 71.073.3402004TRIPS PER SE PA RESIDENTUNLINKED PASSENGER TRIPS PER CAPITAOther Measureso New Route Utilization Criteria – As part of the SEPTA FY 2020 Annual ServicePlan, the SEPTA Service Standards and Process was revised to reflect newroute utilization criteria. These criteria reflect a peer review of nearly a dozenlarge transit agencies in North America and metrics from PennDOT’sperformance review. While operating ratio data will still be collected and reportedupon, the evaluation now focuses on passengers per revenue hour (measuringroute productivity) and cost per passenger (measuring route effectiveness). Inaddition, comparative evaluations will be made based on a new routeclassification system, segmented into City, Suburban, Arterial, Expressway,Fixed and Special Purpose. Any route falling in the bottom 15th percentile forboth passengers per revenue hour and cost per passenger will be identified ascandidates for possible evaluation and intervention.A minimum economic performance standard is used for Regional Rail stations. Astation failing to meet this minimum standard will be targeted for evaluation aspart of a future Annual Service Plan. The evaluation will consider the station(s)which have not met the minimum economic performance standard.12 S E P T A F Y 2 0 2 1 O p e r a t i n g B u d g e tReturn toTable of Contents
1. Introduction and ProfileThe evaluation will consider the station’s line, adjacent stations, availableamenities including parking, nearby Regional Rail lines, other local SEPTA transitoptions, physical infrastructure constraints or opportunities for service, drivingand non-driving access to the station and nearby stations, trip-time impacts onthe overall line, planned or recent investments and the costs associated withthose investments. Other Financial and Productivity GoalsooooScheduled Service Requirements – 98% or higher of service operating asscheduled.Accessibility by Elderly and Disabled – Achieve 100% of total requests forADA trips (639,000 ADA City Division and 303,000 ADA Suburban Division trips,pre Covid-19).Vehicle Miles per Employee – 10,490 or more vehicle miles per employee(
MARKET-FRANKFORD LINE . 1 218 28 39.9 . BROAD STREET LINE . 1 125 25 26.8 . REGIONAL RAIL . 13 396 155 26.3 . LIGHT RAIL . 8 159 670 18.0 . NORRISTOWN HIGH SPEED LINE . 1 26 22 2.5 . ADA PARATRANSIT/SHARED RIDE . N/A 459 N/A 1.1 *Exact number varies as new buses are acquired and old vehicles are retired. Return to Table of Contents