Transcription
The Modern Endowment Story:A Ubiquitous US Equity FactorRichard M. Ennisrichardmennis@gmail.comComments welcome.AbstractThe endowment model, presumed to be a paradigm of value-adding asset class diversification, isa thing of the past. Large educational endowment funds in the United States have heavilyconcentrated their investments—public and private—in ones that are moderately to highlycorrelated with the Russell 3000 Index.1
Ennis (2021a) evaluated the performance of educational endowment funds in the United Statesthrough June 30, 2020. The principal focus of that article was the performance of largeendowments.1 Ennis (2021b) critically examined the efficacy of the so-called endowment model.This paper explores asset allocation trends since the Global Financial Crisis of 2008 (GFC) andduring more recent years, which I refer to as the Modern Era. It updates the evaluation ofendowment performance through June 30, 2021. It examines the cost of investing and its likelyimpact on performance. Finally, it identifies important strategic issues for endowment managersto consider.PRIOR WORKEnnis (2021a) evaluated the performance of educational endowments in the United Statesover the 47 years from 1974 to 2020. It identified three distinct eras of excess return of theNACUBO composite of large endowments relative to passive investment.2 Exhibit 1 summarizesthe results. In the first era, endowments invested nearly exclusively in stocks and bonds, withstocks being primarily those of US companies. The second era was the Golden Age ofAlternative Investments, when private equity, venture capital, real estate, and hedge fundsproduced extraordinary returns. The Golden Age ended with the GFC, when a third era emerged.Exhibit 1Three Eras of Endowment Performance (fiscal years [FYs] 1974–2020)Years inAnnualizedEraDurationExcess ReturnStock and Bond Era(FYs 1974–1993)20-0.8%Golden Age of AlternativeInvestments (FYs 1994–2008)15 4.1Post-GFC Era(FYs 2009–2020)12-1.6The main emphasis of Ennis (2021a) was on endowments’ performance during the latter(post-GFC) era. Regressing returns of the endowment composite on those of a stock and bondbenchmark of comparable risk for the 12-year post-GFC era yielded an R2 of 0.985 and atracking error of 1.5%.3 A key finding of that research was that stocks and bonds alone explainedthe performance of endowment funds for all intents and purposes; alternative investments did notserve as diversifiers. The alpha (regression intercept) of the composite relative to the stock–bondbenchmark was -1.46%, with a statistically significant t-statistic of –2.7. That study also revealedthat alternative investments had a significantly adverse impact on fund performance relative toportfolios comprising solely marketable securities. A follow-up article (Ennis 2021b), titled “The1These large endowments, represented by the National Association of College and University Business Officers(NACUBO) (equal-weighted) composite, have assets of greater than 1 billion.2Excess return is simply the difference between the composite return and that of a passively investable benchmark.3The benchmark comprised 58% of the Russell 3000 Index, 16% of the Morgan Stanley Capital International AllCountry World Index (MSCI ACWI) ex USA Index, and 28% of the Bloomberg US Aggregate Bond Index.2
Failure of the Endowment Model,” determined that the model itself had become dysfunctional,ceasing to provide hoped-for diversification benefits and significantly underperforming passiveinvestment since the GFC.This paper identifies a ubiquitous equity factor in the returns of the principal asset classesused by large endowments. It updates performance evaluation results through June 30, 2021. Thepaper explores recent trends in asset allocation that have unfolded during what I refer to as theModern Era—the most recent 5–7 years. Finally, the paper highlights important strategic issuesfor the consideration of endowment trustees and managers.THE UBIQUITOUS EQUITY FACTOREndowment managers pride themselves on the extensive diversification of theirportfolios, investing in a number of alternative investment types. In my prior work (Ennis, 2020,2021a and 2021b), however, I was unable to find evidence that alternative investments contributemeaningfully to portfolio diversification. Here I take a different tack: I seek to determine whatfactor or factors have, if fact, animated the returns of endowment portfolios. The answer to thisquestion was not difficult to apprehend. Exhibit 2 shows the relationship of the US equity factorwith the returns of the principal asset classes used by endowments.4 With the exception ofinvestment-grade bonds, all the asset classes exhibit meaningfully positive correlation with theRussell 3000 stock index, my proxy for the US equity factor; most of them exhibit a very highdegree of correlation with it. That correlation manifests itself in asset class betas ranging from0.25 to 1.16 relative to the US equity factor; the betas, in turn, are drivers of return. The overalleffect is evident in the statistics for the NACUBO composite itself: It has exhibited a beta ofnearly 0.8 with the US stock market over the 13-year period by virtue of its near perfectcorrelation with it. And thus, the US equity factor reveals itself as the prime driver of endowmentreturns.Exhibit 2Correlation and Beta Relative to Russell 3000 Index (13 years ending June 30, 2021)Asset ClassAggregate BondsHigh-YieldNon-U.S. EquitiesNon-US Equities (hedged)Real EstateVenture CapitalPrivate EquityHedge FundsNACUBO CompositeCorrelationCoefficient withRussell 3000 Stocks-0.470.560.960.940.850.800.960.960.98Beta Relative toRussell 3000 Stocks-0.100.251.070.790.831.161.000.450.794The asset classes are based on the Bloomberg US Aggregate Bond Index, Vanguard High-Yield Corporate Fund(bonds); Cambridge Associates Real Estate Index; HFRI Fund of Funds Composite Index; MSCI ACWI ex USAIndex (unhedged and hedged); Cambridge Associates Private Equity Index; and Cambridge Associates VentureCapital Index.3
Fixed income provides an interesting case study of the ubiquitous nature of the US equityfactor. The Aggregate (investment-grade) bond index appears in Exhibit 2 with a negative betarelative to stocks, reflecting the negative correlation of the two. It is an indication that highquality bonds were a good diversifier vis-à-vis US equities in this period. The size and characterof institutional fixed-income portfolios have evolved considerably in recent decades. In daysgone by, fixed-income portfolios made up 30% or more of institutional portfolio assets and werereliably investment grade in terms of their creditworthiness. But large endowments’ fixedincome allocations have steadily declined. NACUBO reports an average allocation (includingcash of 4%) of just 11% in 2020. At the same time, as keen observers of institutional investingknow, there has been a trend to introduce meaningful amounts of credit (default) risk into thefixed-income portfolio. In view of the resulting downgrading of fixed income, I included highyield bonds, with an equity beta of 0.25, in Exhibit 2 to highlight that the equity factor evenbleeds into the fixed income portfolio.The theme of a ubiquitous equity factor runs through the balance of this paper.PERFORMANCEReturns of the NACUBO (equal-weighted) composite of large endowments are thesubject of analysis that follows. Returns are for the endowments’ annual fiscal years, ending June30 of each year. The composite comprises more than 100 endowments with assets of greater than 1 billion, which have an average of more than 100 managers each.5 I begin by determining theeffective asset allocation of the NACUBO large fund composite for the 13 years ending June 30,2021. To do this, I use the returns-based, constrained multiple regression analysis à la Sharpe(1988, 1992), often referred to as returns-based style analysis (RBSA).6 RBSA seeks to identify abenchmark that yields a fair economic return for a portfolio, or a composite of them, as in thepresent case. It identifies the effective exposure of a return series to various market indexes for aparticular time period by minimizing regression residuals. In this respect, RBSA identifies thecombination of market indexes that has the best statistical fit with the subject series. Thisbecomes the performance measurement benchmark.The asset class indexes I make available as independent variables in RBSA are:!!!!!!!US investment-grade bonds—Bloomberg US Aggregate Bond IndexUS common stocks—Russell 3000 Stock IndexUnhedged non-US stocks— MSCI ACWI ex USA IndexHedged non-US stocks— MSCI ACWI ex USA Index (hedged)Private market real estate—Cambridge Associates Real Estate IndexVenture capital—Cambridge Associates Venture Capital IndexPrivate equity—Cambridge Associates Private Equity Index5The NACUBO return figure for fiscal year 2021 was not available at the time of this writing. I use as a proxy for itthe average of 60 endowments with assets of greater than 1 billion that had reported publicly at the time of writing.6Sometimes this methodology is referred to as quadratic programming.4
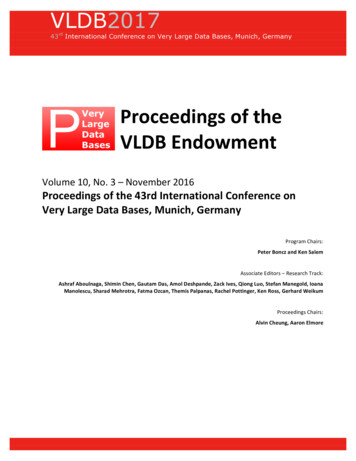
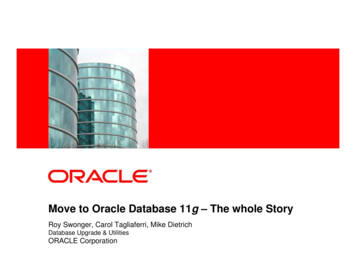
!Hedge funds— HFRI Fund of Funds Composite IndexExhibit 3 summarizes the RBSA results. The regression does not load on the real estateand hedge fund indexes, meaning the procedure is able to compile the best-fitting benchmarkwithout them. All the other asset classes play a role in defining the risk-return signature of theendowment composite. Exhibit 3 also summarizes key risk and performance statistics for thecomposite. The benchmark explains essentially all the variance of return of the composite, asindicated by the R2 of 99.9% and negligible annualized tracking error of 0.42%. The intercept ofthe regression, commonly referred to as alpha, is -2.50%. This indicates that the NACUBOcomposite of large endowments has underperformed its best-fitting benchmark by 2.5% a year.Exhibit 4 plots the composite returns relative to those of the benchmark. It illustrates that thebenchmark fits the composite to a T and indicates, by virtue of the intercept, the margin ofunderperformance.Exhibit 3Benchmark Weights and Performance Statistics for Large Endowment Composite (13years ending June 30, 2021)Asset ClassAggregate BondsUS EquitiesNon-US EquitiesNon-US Equities (hedged)Real EstateVenture CapitalPrivate EquityHedge FundsKey StatisticsBetaR2Tracking ErrorIntercept 21711043901.099.9%0.42%-2.50%-16.45
Exhibit 4Regression of Composite Returns on those of Bencmark (13 years ending June 30, 2021)50.0%y 1.0004x - 0.025R² 0.99915Large Endowments 0.0% -20.0% -10.0%0.0%10.0% 20.0% 30.0% 40.0% 50.0%Benchmark ReturnExhibit 5 reports on RBSA results using a more parsimonious model. Here the onlyindependent variables are broad indexes for US and non-US stocks and investment-grade USbonds. Although the statistical fit is not as good as before, the intercepts are similar.Exhibit 5Comparison of Alternative Benchmark Formulations(13 years ending June 30, 2021)Asset ClassAggregate BondsUS EquitiesNon-US EquitiesNon-US Equities (hedged)Real EstateVenture CapitalPrivate EquityHedge FundsKey StatisticsBetaR2Tracking ErrorIntercept 7%2171104390Stocks andBonds 1.096.7%2.61%-2.24%-2.46
COSTI estimate that the typical cost of investing large endowments is approximately 2.6% ofasset value annually. The estimate is based on (1) research into the cost associated with investingin various asset classes (e.g., private equity, hedge funds, private market real estate, private debt,commodities) as well as in public markets,7 and (2) the average asset allocation percentages forlarge endowments published by NACUBO. See Exhibit 6 for a summary of the development ofthe estimate. This is admittedly a rough estimate, limited by the absence of actual cost data forthe endowments and, therefore, reliant on academic and other research of cost by asset class. Thecost estimate of approximately 2.6% of asset value annually is similar to the observed margin ofunderperformance of 2.5% a year. Given the extreme diversification of the composite, whichcomprises more than 100 large endowments with an average of more than 100 investmentmanagers each, and with its near perfect correlation with market indexes, there is every reason tobelieve that cost is the principal reason for endowments’ poor performance.Exhibit 6Endowments’ Estimated Annual Cost as a Percent of Invested Value in 2020AllocationPercentage11%306Cost as aPercent ofInvested Value0.2%80.52.59Asset ClassExtensionFixed Income0.02%Equities0.15Real Estate0.15Venture Capital andPrivate Equity266.0101.60Hedge Funds213.0110.63Other Alternatives61.00.06Total100%—2.61%Source of asset allocation percentages: NACUBO — ablesRISING EQUITY ALLOCATION7Cost estimates include management fees and transaction costs for marketable securities. Where applicable, theyinclude management fees, carry, and other costs deducted from distributions to limited partners. The cost estimatedoes not include the cost of operating the endowment investment office, which I estimate to be in the range of 25bps–75 bps. Nor are the latter costs netted out of the returns reported by NACUBO, meaning they are lost in theshuffle, so to speak.8Callan (2019) is the source for fixed income and equities. The estimate for fixed income reflects the fact theendowments’ investments there are a combination of cash (at no cost) plus investment-grade and high-yield-typeinvestments, the latter of which can cost up to 3% of asset value annually.9Bollinger and Pagliari (2019). The figure indicated is a blend of rates for core equity, value-add and opportunisticinvestments.10Phalippou and Gottschalg (2009).11Ben-David et al. (2020), French (2008), Ibbotson et al. (2010). The 3% figure is somewhat lower than the averagereported in the studies.7
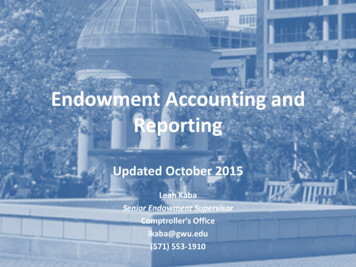
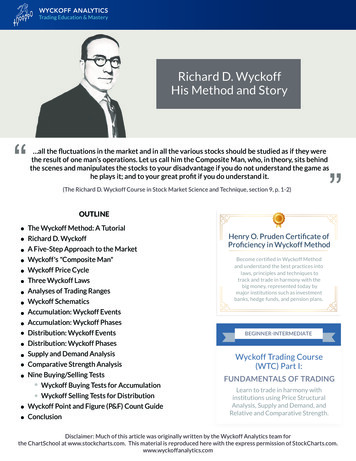
I find indications that large endowments’ effective equity exposure has risen in recentyears, with increasing concentration in the US market. I estimate the effective equity exposure ofthe composite at 84% when applying RBSA to the composite for the full 13 year period.12 SeeExhibit 7. I shorten the time period by dropping the most distant year, repetitively. I refer to themost recent 5–7 years in Exhibit 7 (shaded section of the table) as the Modern Era. Inwinnowing the return history to the Modern Era, the effective equity exposure increases to 97%,entirely in the US market. (I believe the 3% allocation to bonds captures the presence offrictional cash that is attendant management of complex portfolios of assets with limitedliquidity.13) The endowments, collectively, appear to have become decidedly more aggressive interms of their equity exposure during the Modern Era, with predominant exposure to US equities.Exhibit 7Effective Asset Allocation over Various Time Periods Ending June 30, 2021MostRecentn 22.10.90.80.9Exhibit 8 provides the same insight more simply, i.e., without using RBSA to establishasset allocation weights. The first two columns present the standard deviation of return for thecomposite and for the Russell 3000 over the receding time periods shown in Exhibit 7. The nextcolumn shows the ratio of the former to the latter, or the risk ratio of the composite for theperiod. This is followed by the correlation coefficient for the two series. The last column is thebeta. (Beta is the product of risk ratio and correlation.) Owing to the near perfect correlation ofthe two series over all time periods, the risk ratio and beta rise in lockstep as the latter years areweighted more heavily. Over the longest time period, both figures are approximately 0.8; theyincrease to near unity (0.97) in the Modern Era. Exhibit 9 shows the same results graphically.Based on this, we can reasonable conclude that large endowments, collectively, have positionedthemselves as equity investors, plain and simple.1213This analysis uses only the stock and bond indexes.Cash runs consistently at 4% of total assets in the NACUBO asset allocation data over the study period.8
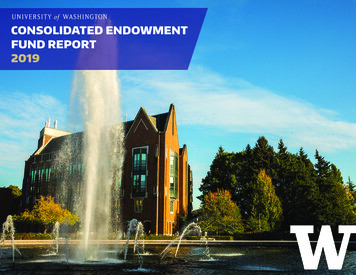
Exhibit 8Increasing Endowment RiskStandardDeviation 14.6MostRecentn %12.613.212.812.813.614.015.015.1Risk aRelative toRussell 30000.790.850.860.910.920.930.970.970.97Exhibit 9Increasing Endowment Risk1.000.95Correlation0.90Beta0.85Risk Ratio0.800.750.701312111098Most Recent n Years765Exhibit 10 shows the results of regressing composite returns on those of a benchmarkcomprising 97% US equity and 3% investment-grade bonds for the six years ending June 30,2021. The composite has a beta relative to the benchmark of 1.0 and an R2 of 0.998 (trackingerror of 0.8%). Exhibit 10 also indicates an intercept (alpha) of -4.2%. In other words, thecomposite has fluctuated just like a total US stock market index fund (with 3% frictional cash) in9
terms of its fluctuations during the Modern Era, but has underperformed such a portfolio by4.2% a year.Exhibit 10Regression of Composite Returns on Those of the 97%–3% Benchmark (six years endingJune 30, 2021)OVERALL POLICY AND STRATEGY ISSUESRisk ToleranceIf the average equity exposure of large endowments is equal to that of the stock marketwith frictional cash, we can safely conclude that roughly half of the endowments are even moreaggressively positioned equity-wise. Contrasting this result to endowments having typically 30%or more of their assets in investment-grade bonds in the not-so-distant past gives rise to thequestion of risk tolerance. Has the risk tolerance of endowed institutions increased significantlyover the past decade or two? Or, in light of an extraordinarily strong US equity market of late, isit an expression of recency bias on the part of endowment managers? Or have those managersbeen conditioned to believe bear markets do not last long, and that they, and the institutions theywork for, can hold their breath, so to speak, until asset values recover from a bear market? Thiswould be a good time for them to review the history of bear markets dating back at least to theGreat Crash of 1929 and to reexamine their institution’s risk tolerance.10
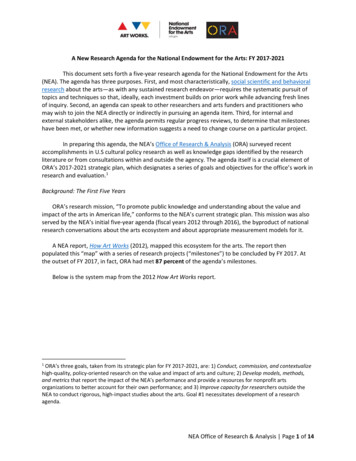
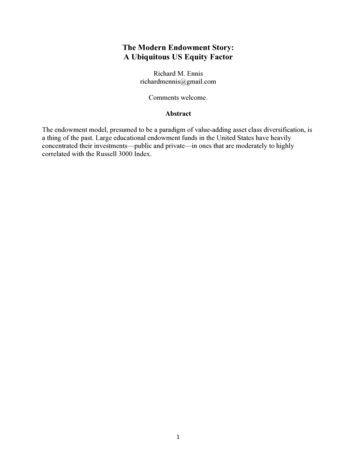
Home BiasHome bias, the expressed preference of investors to own the stocks of companiesdomiciled in their country, is pervasive among institutions as well as individuals around theworld. US equities currently account for approximately 60% of the value of the MSCI ACWI.The all-time high percentage for the United States was 70% in 1969. From there it declined to30% in 1989 with the burgeoning Japanese market. (See Exhibit 11.) As for home bias, USmutual fund investors have 79% of the value of their common stock investments in the USmarket, according to Vanguard. Large endowments are essentially 100% exposed to the USequity market. I wonder if they are even aware of the extent of their reliance on the home market.Exhibit 11Share of Global Equity Market Value for Select Countries and Regions (1969–2019)Source: Cambridge Associates its-of-globaldiversification/).The funds’ bias toward the home market takes on added importance in light of theextraordinary valuation level of the US equity market. As of September 30, 2021, RobertShiller’s cyclically adjusted price-to-earnings (CAPE) ratio for the United States wasapproximately 37, compared with about 24 for Europe and Japan. At 37, the US CAPE ratio is2.2 times its long-term average of about 17. (It reached a low of about 13 during the GFC.) Andat a CAPE ratio of 37, investors buying US equities are paying 54% more for their earnings thanare investors in other principal markets. The endowments are betting heavily on the home marketand paying up to do it. The Japanese experience offers a sober reminder that country marketdiversification matters. Japan’s share of global market value rose from less than 5% to about40% over the course of two decades, only to fall back to about 6% currently.SUMMARY AND RECOMMENDATIONS11
The endowment model is a thing of the past. Large endowments have been piling intoinvestments that provide sure access to the US equity factor to the virtual exclusion of everythingelse. Each fund has fashioned its own complex portfolio in its own unique way. But thecollective effect is as clear as it is simple: For all intents and purposes, the endowments own theUS stock market. They are not, however, getting a competitive return. They have experienced anannual opportunity cost of 2.5% a year since the GFC, which matches their estimated cost ofinvesting of 2.6% a year. This casts doubt on the ability of investment managers to beat themarket before fees, even when they are free to roam from the beaten path.Here are my recommendations:!Over and over again in my work, the overarching theme for diversified investors is thatcost is pretty much all that matters. It is axiomatic: The more you pay, the worse you do.These endowments should bring their cost of investing down, way down.!Endowment managers and trustees should ask whether they have allowed themselves tobecome caught up in a horse race to the detriment of their institutions. As stewards ofinstitutional wealth, are they really comfortable with an equity factor exposure of 100%or more, most of which is represented by illiquid or semi-liquid assets?14 What, in termsof the prospective cash flows of their institutions, has enabled the expression of risktolerance that we observe, which is markedly more aggressive than it was a generationago? It is time to revisit the fundamentals of risk tolerance. Endowment managers that doso may discover a greater role for investment-grade bonds in the portfolio.!Even if institutional stewards are comfortable being all-in equity investors, are theycomfortable with such a heavy bet on a single stock market when there are dozens inwhich they could participate? Are they even aware of the extent of their home equitymarket and US dollar bias? We all know that the US stock market has clobbered those ofthe rest of the world since the GFC. The same was true of the Japanese stock market inthe years leading up to its collapse. As things stand, the endowments have all their eggsin one basket with a tag that says “Made in America.” Prudence dictates diversifyingglobally.Ever since the estimable David Swensen began blazing a trail for endowment managersin the late 1980s, their emphasis has been on being savvy investors in largely illiquid sectors.Textbook investing has seemed much less important. My results suggest it may be time to dustoff the textbooks.REFERENCESBen-David, I., J. Birru and A. Rossi. 2020. “The Performance of Hedge Fund PerformanceFees.” SSRN: https://ssrn.com/abstract 3630723 orhttp://dx.doi.org/10.2139/ssrn.3630723.14NACUBO reports that large endowments have a 60% allocation to alternative investments.12
Ennis, R. M. 2020. “Institutional Investment Strategy and Manager Choice: A Critique.” TheJournal of Portfolio Management (Fund Manager Selection Issue): 104–117.——. 2021a. “Endowment Performance.” The Journal of Investing 30 (3): 6–20.—— . 2021b. “Failure of the Endowment Model.” The Journal of Portfolio Management 47 (5):128–143.French, K. R. 2008. “The Cost of Active Investing.”https://ssrn.com/abstract 1105775 or http://dx.doi.org/10.2139/ssrn.1105775.Ibbotson, R. G., P. Chen, and K. X. Zhu. 2010. “The ABCs of Hedge Funds: Alphas, Betas, andCosts.” Financial Analysts Journal 67 (1).Phalippou, L., and O. Gottschalg. 2009. “The Performance of Private Equity Funds.” The Reviewof Financial Studies 22 (4): 1747–1776.Sharpe, W. F. 1988. “Determining a Fund’s Effective Asset Mix.” Investment ManagementReview 2 (6): 16–29.——. 1992. “Asset Allocation: Management Style and Performance Measurement.” The Journalof Portfolio Management 18 (2): 7–19.13
Benchmark Weights and Performance Statistics for Large Endowment Composite (13 years ending June 30, 2021) Asset Class Effective Percentage Allocation Aggregate Bonds 17% US Equities 21 Non-US Equities 7 Non-US Equities (hedged) 11 Real Estate 0 Venture Capital 4 Private Equity 39 Hedge