Transcription
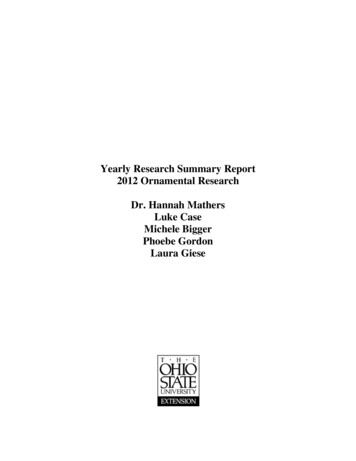
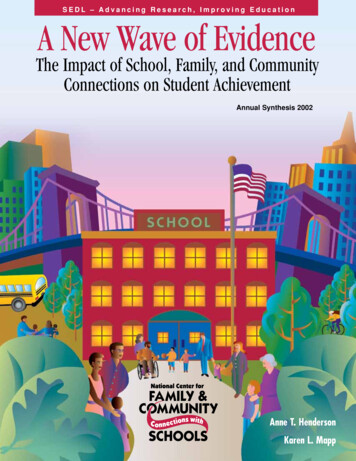
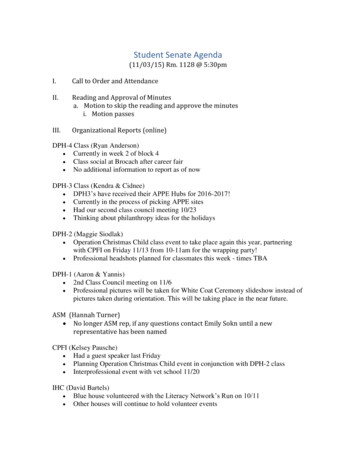
A New Research Agenda for the National Endowment for the Arts: FY 2017‐2021This document sets forth a five‐year research agenda for the National Endowment for the Arts(NEA). The agenda has three purposes. First, and most characteristically, social scientific and behavioralresearch about the arts—as with any sustained research endeavor—requires the systematic pursuit oftopics and techniques so that, ideally, each investment builds on prior work while advancing fresh linesof inquiry. Second, an agenda can speak to other researchers and arts funders and practitioners whomay wish to join the NEA directly or indirectly in pursuing an agenda item. Third, for internal andexternal stakeholders alike, the agenda permits regular progress reviews, to determine that milestoneshave been met, or whether new information suggests a need to change course on a particular project.In preparing this agenda, the NEA’s Office of Research & Analysis (ORA) surveyed recentaccomplishments in U.S cultural policy research as well as knowledge gaps identified by the researchliterature or from consultations within and outside the agency. The agenda itself is a crucial element ofORA’s 2017‐2021 strategic plan, which designates a series of goals and objectives for the office’s work inresearch and evaluation.1Background: The First Five YearsORA’s research mission, “To promote public knowledge and understanding about the value andimpact of the arts in American life,” conforms to the NEA’s current strategic plan. This mission was alsoserved by the NEA’s initial five‐year agenda (fiscal years 2012 through 2016), the byproduct of nationalresearch conversations about the arts ecosystem and about appropriate measurement models for it.A NEA report, How Art Works (2012), mapped this ecosystem for the arts. The report thenpopulated this “map” with a series of research projects (“milestones”) to be concluded by FY 2017. Atthe outset of FY 2017, in fact, ORA had met 87 percent of the agenda’s milestones.Below is the system map from the 2012 How Art Works report.1ORA’s three goals, taken from its strategic plan for FY 2017‐2021, are: 1) Conduct, commission, and contextualizehigh‐quality, policy‐oriented research on the value and impact of arts and culture; 2) Develop models, methods,and metrics that report the impact of the NEA’s performance and provide a resources for nonprofit artsorganizations to better account for their own performance; and 3) Improve capacity for researchers outside theNEA to conduct rigorous, high‐impact studies about the arts. Goal #1 necessitates development of a researchagenda.NEA Office of Research & Analysis Page 1 of 14
Progress on the How Art Works research agenda led to five distinct areas of accomplishment for theNEA and ORA. They included:1. Collecting and reporting more robust data about U.S. arts participation patterns.Examples: In partnership with the U.S. Census Bureau, designed and/or expanded multiple surveys aboutarts participation; analyzed and reported trend data at the national and state levels; and posted resultsand data tools for other researchers, cultural policy‐makers, arts practitioners, and the general public.2. Bringing more rigor and regularity to economic valuations of the arts.Examples: In partnership with the U.S. Bureau of Economic Analysis, created the Arts and CulturalProduction Satellite Account and began work to regionalize it. Research findings from the account havebeen reported widely in the mainstream and trade media, and they have initiated policy discussions,across the U.S. and abroad, about measuring the economic value of the creative sector.3. Expanding support for researchers to investigate the value and impact of the arts, thus helpingthe NEA to fulfill a core part of its mission.Examples: Launched a grants program supporting investigator‐initiated research projects; posted researchfindings from these grants to the NEA website; increased support for quasi‐experimental andexperimental study designs; and issued the first in a series of solicitations to create “NEA Research Labs,”transdisciplinary teams of researchers and arts practitioners.4. Engaging the public with arts data and analytical tools.Examples: Established a freely accessible National Archive of Data on Arts & Culture, which includes notonly 265 arts datasets containing more than 73,000 variables, but also web‐based tools to run analyticson‐demand; created an “Arts Data Profile” series on the NEA website, to enable the public to interact withspecific arts datasets and research findings; produced, tested, and posted to the NEA website a set ofNEA Office of Research & Analysis ‐ 2December 2016
“Arts & Livability Indicators,” using public datasets to benchmark plausible outcomes associated withcreative placemaking activities.5. Building and sustaining federal research partnerships around the arts and humandevelopment.Examples: Convened quarterly meetings of the Interagency Task Force on the Arts and HumanDevelopment, a coalition of representatives from 19 federal entities, to catalyze new research andinformation‐sharing about the arts’ role in human development. Co‐sponsored, with the NationalInstitutes of Health, a National Academies research workshop on the arts and aging; produced threenational reports from Task Force activities; and publicized federal research and evidence‐basedprogramming through a series of highly‐attended public webinars, now archived on the NEA website.The How Art Works research agenda covered a lot of ground. Not only did the underlying systemmap sketch a vast, complicated set of domains and relationships deserving of study, but the agendaitself accommodated many different kinds of research project. They included: investigating specifichypotheses about the arts; designing surveys to collect new information on arts variables; andestablishing programs and resources to incentivize researchers to study arts‐related topics.In contrast, the NEA’s new research agenda (FY 2017‐2021) is restricted to studies or analyses thatwill produce findings on a specific topic of interest. Although the NEA continues to pursue several tacticsto build capacity for arts researchers and evaluators—operating the Research: Art Works grantsprogram, for example, and maintaining the National Archive of Data on Arts & Culture—those tacticsappear in ORA’s strategic plan and not in its research agenda.The NEA’s Office of Research & Analysis (ORA) relied on three guiding principles inestablishing its five‐year agenda:Foundational – ORA will continue to build, enhance, analyze, and archive publicdatasets—and produce data tools, technical guides, and other research resources—topromote more rigorous and relevant studies of the arts.Collaborative – ORA will continue to identify and pursue partnership opportunitieswith federal agencies and other sectors and fields of expertise to broaden the reach andrelevance of arts‐related research.Adaptive – ORA will continue to monitor federal research priorities and field‐widetrends for how they might affect research about the arts, and the unit will rapidlyaccommodate research requests from NEA leadership.Research in FY 2017‐2021: A New SchematicReflecting a tighter focus on selected elements of the arts ecosystem described in How Art Works,the FY 2017‐2021 research agenda flows from a new schematic. Far from representing a logic model ortheory of change for “how art works,” the schematic aims to supplement, not replace, the 2012 systemmap. It limits the field of inquiry to specific domains and relationships within the ecosystem. For clarity’ssake, however, certain variables have been retitled and/or repositioned so that the model can serve as astand‐alone schematic.NEA Office of Research & Analysis ‐ 3December 2016
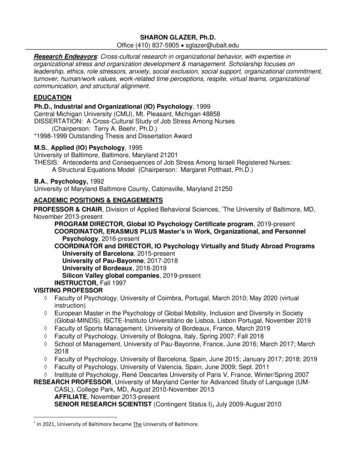
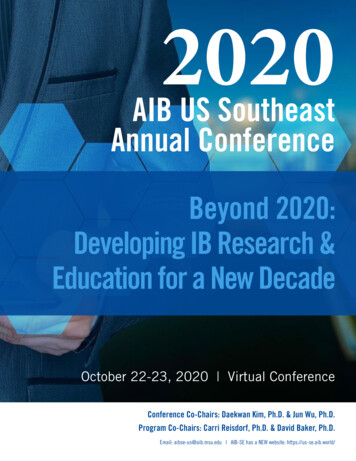
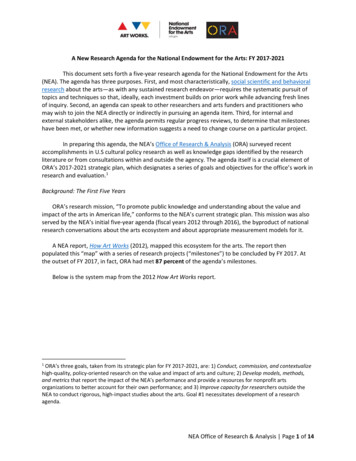
Below is the new schematic guiding the NEA’s FY 2017‐2021 research agenda.At the center of the schematic are two ovals, which harken back to the respective nodes, “ArtsParticipation,” and “Arts Infrastructure,” on the How Art Works system map from 2012. ArtsParticipation, in the new schematic, remains inclusive of various modes of participation. These modesare: attending arts events; reading literature; creating or performing art; consuming art via electronicmedia; and learning in the arts. But now Arts Infrastructure also has been designated as a centralconcern of NEA research—specifically in its new appellation, Arts/Cultural Assets, which denotes artistsand arts workers, arts venues and platforms, and arts organizations and industries.Historically, the NEA’s research office has always aggregated and analyzed data about both of thesedomains. Whether reporting the percentage of American adults who participate in the arts, counting thenumber of workers in artist occupations, or estimating the total economic value of arts industries, ORAhas helped to build, maintain, and update federal statistical systems for measuring the arts. This is coremeasurement work in which the NEA plays a unique role across government. Consisting largely of theproduction and refinement of descriptive statistics, this function will continue unabated over the nextfive years, according to the agenda. In short, ORA will sustain these investments, while attempting to fillknowledge gaps.On the left‐hand side of the model is a rectangle labeled Inputs (Boosters or Inhibitors). This box ismeant to represent a host of selected factors that either enhance or inhibit both of the central values ofthe model (Arts Participation and Arts/Cultural Assets). Whereas in the 2012 system map, the key“inputs” to Arts Participation are “Arts infrastructure” and “Education,” the new schematic admits of aconstellation of factors—some of which may yet be unknown—that affect the health and vitality of ArtsParticipation and Arts Infrastructure, respectively. To understand these factors, the NEA research officeNEA Office of Research & Analysis ‐ 4December 2016
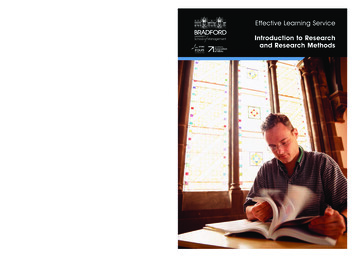
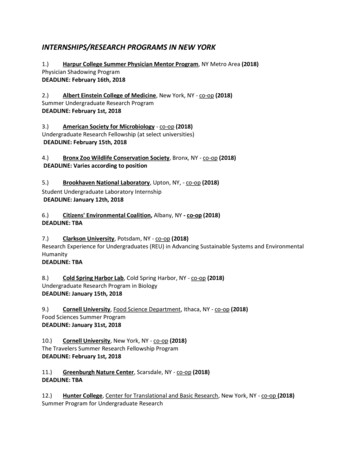
will make new investments in studies that are exploratory in nature, quite possibly starting withqualitative research (e.g., case studies).On the right‐hand side of the model are two broad categories of outcome that flow from the centralovals, Arts Participation and Arts/Cultural Assets. The outcome categories are grouped by level ofanalysis: Individual‐Level Outcomes, which may be seen as resulting directly from Arts Participation byindividuals, and Societal and Community‐Level Outcomes resulting from the presence of Arts/CulturalAssets in communities or across the nation. To investigate these outcomes further, ORA proposesheightening investment in research using experimental and quasi‐experimental study designs. Doing sowill permit researchers more rigorously to explore causal relationships that might exist between the artsand positive individual and/or group outcomes.What do we mean by distinguishing between these categories of outcome? The schematicacknowledges not only horizontal movement—i.e., the linear relationship from “Inputs (Boosters orInhibitors)” to “Arts Participation” and “Arts/Cultural Assets” and then to “Individual‐Level Outcomes”or “Societal and Community‐Level Outcomes.” The schematic also recognizes vertical relationships (e.g.,from Arts Participation to Arts/Cultural Assets and vice versa). In particular, the linkage here proposedbetween “Arts Participation” and “Individual‐Level Outcomes,” on the one hand, and between“Arts/Cultural Assets” and “Societal and Community‐Level Outcomes,” on the other, is not meant toexclude the possibility of individual‐level outcomes deriving from the presence of arts or cultural assetsin a neighborhood. Similarly, societal or community‐level outcomes may derive from individuals’participation in the arts.Once again, this schematic is not a logic model or theory of change about how art functions. Instead,it clarifies values and relationships that will drive ORA’s investment of resources.Breaking Down the Outcome AreasThe next two diagrams capture outcome areas specific to Arts Participation and Arts/Cultural Assets.In the first diagram, individuals’ arts participation is seen to correspond with three types of outcome, allof which can be measured at the individual level. Broadly, they are: Cognition, Creativity, and Learning(e.g., improvements in problem‐solving capacity, divergent thinking, memory retention, or transfer inlearning); Social and Emotional Well‐Being (e.g., improvements in resilience, grit, mood regulation, orperspective‐taking); and the Physiological Processes of Health and Healing (e.g., reduction ofneurocognitive or motor skills degeneration; reduction of pain; or improved circulation).The second diagram shows plausible outcome areas associated with the presence of Arts andCultural Assets. To be measured among organizations, industries, or geographic or demographicsubgroups, they include: Civic and Corporate Innovation (e.g., improvements in civic engagement orentrepreneurship); Attraction for Neighborhoods and Businesses (e.g., improvements in residents’attachment to community, or the ability of place to draw a talented labor force); and National andState‐Level Economic Growth (e.g., a growing proportion of the gross domestic—or state—productbeing generated by arts and cultural industries).Before leaving this section, it is important to stress that the outcome categories listed above (anddepicted below) are not watertight. Rather, they each stem from a distinctive body of researchestablishing or supporting hypotheses for a positive relationship between the arts and the outcome areain question. Also worth noting is that while positive relationships are indeed implied here, NEA‐NEA Office of Research & Analysis ‐ 5December 2016
supported studies that uncover no relationship, or even a negative relationship, will be valued to theextent that they invalidate or otherwise qualify such hypotheses.NEA Office of Research & Analysis ‐ 6December 2016
Research Topics and ApproachesNow that a framework has been created for illustrating the research domains of interest to ORA,it becomes necessary to identify topics within each of them. Below, for each of the terms describedabove, is a series of tentative topics or items that will populate the NEA’s five‐year research agenda.They are not research questions, which will result from direct engagement with the topics themselves.Alongside each research topic is a potential research approach—that is, the data sources and/ormethodologies that ORA deems useful in the topic’s investigation.Agenda Item #1.Research AgendaTopicArts Participation:Selected InputsMotivations andbarriers2.Personal preferencesand tastes3.Role of digital mediaDescriptionPotential ResearchApproachAnalyze and report reasonsfor participating (or notparticipating) in artsactivities, and any relatedbarriers. Investigate howthese factors—incombination withgeographic, socio‐demographic, attitudinal,and behavioral variables—help or hinder artsparticipation.Analyze and reportpreferences for specific artforms (e.g., dance, theater,visual art) or modes ofparticipation (e.g.,attendance, art‐making,consumption via electronicmedia). Investigate howthese factors—incombination withgeographic, socio‐demographic, attitudinal,and behavioral variables—help or hinder artsparticipation.Synthesize new and extantdata about the role oftechnology in engaging thepublic with arts experiences.Research questions mayinclude: a) what are sharedand divergent practicesUse sources such as the2017 Survey of PublicParticipation in the Arts(SPPA) and the 2016General Social Survey(GSS).Use sources such as the2017 SPPA, the 2014Health and RetirementStudy (HRS), U.S.Department of Educationlongitudinal surveys, andthe Panel Study of IncomeDynamics (PSID).Use one or more of thefollowing sources: anational survey ofnonprofit artsorganizations; a scan ofNEA grant projectdocumentation; analysisNEA Office of Research & Analysis ‐ 7December 2016
4.Extent of ticket priceelasticity5.Cultural influences fordistinct populationsubgroups6.7.Arts Participation:Core VariablesDescriptive statisticsand trendsArts Participation:Discipline‐SpecificGapsK‐12 arts educationaccess andenrollmentamong nonprofitorganizations in usingtechnology to promote artsengagement; b) what factorspredispose adults to usetechnology to engage withthe arts; and c) whichorganizational practicesappear effective in usingtechnology to promote artsengagement, by mode andart form?Analyze and report therelationship betweenchanges in admission pricesand the demand for visualand performing arts events.Analyze and report onfactors affecting artsparticipation by populationsubgroups that are typicallyunder‐represented (andunder‐reported) in largefederal datasets.of 2017 SPPA findings; andcase studies of nonprofitpractices to engage thepublic with arts viatechnology.Analyze and report onfactors such as: frequency,length, and breadth of artsparticipation; where andwith whom participationoccurs; geographic, socio‐demographic, behavioral,and attitudinalcharacteristics ofparticipants and non‐participants; and longitudinalchanges in participation.Use sources such as the2017 SPPA, the 2014 GSS,the 2014 HRS, the 2013‐2016 Annual Arts BasicSurveys (AABS), theAmerican Time UseSurveys (multiple years),U.S. Department ofEducation longitudinalsurveys, and, whereapplicable, social mediadata.Support a NEA ArtsEducation data initiative thatwould incentivize state‐levelreporting of arts ed. data tothe public.Provide technicalconsultation services inthe administration andoversight of grantssupporting these efforts.Conduct a systematicliterature review or meta‐analysis.Conduct an ethnographiccase study series.NEA Office of Research & Analysis ‐ 8December 2016
8.9.10.11.12.Literary readingtoday: a deep diveIndividual‐LevelBenefits of ArtsParticipationOlder adults’ healthand well‐beingPositive outcomesassociated withstudents who scoredhighly on the 2016National Assessmentfor EducationalProgress (NAEP) testin arts educationPositive outcomesassociated, over time,with student‐levelarts participation(including artseducation)Selected Inputs forArts and CulturalAssetsLong‐term patterns ofhousehold giving tothe artsSynthesize new and extantdata about literary readingpatterns in the U.S. toanswer questions suggestedby the nationally‐reported,long‐term declines inreading.Use sources such as the1982‐2017 SPPA, the 2013and 2015 AABS, theAmerican Time UseSurveys (multiple years),and other surveys andindustry reports. Usesocial media data ifapplicable.Analyze and reportcorrelations between artsparticipation (particularlyart‐making) and positivephysical and psychologicalhealth outcomes.Analyze and reportcorrelations betweenstudents’ performance onthe NAEP arts education testand a variety of contextualfactors, academic‐ and non‐academic‐related.Use the 2014 HRS.Use 2016 NAEP artseducation assessmentdata.Analyze and reportcorrelations betweenstudents’ exposure to artsparticipation and artseducation, early in life, andtheir academic and non‐academic achievements laterin life.Use longitudinal datasystems maintained by theU.S. Department ofEducation, such as theEducation LongitudinalSurvey, the EarlyChildhood LongitudinalSurvey, the Middle GradesLongitudinal Survey, andthe High SchoolLongitudinal Survey.Analyze and report family‐level patterns of giving to thearts—over time—in relationto giving to other causes,and how these patternsrelate to the socio‐Use the PSID (multipleyears).NEA Office of Research & Analysis ‐ 9December 2016
13.14.Career outcomes ofarts degree‐holdersArts and CulturalAssets: Core VariablesDescriptive statisticsand trendsconcerning artists andother cultural workers15.Descriptive statisticsand trendsconcerning arts andcultural industries16.Descriptive statisticsand trendsdemographic characteristicsof those families.Analyze and report laborforce outcomes for peoplewho have graduated withpostsecondary school artsdegrees, and how andwhether these individualspursue arts‐related careers.An
4. Engaging the public with arts data and analytical tools. Examples: Established a freely accessible National Archive of Data on Arts & Culture, which includes not only 265 arts datasets containing more than 73