Transcription
CONSOLIDATED ENDOWMENTFUND REPORT20191
CONSOLIDATEDENDOWMENT FUNDREPORT 2019ContentsEndowment3ENDOWMENT FOCAL POINTS4THE UNIVERSITY OF WASHINGTON ENDOWMENT6CONSOLIDATED ENDOWMENT FUND PROGRAM SUPPORT8CONSOLIDATED ENDOWMENT FUND INVESTMENT MANAGEMENT AND OVERSIGHT10 CONSOLIDATED ENDOWMENT FUND SPENDING POLICY AND OBJECTIVES12 CONSOLIDATED ENDOWMENT FUND INVESTMENT STRATEGY AND PERFORMANCEGeneral14 GLOSSARY15 INVESTMENT MANAGERS16 CONTACTS AND FURTHER INFORMATIONC ON S OL ID AT E D E N D OW M E N T F U N D R E P OR T 2019 /2
ENDOWMENT FOCAL POINTSFiscal Year 2019 (FY19)CONSOLIDATED ENDOWMENT FUND HIGHLIGHTS Added 172 new endowments Distributed 130 million in campus supportFISCAL YEAR20152016201720182019 3,076 2,968 3,144 3,407 3,5886.8%-1.6%13.6%9.6%5.8%Number ofendowments4,3634,5064,6854,9045,076Distributions toprograms (in millions) 105 113 113 121 130Fiscal Years 2010–2019 Added 1,742 new endowmentsMarket Value Distributed 984 million in campus support(in millions)ReturnC ON S OL ID AT E D E N D OW M E N T F U N D R E P OR T 2019 /3
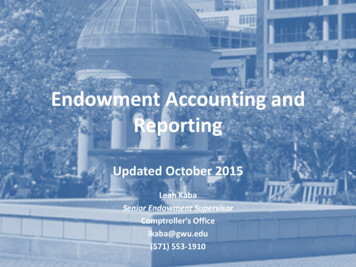
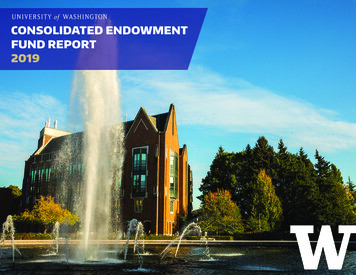
THE UNIVERSITY OF WASHINGTON ENDOWMENTIn 1905, the University of Washington (UW) received its firstcash endowed gift of 400, the Philo Sherman Bennett EndowedVALUE OF THE CEFFY 2000-2019 ( in millions)Prize. This endowment, as well as the bulk of the University’sendowments, invests in the Consolidated Endowment Fund (CEF). 4,000Though distinct in purpose or restriction, endowed funds are 3,500commingled in the CEF and tracked with unit accounting muchlike a large mutual fund. Endowed gifts are exchanged for units 3,000that represent a claim on a portion of the entire CEF. 2,500Since the initial cash gift, the value of the CEF has grown to 2,000 3.6 billion as of June 30, 2019. 1,500 1,000 500 0C ON S OL ID AT E D E N D OW M E N T F U N D R E P OR T 2019 /4
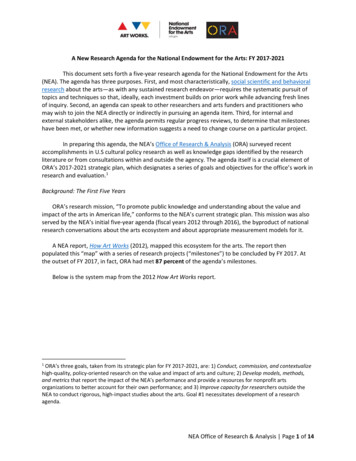
As the UW’s schools and units expand, and as our faculty andstudents continue to excel in scholarship and research, theGROWTH OF A HYPOTHETICAL 100,000 ENDOWMENTGIFT OVER 20 FISCAL YEARS ENDING JUNE 30, 2019University must meet the cost of innovation. DistributionsFY 2000–2019 ( in thousands)from endowments make that possible. Endowments provide 160quality of the UW experience. 140A hypothetical gift of 100,000 invested on July 1, 1999 would 120have provided 118,706 in total campus support over the past 10020 years. At the end of this same period, the endowment’sending market value, net of these distributions, would be 145,056.(in thousands)the University with a competitive edge and help enhance the 80 60 40 20 0CEF Market ValueCEF Market ValueU N IV E R S IT Y OF W AS H IN G T ON 2019 /570% ACWI & Blended Benchmark*70% ACWI & Blended Benchmark
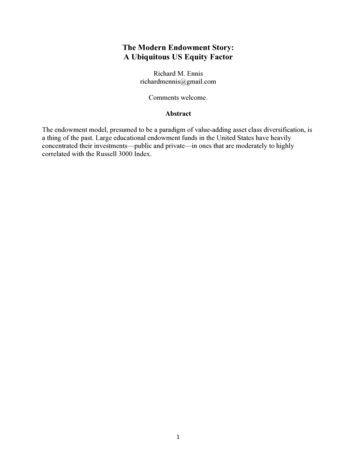
CONSOLIDATED ENDOWMENT FUND PROGRAM SUPPORTGenerous donor support, coupled with investment returns,resulted in the growth of endowment distributions over theENDOWMENT SUPPORT FY 2019By PurposeResearch Activities7%Faculty Support23%past decade.Academic Support18%The majority of endowments benefit specific departmentsand programs. Donor designated purpose make up 98% ofnon-operating University endowment funds.The CEF supports many unique purposes and providesopportunities for students and faculty in their quest forStudent Support29%Other UniversityActivities*23%excellence and innovation.By School and CollegeStudent Financial Aid5%Foster School of Business6%College ofEngineering8%UW Medicine21%CenterallyAdministered8%Operating Funds18%College of Arts andSciences13%Other Colleges, Schools & Programs21%*Includes endowments designated for institutional support, affiliates, and University operating funds.C ON S OL ID AT E D E N D OW M E N T F U N D R E P OR T 2019 /6
SCHOOLS, COLLEGES AND PROGRAMSEndowment Valueat 6/30/19Schools, Colleges and Programs with EndowmentsUW MedicineCollege of Arts & SciencesCollege of EngineeringFoster School of BusinessStudent Financial AidOffice of the President and ProvostCollege of the EnvironmentLaw SchoolIntercollegiate AthleticsSchool of NursingUndergraduate Academic AffairsUniversity LibrariesGraduate SchoolTacoma CampusCollege of Built EnvironmentsSchool of DentistrySchool of Social WorkCollege of EducationSchool of PharmacyEvans School of Public Policy and GovernanceSchool of Public HealthHealth SciencesCoMotionOffice of ResearchInformation SchoolFinance and FacilitiesUniversity of Washington PressOffice of Minority Affairs and DiversityBothell CampusOffice of the Vice President of Student LifeContinuum CollegeUniversity AdvancementOperating FundsNon-UW EndowmentU N IV E R S IT Y OF W AS H IN G T ON 2019 /7Number of ,2126,288,9795,001,7724,162,1562,292,118871,032 33,782 3,587,722,721675,076
CONSOLIDATED ENDOWMENT FUND INVESTMENTMANAGEMENT AND OVERSIGHTThe Board of Regents of the University of Washington is vested bystatute with responsibility for the management of the properties of theUniversity, including the Consolidated Endowment Fund. Investmentprogram oversight resides with the Finance and Asset ManagementCommittee (FAM), a sub-committee of the Board of Regents.In September of 2015, the Board of Regents approved theestablishment of an internal investment management company,known as the University of Washington Investment ManagementBOARD OF REGENTS AS OF JUNE 30, 2019Constance W. Rice (Chair)Joel Benoliel (Vice Chair)William S. AyerJoanne R. HarrellJeremy JaechLibby G. MacPheeRogelio RiojasBlaine TamakiCompany (UWINCO). The UWINCO advisory committee wasDavid Zeecktransitioned to an investment company advisory board (UWINCOKaitlyn ZhouBoard).UWINCO BOARD AS OF JUNE 30, 2019The University’s Chief Investment Officer (CIO) directs the day-to-dayactivities of the investment portfolios. The CIO manages a team ofinvestment professionals who, within a risk management framework,develop the strategic and tactical direction of the portfolio and selectasset managers.Michael Larson (Chair)William S. AyerKristianne BlakeDavid BondermanMary PughBryan WhiteAna Mari Cauce (UW President, ex officio)C ON S OL ID AT E D E N D OW M E N T F U N D R E P OR T 2019 /8
ROLES AND RESPONSIBILITIESBoard of RegentsUWINCO BoardChief Investment Officer (CIO)Sets investment policyAdvises the CIOImplements investment program Spending rate Investment planning Day-to-day management Strategic asset allocation Asset allocation Tactical asset allocation Delegations Manager identification Manager appointments Market trends Manager terminationsAppoints investment officers/advisors Chief Investment OfficerAdvises Board of Regents/President UWINCO Board members Investment program oversight Investment consultants CIO oversight Risk management ResearchMonitors results Performance reportingReviews results Program oversight /accountabilityU N IV E R S IT Y OF W AS H IN G T ON 2019 /9
CONSOLIDATED ENDOWMENT FUND SPENDINGPOLICY AND OBJECTIVESSpending policies provide a disciplined approach to movingmoney from the endowment to support the purpose designatedGROWTH OF HYPOTHETICAL 100,000 ENDOWMENT OVER20 FISCAL YEARS ENDING JUNE 30, 2019by the donor on a foreseeable and consistent basis.A good spending policy must strike a balance between providing apredictable and stable stream of revenue for current beneficiariesand maintaining the purchasing power of the revenue stream forfuture beneficiaries.A 100,000 gift invested in the CEF 20 years ago would haveearned 163,762 in investment returns. A portion of this return 21,720would have been distributed to campus and the remainderInternal Feesreinvested in the CEF. As a result, the endowment would havedistributed 118,706 while increasing its purchasing power.This endowment model provides a growing base to supportcurrent and future beneficiaries. 100,000Gift Amounton July 1, 1998 163,762InvestmentReturnC ON S OL ID AT E D E N D OW M E N T F U N D R E P OR T 2019 / 10- 96,986ProgramSupport 145,056Endowment Valueon June 30, 2019
The Board of Regents is vested with the responsibility to set anCEF DISTRIBUTIONS VS. RETURNSendowment distribution spending policy that balances the needs ofFY 2010-2019current endowment beneficiaries with the requirement to protectthe endowment’s corpus to meet future University needs. Under thecurrent spending policy, distributions to programs are 4% of a five-year20%and offsets the internal cost of managing endowment assets (0.20%).Given current financial market volatility and projected lower returnsfor the CEF, the UWINCO Board recommended a reduction in theendowment spending rate from a total of 5.0 percent to 4.5 percent. To4.03.010%2.00%cushion the impact of a reduction to units, a 3-year stepped reduction1.0was developed. The distribution rate reduction is being phased asfollows:-10% FY20: 10 basis points to 4.9 percentFY10FY11FY12FY13FY14FY15Yearly Payouts FY21: 20 basis points to 4.7 percentFY16FY17FY18ReturnsThe estimated payout for fiscal year 2020 is 3.63 per unit.* FY22: 20 basis points to 4.5 percentAll endowments will utilize the same rates. Once fully implemented,the program distribution rate will be 3.6 percent and the administrativefee distributions rate will be 0.90 percent. The revised distribution rateputs endowment funds on a more sustainable trajectory that benefitsstudents, faculty and all CEF beneficiaries now and well into the future.U N IV E R S IT Y OF W AS H IN G T ON 2019 / 11FY19 FY20*0.0per unit distribution ( )supports campus wide fundraising and stewardship activities (0.80%),CEF total return (%)rolling average. An administrative fee of 1% of a five-year rolling average
CONSOLIDATED ENDOWMENT FUND INVESTMENTSTRATEGY AND PERFORMANCEEndowment portfolios are commonly managed around a core setof objectives focused on the need to provide support for endowedprograms in perpetuity. The Board of Regents in conjunction withthe UWINCO Board establishes the policy asset allocation judgedCEF ASSET ALLOCATIONAs of June 30, 201929% CAPITAL PRESERVATIONto be most appropriate for the UW from a long-term potentialreturn and risk perspective. The policy asset allocation is reviewedFixed Income11%annually for its continuing fit with the University’s risk profile and withconsideration of the changing dynamics of the capital markets.EmergingMarkets Equity19%The CEF asset allocation includes two clearly defined categories ofinvestments: those which facilitate growth or appreciation (CapitalAbsolute Return18%Appreciation), and those which preserve endowment values (CapitalPreservation). At June 30, 2019, 71% of the CEF was invested inCapital Appreciation and 29% in Capital Preservation. While our longterm strategy is to maintain an equity-oriented portfolio, we keepample liquidity within Capital Preservation to meet the CEF’s fundingOpportunistic 2%DevelopedMarkets Equity32%Real Assets5%Private Equity13%requirements, as well as to take advantage of market dislocations.The UW is differentiated from peers by a larger allocation to publicinternational equities, particularly emerging markets.71% CAPITAL APPRECIATIONNote: Percentages may not sum due to roundingC ON S OL ID AT E D E N D OW M E N T F U N D R E P OR T 2019 / 12
For the fiscal year ending June 30, 2019 (FY19) the CEF returned 5.8% versus 6.2% for the passive benchmark and 4.8% forthe public university peer median. While relative performancePERFORMANCE COMPARISONS1, 5, 10, AND 20 YEAR ANNUALIZED RETURNSFOR PERIODS ENDING JUNE 30, 2019generally lagged, absolute performance for FY19 was positiveacross all CEF strategies, led by Private Equity. Market conditions8.0%given their greater exposure to global trade and China’sslowing economy. Our geographic positioning greatly impacted8.9%8.9%were volatile during FY19, particularly for international equities5.8%performance this year as the US continued its decade long bull7.1%6.7%6.2%4.8%6.4%5.1%5.5%4.9%run. While US outperformance relative to international equities hasbeen unusually prolonged, its sustainability is in question.Our focus remains on long-term results where the CEF hasconsistently maintained solid relative performance. The chart tothe right shows that the CEF has returned 6.7%, 8.9% and 7.1%1 Year5 Year10 Year20 Yearfor the 5, 10 and 20-year periods, respectively, and continues tooutperform the passive benchmark. The UW is at or above medianCEF PerformancePassive Benchmark*Cambridge Associates Median**performance relative to public peers for all periods.*70% MSCI ACWI (net) 30% Bloomberg/Barclays Intermediate Government Bond Index**Cambridge Associates Quarterly Survey of public university endowments of 1-7 BillionU N IV E R S IT Y OF W AS H IN G T ON 2019 / 13
GLOSSARYAbsolute Return. Low correlation and low betaequities and creditAsset Allocation. Diversification of endowmentassets among various asset classes. Assetallocation affects both risk and return and is acentral concept in investment management.Asset Classes. Including, but not limited to,developed markets equity, emerging markets.private equity, real assets, opportunistic,absolute return and fixed incomeCapital Appreciation. Provides the capitalgrowth that will enable the CEF to meet itsspending requirements, while at the same timepreserving the purchasing power of the CEF forfuture generationsCapital Preservation. Provides liquidity insupport of spending and capital commitments;a deflation hedge; and reduces the overallvolatility of the CEFEquity. Investments where the underlying assetis the ownership interest in a companyFixed Income. Government, corporate ormunicipal bonds which pay interest until thebonds mature, including cash and short termliquid assets (e.g., Treasury bills, commercialpaper and nonconvertible bonds with remainingmaturities of under one year)Opportunistic. Diversify risk-return profile ofthe CEF, often with credit instrumentsReal Assets. Investments in real estate, naturalresources and inflation protection vehiclesSpending. Amount withdrawn from anendowment as authorized by the Board ofRegentsSpending Policy. Guidelines used to determinethe frequency and rate of distributions from theendowmentReturn. The accepted method of measuringthe performance of equity and bond funds; thecombination of income (interest and dividends)and appreciation/depreciation in the fund’s valuefor a specified period of timeC ON S OL ID AT E D E N D OW M E N T F U N D R E P OR T 2019 / 14
INVESTMENT MANAGERS AS OF JUNE 30, 2019*32 Degrees CapitalAccel-KKRAdamas Partners, LLCAKO Capital LLPArisaig Partners, LtdArrowstreet Capital, LPAtlantic Trust Investment Advisors, Inc.Atlas Holdings LLCBain CapitalBattery VenturesBaupost Group, LLCBlackRock Alternative AdvisorsBridger Capital, LLCBrightstar Capital PartnersBurford Capital Investment Management, LLCBurgundy Asset Management, Ltd.Cadent Energy Partners, LLCCastlelake, LPCC&LCenterbridge Capital PartnersCity of London Investment Management Company, LtdCLSAClairvest Group, Inc.Commonfund Capital, Inc.CrossHarbor Capital PartnersDeer Management Company, LLCDeerfield Capital Management, LLCDenham Capital Management, LPDragoneer Investment Group, LLCDynamo Administracao de Recursos LTDAEndeavour Capital, LLCEquus Capital Partners, Ltd.Fidelity Real Estate Partners, LLCFrazier Healthcare PartnersGeneral Catalyst Partners, LPGlendon Capital ManagementGreen CourtHamilton LaneHIG Capital, LLCIgnition Partners, LLCIncentive Active ValueIncome Research & ManagementJ.C. Flowers & Company, LLCLombard InternationalLone Pine Capital, LLCMadrona Venture Group, LLCNewfoundland CapitalPayden & RygelPhoenix Property Investors LtdPugh Capital Management, Inc.U N IV E R S IT Y OF W AS H IN G T ON 2019 / 15Rimrock Capital Management, LLCRiva Ridge Capital ManagementRiverside CompanyRockland CapitalSelect Equity GroupSiguler Guff & Company, LLCSilchester International Investors, LLPSilicon Valley BankSouthwest Value PartnersStandard Investment ResearchTA Associates, LLCTenex Capital ManagementTPG Partners, LPValinor Capital Partners, LPVarecs Partners LimitedWard Ferry Management, LtdWellington Management CompanyWestbridge CapitalWestwood Global InvestmentsYiheng Capital, LLC*excludes idle accounts
CONTACTS AND FURTHER INFORMATIONThis report on the management of the University’sendowed funds was prepared by the Treasury Officefor donors and other interested parties. Reports arealso available, upon request, to donors and fundadministrators for each of the individual funds in theConsolidated Endowment Fund.For Further InformationIf you have questions or comments about this report,or would like copies of the Consolidated EndowmentFund investment policies, please contact:If you would like to receive information on howyou can support the University’s programs, pleasecontact:Dan PetersonVice President for DevelopmentUniversity Advancement(206) 685-1980dcpeters@uw.eduKeith FergusonChief Investment Officer(206) 685-1822invest@uw.eduRobert BradshawAssociate Treasurer(206) 221-6752trsyops@uw.eduFor further information on the University’s investmentprogram please visit: finance.uw.edu/treasury/CEFC ON S OL ID AT E D E N D OW M E N T F U N D R E P OR T 2019 / 16
BOTHELLS E AT T L EC ON S OL ID AT E D E N D OW M E N T F U N D R E P OR T 2019 / 17TA C O M A
College of Arts & Sciences 464,815,524 1,030 College of Engineering 297,401,304 451 Foster School of Business 201,959,806 255 Student Financial Aid 169,168,438 252 Office of the President and Provost 131,076,954 93 College of the Environment 115,580,060 303 Law School 106,799,481 112 Inter