Transcription
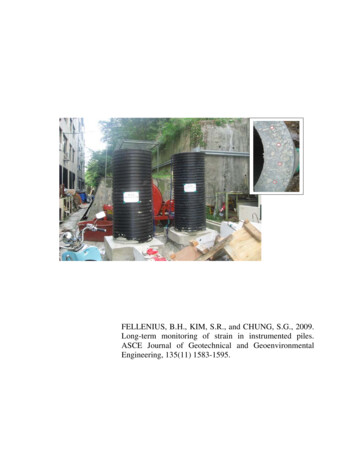
FELLENIUS, B.H., KIM, S.R., and CHUNG, S.G., 2009.Long-term monitoring of strain in instrumented piles.ASCE Journal of Geotechnical and GeoenvironmentalEngineering, 135(11) 1583-1595.
Long-Term Monitoring of Strain in Instrumented PilesBengt H. Fellenius, P.E., M.ASCE1; Sung-Ryul Kim, Ph.D.2; and Sung-Gyo Chung, Ph.D., M.ASCE3Abstract: The development of strain in two 31 and 56 m long instrumented postdriving grouted cylinder piles at a site west of Busan,South Korea, were monitored during 200 days after construction, whereupon a static loading test was performed. Initial strain measurements showed unexpected elongation of the pile, probably due to swelling from absorption of water but as the soil reconsolidated, theelongation changed into shortening, probably due to imposed residual load in the pile. The resulting compression of the pile eventuallyoffset the swelling of the pile. To investigate the cause of the strain changes more closely and enhance the evaluation of the field data, twoshort pile pieces were prepared and placed free-standing above ground in an outside laboratory. One piece was from a cylinder pile ofwhich central void was grouted and one was made up by grouting inside a temporary casing. The monitoring showed that the short piecesappeared first to shorten and then to elongate due to the heating and cooling from the hydration process. When strains and temperature hadstabilized 150 days after start of the study, both pieces were submerged to introduce swelling of the concrete. For the first 100 days aftersubmerging, the swelling strains in both short pieces amounted to 100 . Seven hundred days after submersion, the total swelling strainswere 150 and 250 .DOI: 10.1061/共ASCE兲GT.1943-5606.0000124CE Database subject headings: Instrumentation; Piles; Grouting; Strain; Measurements; Swelling; Monitoring.IntroductionThe Nakdong River estuary delta covers a large area west of thecity of Busan, South Korea, and is composed of very thick deposits of compressible normally consolidated clays with occasionalinterbedded sand layers. Most of the land has been lying vacantdue to high construction costs of the deep foundations necessaryfor all but light structures. Recently, however, because of spacebecoming increasingly limited in the city, heavy buildings arebeing designed and built in the area. The design has to take intoaccount consolidation settlement caused by fill placed to raise theland above flood levels. For this reason and because of the lowbearing capacity of the deltaic soils, all the buildings require piledfoundations. The commonly employed deep foundation system inKorea consists of steel pipe piles driven to competent soil layers,such as bedrock or dense soil. Where these piles then becomevery long, such as the 70 to 80-m lengths anticipated for theNakdong River estuary delta, the foundations become very costly.For the development of two areas, called Shinho and Myeongji, tobe developed with tall apartment buildings to house approximately 80,000 people, an alternative pile type is considered: a1Bengt Fellenius Consultants Inc., 1905 Alexander St., SE, Calgary,AB T2G 4J3, Canada 共corresponding author兲. E-mail: bengt@fellenius.net2Assistant Professor, Dept. of Civil Engineering, Dong-A Univ., 840Hadan-dong, Saha-gu, Busan 604-714, Korea. E-mail: sungryul@dau.ac.kr3Professor, Dept of Civil Engineering, Dong-A Univ., 840 Hadandong, Saha-gu, Busan 604-714 Korea. E-mail: sgchung@daunet.donga.ac.krNote. This manuscript was submitted on August 9, 2008; approved onApril 17, 2009; published online on October 15, 2009. Discussion periodopen until April 1, 2010; separate discussions must be submitted forindividual papers. This paper is part of the Journal of Geotechnical andGeoenvironmental Engineering, Vol. 135, No. 11, November 1, 2009. ASCE, ISSN 1090-0241/2009/11-1583–1595/ 25.00.closed-toe cylindrical concrete pile locally called pretensionedspun high strength concrete 共PHC兲 piles 共in North America, avery similar pile is known as the ICP pile兲. The costs of a piledfoundation supported on the PHC pile are between a quarter to athird of those of a foundation supported on the steel piles. ThePHC pile is considered less suited for the hard driving required toreach the termination depths usually selected for the steel piles.However, it was thought possible to limit the pile installationdepth at the Shinho and Myeongji sites by terminating the piles inan intermediate sand layer. Prior to the design of the piled foundations, therefore, a full-scale testing program was executed involving drivability and load response of three strain-gaugeinstrumented test piles. The instrumentation consisted of pairs ofvibrating wire strain-gauges placed at different depths in the central void in the pile. The void was then grouted. The purpose ofthe instrumentation was to determine the load distribution in thepile in static loading tests performed about 6 months after the endof driving, when the soils were expected to have reconsolidated共“setup”兲.The strain-gauge records taken during the static loading testcan be converted to loads to establish the distribution of the loadsimposed in the test. However, prior to the start of the loading test,loads will develop in the pile due to reconsolidation of the soilafter the driving. These loads are called locked-in loads or residual loads. For the subject project, in order to determine themagnitude and distribution of the residual loads, the strain-gaugeswere read frequently after the grouting of the central void. It wasthen found that the build-up of strain recorded by the gaugesshowed some unexpected behavior. A laboratory study was therefore instigated consisting of two 2.0-m-long strain-gauge instrumented pieces of pile where no soil could influence the measuredstrains, leaving only the effects of the curing of the grout and, asit turned out, of temperature variations. One of the short pieces istaken from a PHC pile and one is a dummy cast in an axiallyflexible casting mold. This paper reports and discusses the strainsobserved in the test piles and short pile pieces.JOURNAL OF GEOTECHNICAL AND GEOENVIRONMENTAL ENGINEERING ASCE / NOVEMBER 2009 / 1583
Fig. 1. Photo of the PHC cylinder pile cross section. Four prestressing rebars are circled in red.Observations in Full-Scale Test PilesThe PHC test pile used at the site is a 600-mm outside diameterprestressed concrete cylinder with an 85-mm wall 共cross sectionarea 1 , 375 cm2兲 embedding 24 9.2-mm rebars 共steel area toconcrete area ratio of 1.1%兲 anchored to steel end plates with a430-mm central hole. The net prestress is about 8 MPa. The pileis cast in 5 to 15-m segments. The segments are spliced by welding the end plates together in the field, one splice at a time as thepile is driven. The concrete consists of Portland cement and concrete aggregates of crushed granite. The nominal cube strength is80 MPa. Fig. 1 shows a photograph of a portion of the pile crosssection.The testing program included two PHC test piles, one at theShinho site and one at the Myeongji site. The Shinho pile 共56-membedment兲 was driven on January 18, 2006 and the Myeongjipile 共31-m embedment兲 was driven on January 17, 2007. After thedriving, a reinforcement cage was placed and grouted in the central void of each pile. The cage consisted of three longitudinal22-mm rebars and a 10-mm-diameter spiral reinforcement at a450-mm pitch. For the Shinho pile, 12 pairs of vibrating wiresister-bar gauges 共Geokon Model 4911A兲 were attached to thereinforcing cage in a vertical position before lowering the cageinto the central void. The Myeongji pile had seven pairs. Theuppermost pair was placed at the ground surface for the Shinhopile 共the pile had a 1-m stick-up兲 and at 4 m below ground in theMyeongji pile. After completed driving, the central void in eachpile was filled with Portland cement grout without coarse aggregates. The grout in the Shinho pile had no sand content, the water/cement ratio was 0.45, and the cube strength was 18 MPa. Thegrout in the Myeongji pile had proportions of water, cement, andsand of 22, 67, and 11%, respectively, and a water/cement ratio of0.33. The cube strength was not tested. Curing-acceleration andwater-reducer admixture, types GeoFix1p and Sika Viscocrete-R,were included for Shinho and Myeongji piles, respectively, to anamount of 1% of the cement weight.The strain-gauges were read at frequent intervals from theirinstallation into the void in the pile and after grouting the void.Figs. 2–4 show the development of temperature and strain recorded at eight gauge levels in the Shinho O-cell pile. The valuesshown are from the two gauge pairs 共#12兲 placed 1 m below thepile head 共at the ground surface兲 and from single gauge pairs共#11, #10, #9, #8, and #2兲 placed at depths of 4, 9, 14, 19, and 49m, respectively. Intermediate gauge records are omitted for clarity. The uppermost gauge location consisted of two pairs of sisterbar gauges and are marked #12A–12D. Records were taken untilthe start of static loading tests some 200 days after the grouting.The records beyond the first 40 days are not shown in the figures.Negative values indicate apparent shortening 共compression兲 of thesister-bar strain gauges and positive values indicate apparentlengthening 共elongation兲.As shown in Fig. 2, the hydration process of the cement groutgave rise to a steep increase of temperature during the first about15 h after grouting the pile, whereafter the temperature diminished at a progressively smaller rate to a stable temperature afterabout 10 days.The recorded strain changes in the rebars are shown in Fig. 3.During the first 15 h, coinciding with the increase of temperature,the vibrating wire readings decreased, that is, the rebars shortened, suggesting increasing compression in the pile. When thetemperature reduced, the readings indicated that the rebars firstrecovered the shortening and then elongated, suggesting that tension developed in the pile. When the temperature had stabilized,which took about 10 days, the measurements indicated a net tension in the pile.The strain values are not adjusted to the difference in thermalFig. 2. Development of temperature in the O-cell pile at the Shinho site1584 / JOURNAL OF GEOTECHNICAL AND GEOENVIRONMENTAL ENGINEERING ASCE / NOVEMBER 2009
300O-cell Pile at Shinho A10B9A9B2A2B0-50-100-150-200Recovery of Shortening Followed by Elongation-250-3000 Shortening 1of Rebar(a)23STRAIN (µε)STRAIN (µε)3004500-50-100-150-200-250-3005DAYS AFTER GROUTINGO-cell Pile at Shinho site0(b)510152025303540DAYS AFTER GROUTINGFig. 3. Development of strain in the O-cell pile at the Shinho sitecoefficients between the rebar and the concrete and grout. Adjustment 共see discussion below兲 would have reduced the valuessomewhat during the first few days, when the temperature keptchanging. However, the later elongation—tension trend—of therebars at constant temperatures would still occur.It was expected that the gauges down the pile would recordincreasing compression strain 共shortening of the rebar兲 due toreconsolidation of the soil around the pile after the driving disturbance. However, no such change was expected to occur at theground surface gauges 共#12兲. Yet, the records of #12 indicate aslight elongation of the rebars over time, that is, implying a tension load developing in the pile. Further down the pile, therecords indicate an elongation with time, that is, a reduction ofload in the pile with time is suggested. It is hypothesized that the300O-cell Pile at Shinho Site2501501005012B12C12D11A11B02A-50Shortening of rebarSTRAIN (με)12ALengthening of 40506070TEMPERATURE ( C)Fig. 4. Development of strain versus temperature in the O-cell pile atthe Shinho siteelongation is due to swelling when the concrete absorbs waterfrom the soil.The temperature dependency is more clearly demonstrated inFig. 4 showing the strains as a function of the recorded temperature.Figs. 5–7 show the similar development of temperature andstrain recorded by the gauge pairs placed in the O-cell pile at theMyeongji site. The uppermost gauge pair is marked #7A and #7B.The strain values shown are from single gauge pairs 共#7, #6, #5,#3, and #1兲 placed at depths of 4, 9, 14, 24, and 30 m below theground surface. Intermediate gauge records are omitted for clarity. The trends of temperature strain developments in the Myeongji pile are similar to that of the Shinho pile. However, therecorded temperature and strains are much larger for the Myeongji pile. The difference could be due to the different water/cement ratios of the grout for the piles, 33% as opposed to 45%,respectively.For comparison, measurements are offered of strain in a boredpile during the curing of the concrete taken in a 74.5-m-deep,2.6-m-diameter pile constructed in 2006 in the Fraser River deltaic soil, Golden Ears Bridge, Vancouver, British Columbia. A22-m-long permanent steel casing was installed prior to concreting. The pile was instrumented with 10 levels of vibrating wirestrain-gauge pairs type Geokon. The most shallow gauge levelwas at 9.5-m depth and the deepest was at 66-m depth. No information is available on the composition of the grout. The measurements were taken from the grouting of the pile until the start of astatic loading test 共multilevel O-cell test兲, 35 days later. Fig. 8shows the temperature measurements at the gauge levels. Themaximum temperature is approximately the same as for theShinho pile but it took two to three times as long to reach. At thetime of the static loading test, most but not all hydration heat haddissipated. The measured temperatures varied between individualgauges and depths but there was no correlation to depth or towhether a gauge level was inside or below the upper 22-m casing.The recorded changes of strain in the Golden Ears bored pileJOURNAL OF GEOTECHNICAL AND GEOENVIRONMENTAL ENGINEERING ASCE / NOVEMBER 2009 / 1585
Fig. 5. Development of temperature in the O-cell pile at the Myeongji siteare presented in Fig. 9. All curves shown are from uncased portion of the pile. During the first 5–10 days, the strain measurements show that the rebar shortened. Thereafter, a slight recoveryof shortening occurred. There was no net elongation of the rebars.For the upper gauge levels, the changes of strain recorded inthe three piles during the curing period are larger than the maximum residual load that can reasonably be expected to develop inthe pile. For the Golden Ears Bridge, for example, the strainsimposed during the static loading tests, were much smaller thanthose shown in Fig. 9. Clearly, in addition to the influence of thesoil transferring load to the test piles, the records of the straingauge instrumented rebars 共sister bars兲 in the test piles are influenced by curing temperature, swelling due to water absorption ofthe grout, and, for the PHC piles, the restraining of the expansionand contraction of the grout by the cylinder wall and its absorption of water from the soil and the grout—not a factor for thebored pile.A laboratory study was undertaken to shed light on the 3A3B1A1B-300-400O-cell Pile at Myeongji Site-500-600Recovery of Shortening Followed by Elongation-700(a)STRAIN (με )STRAIN (με )00 Shortening 1of Rebar234DAYS AFTER GROUTING-100-200-300-400O-cell Pile at Myeongji Site-500-600-70005(b)51015202530DAYS AFTER GROUTINGFig. 6. Development of strain in the O-cell pile at the Myeongji site1586 / JOURNAL OF GEOTECHNICAL AND GEOENVIRONMENTAL ENGINEERING ASCE / NOVEMBER 20093540
400300200100STRAIN (με)0-100-200Fig. 9. Change of strain during the curing of grout in the GoldenEars Bridge test pile 共data courtesy of Trow Engineering Inc. andAmec Inc., Vancouver, B.C.兲-300-400-500O-cell Pile at Myeongji-600-7000102030 40 50 60 70TEMPERATURE ( C)8090Fig. 7. Development of strain versus temperature in the O-cell pile atthe Myeongji siteof the strain development and to attempt obtaining means to anumerical evaluation of the strains due to nonsoil related effects.Laboratory StudyA laboratory test was undertaken wherein the soil influence wasremoved. The test consisted of two 2.0-m-long pieces of pile. Onepiece was from a PHC pile and one was a “bored pile,” consisting70of casting the pile in a mold consisting of a plastic pipe with a500-mm inside diameter and a wall thickness of 30 mm. TheE-modulus of the concrete is approximately 30 GPa. In contrast,the stiffness of the plastic pipe is very small—an axial load of amere 5 kN on the pipe results in 5% axial strain. Therefore, theplastic pipe will impart negligible restraint to axial strains developing in the concrete, as opposed to the high restraint of PHC pilecylinder wall.The test was set up outdoors. An 800-mm plastic pipe wasplaced around the two pieces to protect against rapid variation ofambient temperature. The two pieces were instrumented with twopairs of a Korean manufactured vibrating wire strain-gauge whichis similar to the Geokon gauge. The gauges were placed in asquare configuration attached to the same arrangement reinforcement cage as used for the field piles and grouted. The grout consisted of cement paste without coarse aggregates and a water/cement ratio of 0.45. No hardening accelerator admixture wasincluded.The laboratory study started on April 25, 2006. Fig. 10 showsa sketch of the short-piece test arrangement.As indicated in Figs. 11 and 12, the temperature development709.5mTemperatures measured in a 74.5 mlong, 2.6 m diameter bored pileTemperatures measured in a 74.5 mlong, 2.6 m diameter bored m40.3m40.3m47.0m3047.0mTEMPERATURE ( C)TEMPERATURE ( C)22.0m5040Start of StaticLoading 3DAY AFTER GROUTING450(b)5101520253035DAY AFTER GROUTINGFig. 8. Temperature records during curing of grout in the Golden Ears Bridge test pile 共data courtesy of Trow Engineering Inc. and Amec Inc.,Vancouver, B.C.兲JOURNAL OF GEOTECHNICAL AND GEOENVIRONMENTAL ENGINEERING ASCE / NOVEMBER 2009 / 1587
indicate about 200 net elongation. A strain of about 100 corresponds to a load on the 0.28 m2 cross section of the groutedpile equal to approximately 1,000 kN.The development of strain in the unrestrained piece, as shownin Fig. 14, differs from that of the PHC piece, indicating thesubstantial effect of the restraining concrete cylinder wall on therebar strains. In fact, it is not just that the strains are smaller, thetrend during the large rise of temperature and subsequent coolingobserved during the first about 15 h is reversed for the unrestrained piece. When the temperature returned to the ambient temperature, the rebar of the unrestrained piece was left with a netelongation of about 100 , in contrast to the rebar in the PHCpiece where the net change was a net shortening of about 50 .Moreover, after the return to stable temperature at about Day 10,the PHC piece shows a gradual shortening of about 50 untilDay 100, whereas the unrestrained piece shows essentially nostrain change between Day 10 and Day 100.The difference between the PHC piece 共“restrained piece”兲 andthe unrestrained piece is further demonstrated in Fig. 15 showingthe measured strain changes versus temperature.After 5 months of observations, on September 29, 2006, Day154, the two short pieces were submerged in water by means offilling the 800-mm plastic pipe around the pieces with water thatthen could be freely absorbed by the concrete. 共Immediately before, the unrestrained piece was stripped of its plastic castingmold兲. Measurements were then continued for a full additionalyear 共until 700 days after grouting兲, with an accidental monitoringpause between February and May 2007, days 287 and 405. Fig.16 shows the measurements of temperature during the entire measurement period.Immediately upon submerging, the pieces began to swell asevidenced by the progressively increasing elongation shown bythe strain-gauges 共Fig. 17兲. Significant swelling continued forabout 3 months, Day 154–250, with the total swell amounting toabout 150 for both pieces. Beyond Day 250, the measuredstrains are considered due to a combination of continued swellingFig. 10. Arrangement of gauges in the two short piecesis very similar for the two pieces and the observations in the piles.The slight temperature change beyond the first 5 days is due tothe fact that the short pieces were placed in the outside and thetemperature was affected by the changing ambient air temperaturebetween April and July in Busan.The development of strain in the PHC piece is shown in Fig.13. Again, the strain values have not been adjusted for temperature. The values indicate a shortening of the rebars as the temperature increases followed by a recovery of the shorteningduring the subsequent cooling. The trend is similar to that observed in the piles. However, after the cooling is completed, thePHC piece is left with a shortening, about 50 , whereas thegauges at the ground surface 共#12兲 in the Shinho O-cell test pile100100SPHC Piece90WN80Temperature (ºC)Temperature (ºC)80N70605040605040303020201010000(a)WEE70SPHC Piece90123Days after Grouting450(b)255075100Days after GroutingFig. 11. Measurements of temperature in the PHC piece during first 150 days after grouting1588 / JOURNAL OF GEOTECHNICAL AND GEOENVIRONMENTAL ENGINEERING ASCE / NOVEMBER 2009125150
100100SUnrestrained Piece90SUnrestrained Piece90WW80N80N70E70Temperature ( oC)Temperature ( s after grouting75100125150Days after groutingFig. 12. Measurements of temperature in the unrestrained piece during first 150 days after groutingand, to a minor extent, the temperature changes. The dashed linesindicate the interlude when no measurements were taken.change of strain in the wire and, therefore, in the sister bar towhich it is attached. The thermal coefficient of the tensioned steelwire of the vibrating wire gauge is approximately the same as thecoefficient of the gauge steel housing and the steel rebar 共sisterbar兲 it is attached to. That is, when temperature changes, the wireand the housing and rebar would elongate or shorten equally andno change would occur in the wire tension, which means that thewire frequency would not change and the vibrating wire gaugeitself then be unaffected by a temperature change. In reality, thereDiscussionA vibrating wire gauge operates on the fact that when the tensionchanges in a wire stretched between two supports, its natural frequency changes. The change of frequency is calibrated to the5050PHC00-50-50CHANGE OF STRAIN (µε)CHANGE OF STRAIN (µε)PHC Piece-100-150-200-100GRADUAL VERY OF SHORTENING (LENGTHENING)SHORTENINGOF REBAR123Days after Grouting4EW-30050(b)255075100125150Days after GroutingFig. 13. Rebar strain in the PHC short piece recorded during first 5 days and the first 150 days after grouting. The strain values have not beenadjusted for the difference in thermal coefficient between the rebars and the concrete and grout.JOURNAL OF GEOTECHNICAL AND GEOENVIRONMENTAL ENGINEERING ASCE / NOVEMBER 2009 / 1589
300REBARS LENGTHENING10050NE200CHANGE OF STRAIN (µε)E150W250N200SUnrestrained PieceW250CHANGE OF STRAIN (µε)300SUnrestrained Piece1501005000-50-50012345Days after Grouting(a)0255075100125150Days after Grouting(b)Fig. 14. Rebar strain in the unrestrained short piece recorded during first 5 days and first 150 days after grouting. The strain values have not beenadjusted for difference in thermal coefficient between the rebars and the concrete and grout.could be a small temperature dependency. The manufacturer共Sellers, personal communication, 2006兲 indicates an apparent decrease of strain 共rebar shortening兲 of 0.3 / C due to a temperature increase.To verify the extent of change of strain due to a temperaturechange for the vibrating wire alone, four sister bars were placedhanging, exposed to open air, but free of all outside influenceother than daily temperature variation over a couple of days. Adata logger was used to record temperature and gauge readings.Two of the four gauges were of Geokon Model 4911A, the sametype used in the piles, and the other two were a similar type of aKorean brand used in the short pieces. The temperature rangedfrom 7 – 16 C. Fig. 18 shows the measured variation of temperature and measured changes of unadjusted strains during the 72 hof monitoring.The differences in strain between each recorded zero strainvalues to the average strain value are shown in Fig. 19. The results of the mentioned simple, narrow temperature range verification test indicate that neither gauge manufacture is affected by atemperature change. Therefore, the gauge’s own temperature sensitivity is considered to be not a cause of measured strain variations for the piles and short pieces and the measured 0W0204060Temperature ( C)80E200150100500E-300(a)CHANGE OF STRAIN (µε)CHANGE OF STRAIN (µε)PHC Piece100-50(b)0204060Temperature ( C)Fig. 15. Rebar strain versus temperature in the short pieces during first 150 days after grouting1590 / JOURNAL OF GEOTECHNICAL AND GEOENVIRONMENTAL ENGINEERING ASCE / NOVEMBER 200980100
Unrestrained70Temperature (oC)Temperature (ºC)100SPHC2006 AprA100Jul200300OctJan 2007400Apr500600JulOct700800Jan 200802006 AprA(b)Days after Grouting100Jul200Oct300Jan 2007400Apr500600JulOct700800Jan 2008Days after groutingFig. 16. Development of temperature in the short pieces during the measurement periodchanges in the pile pieces are the results of hydration effects,temperature 共thermal-expansion difference兲, and swelling, occurring more or less simultaneously. It is, of course, desirable toquantify and separate the three effects.Shrinkage of the concrete will start very early after the casting.During the hydration, free water will chemically bond to the cement grains, which results in chemical shrinkage. Some waterwill also leave the mix by drying at the surface, resulting in drying shrinkage and, for the PHC pile, the concrete cylinder will robthe grout of some water. Drying and wetting will result in strainchanges in addition to those caused by the temperature changes.When concrete cures under water, such as when placed below thegroundwater table, as in the case of the subject full-scale piles,drying in the sense of evaporation of water to the outside does notoccur. Instead, both the PHC concrete wall and the grout willabsorb water from the surrounding saturated soil, which will result in swelling of the pile.In the case of the short pile pieces, no water was absorbedduring the curing, as the pieces were above the ground. Then,when the pieces were submerged, swelling occurred.The vibrating wire sister-bar strain-gauge is usually, as in thecurrent application, embedded in concrete or grout, whosethermal coefficient is different from that of steel. Therefore,when the temperature increases 共or reduces兲, the differentialexpansion 共or contraction兲 of the rebar and the concrete resultsin shear forces developing along the rebar and a strain change100400503500300CHANGE OF STRAIN (µε)CHANGE OF STRAIN (µε)Unrestrained-50-100-150SHORTENING G LENGTHENINGOF THE PHC Piece-300(a)E002006 AprA100Jul200Oct300Jan 2007400Apr500JulDays after Grouting600Oct700Jan 200880002006 AprA(b)100Jul200Oct300400Jan 2007Apr500600700JulOctJan 2008800Days after GroutingFig. 17. Development of average rebar strain in the short pieces during the measurement periodJOURNAL OF GEOTECHNICAL AND GEOENVIRONMENTAL ENGINEERING ASCE / NOVEMBER 2009 / 1591
Average Gage rature (degree)1600122436486072Time (h)Fig. 18. Variation of temperature 共 C兲 during the study of gaugetemperature sensitivityoccurs, as expressed in Eq. 共1兲 共Geokon Inc. 1986; Dunnicliff1988兲. corrected 共R1 R0兲C 共T1 T0兲 共1兲The thermal-expansion coefficient of steel is 12 / C. However, the thermal-expansion coefficient of concrete varies widely.For cement paste, it ranges from about 18– 30 / C, when thewater/cement ratio ranges from about 0.4–0.6 共Mindess et al.1999兲. Powers 共1968兲 indicated that the thermal coefficient ofcement paste is 11 / C. According to Mindess et al. 共1999兲,the thermal-expansion coefficient of concrete aggregates variesdepending on the mineralogical composition of the aggregates.For example, the coefficient of quartz is 12 / C and for limestone, it is about a mere 6 / C. Powers 共1968兲 indicated thatthe coefficient for a particular aggregate can vary by an order ofmagnitude and emphasized that a plain mineralogical descriptioncannot be used to predict the thermal coefficient, that the thermalexpansion difference coefficients between paste and aggregates“are almost never alike” and that the coefficients will vary withthe degree of saturation of the concrete. The variations andranges, notwithstanding, is commonly assumed that the thermalexpansion coefficient of concrete is 10 / C and that, therefore, the thermal-expansion difference coefficient between steeland concrete is 2 / C. The manufacturer’s recommendedvalue is 2.2 / C 共Geokon Inc. 1986兲, i.e., concrete expandsand contracts at a rate slightly smaller than that of the rebar. Thecoefficient of a cement-paste grout could be both larger andsmaller than that of steel, i.e., the thermal-expansion differencecoefficient could be negative. Most likely, the concrete wall of thePHC pile, making up half the volume of the PHC short piece, hasa somewhat disparate thermal-expansion coefficient as opposed tothe cement-paste grout making up
Figs. 2-4 show the development of temperature and strain re-corded at eight gauge levels in the Shinho O-cell pile. The values shown are from the two gauge pairs #12 placed 1 m below the pile head at the ground surface and from single gauge pairs #11, #10, #9, #8, and #2 placed at depths of 4, 9, 14, 19, and 49 m, respectively.