Transcription
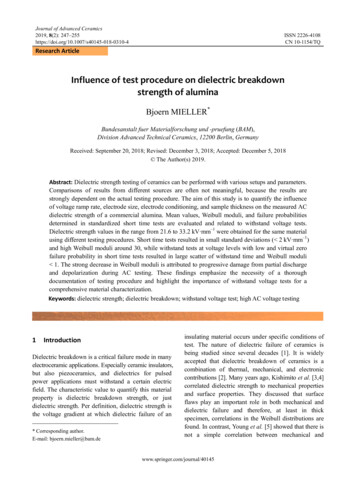
Wednesday 2017/12/0615:00Building 101, Portrait RoomDC Voltage Breakdown of Relied Upon Insulator Materials:Test Method Development and Results From ArtificiallyWeathered SpecimensDavid C. Miller1, Bernt Åke-Sultan2, Axel Borne3, Joshua J. Eafanti1, Rene Eugen4,Bradley L. Givot5, Jürgen Jung6, Trevor Lockman1, Steven W. MacMaster7, Byron K.McDanold1, Ulf H. Nilsson2, Nancy H. Phillips7, Ian A. Tappan1, and Nick S. Bosco11NationalRenewable Energy Laboratory (NREL), 15013 Denver West Parkway, Golden, CO 80401, USAAB, 44486 Stenungsund, Sweden3DuPont Photovoltaic and Advanced Materials, Meyrin, Switzerland4Isovoltaic AG, Isovoltaicstraße 1, Lebring, Austria, 84035The 3M Company, 3M Center, 201-BW-03, St. Paul MN 55144 USA6Agfa-Gevaert NV, Septestraat 27, Mortsel, Belgium 26407DuPont Photovoltaic Solutions, Wilmington, DE, USA2Borealis
Overview Background-PV backsheets.-Related & developing PV standards.-Hydro- and UV- degradation of PET. Interlaboratory precision study-Goal: verify repeatability & reproducibility-What critical factors in the experiment were affecting precision? Artificial weathering screen test-35 out of 55 materials.-Focus on 7 BS’s of interest. Summary-Per study2
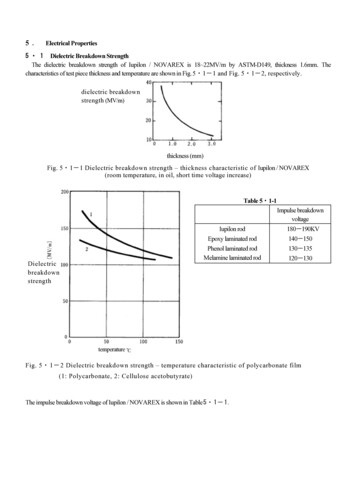
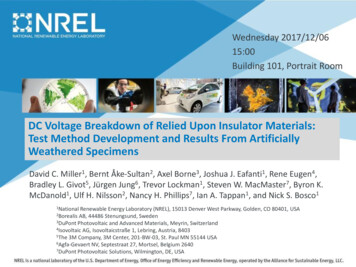
PV backsheets PV backsheets typically consist of laminated polymer sheets. Traditional (benchmark) BS: “TPE”.EXAMPLEMATERIAL THICKNESS LOCATIONPURPOSE{mm}TVF17airUV protectionPET250coreelectrical insulationEVA125celladhesion to encapsulationExample of a TPE backsheet product.Madico PORTEKT product literature.Geretschläger et. al., SOLMAT, 2016. Recent BS polymer materials:poly(ethylene terephthalate) (PET, UV-stabilized)high density PET (PPE, UV-stabilized)polyvinylidene difluoride (PVDF)tetrafluoroethylene (TFE) and vinyl (PTFE)tetrafluoroethylene, hexafluoropropylene, and vinylidene fluoride laminate (THV)polyamide (PA) PET:Semicrystalline, oreinted, condensation-cured polymer.(machine- and traverse- directional anisotropy.)Tg 75 C; Tm 260 C.Molecular structure of polymer repeat unit for PET.https://en.wikipedia.org/wiki/Polyethylene terephthalate3
Standards Related Motivation for Breakdown Voltage TestIEC 61730-1 ed. 2 Electrical insulation is a key safety requirements for RUI’s (backsheets & edge seals). IEC 61730-1 ed. 2 (2016) now specifies the strength of insulating materials: 2 kV 4 Vsys.Example: 8 kV VBD required for a Class II 1.5 kV system.Breakdown Voltage Test (IEC TS 62788-2, Annex C) A DC breakdown voltage (VBD) test is part of IEC TS 62788-2 (frontsheets & backsheets). VBD test replaces the unpopular AC “Partial Discharge” test. Interlaboratory study was conducted to develop and quantify the precision of the VBD test.-Miller et. al., Proc IEEE PVSC, 2017.IEC 61730 ed. 2 Amendment 1 Amendment to 61730-1 is presently considering adding a UV weathering requirement forRelied Upon Insulators. The Amendment project team is considering the EtB characteristic, with a pass/fail criteria. The pass/fail criteria was recently debated. Example: of 50% from RTI/RTE. Starting point, but no have a strong technical basis. Mechanical tensile test to identify cracking, not electrical insulation. The weatherability of VBD for backsheets is unexplored. The VBD of veteran materials is unexplored.4
Hydrolysis of PET Mechanism: de-esterfication (random scission) of main chain. Arrhenius model valid for at least 65 C T 95 C (module Tmax). Second order dependence on %RH.dP Ea n-1 cexpRH ln[c1] 39.3; Ea 129 kJ mol ; n 2. RT dt 1 H2O concentration in Damp Heat (85 C/85 %RH) greatly exceeds terrestrialenvironment & recent artificial weathering method(s). Rate analysis: significantly less hydrolysis is expected in artificial weathering(IEC TS 62788-7-2) relative to Damp Heat.RELATIVERATE OFHYDROLYSIS{%}0.020.10.41.65.5H2O concentration: the terrestrial environment is compared tosome present IEC PV artificial accelerated aging tests.IEC TESTT%RHSTANDARD{ C} {%}AND(CONDITION)452062788-7-2 (A1)552062788-7-2 (A2)652062788-7-2 (A3)752062788-7-2 (A4)852062788-7-2 (A5)61730-2 (MST 53)858510061215-2 (MQT 13)37660.08Bangkok, hot dayRelative rate analysis for Arrhenius model for somepresent IEC PV artificial accelerated aging tests.5
UV Degradation of PET Mechanism: de-esterfication (random scission) of main chain. O2 inhibits cross-linking, effects products species via hydroperoxide chemistry.With O2: fluorescence ( x 340 nm, m 460 nm).With O2: “masked” m (O2 consumed with volatile & non volatile products).With O2: majority of damage for 315 nm.No O2 (well behind cell or in thick sample): greatest discoloration ( YI).UV, always: formation carboxyl “acid” (end groups).Hydrolysis: chemicrystallization. . Increased optical haze.PET degradation (UV & hydrolysis): Manifest as mechanical damage (embrittlement: cracks; spalling; voids). Catalyzed by:metal ions (from residual catalyst or soil)formulation additives or residuals from manufactureacid/base chemistry (hydrolysis)self-catalyzed (carboxyl end groups, e.g., for hydrolysis)6
About the Interlaboratory VBD Precision StudyBacksheet material specimens (5 cm x 5 cm x thickness size).-polyethylene terephthalate (PET, 2 thicknesses),-polyvinyl fluoride (PVF),-PVF/PET/PVF backsheet product (“TPT”).Encapsulant material specimens (unlaminated no microvoids; no surface texture):-poly(ethylene-co-vinyl acetate) (EVA), unformulated (no residuals or additives)-polyvinyl butyral (PVB)Test is performed in a dielectric medium (e.g., transformer oil) to prevent flashoverand limit corona discharge.-IEC 60296 is more stringent than ASTM D3487.-Different medium products (IEC or ASTM certified) are available in different regions.Analysis/result: median of the five replicate specimens; in cases where any of theresults varied by more than 15% of the average, five additional replicates were tested.The dielectric strength was then determined from the median of the 10 replicates.-Miller et. al., Proc IEEE PVSC, 2017.7
Results of the IEC 62788-2 Interlaboratory ExperimentResults of VBD R-R: The median VBD is given 2S.D for each participant. r 10 kV; R 15 kV. VBD PET (0.15 mm) 100 kV (lab 4); some results 100 kV (lab 5); 56 kV (avg, all other labs). NREL wanted to confirm the validity of test results prior to subsequent experiments Possible factors:specimen thickness, multiple defect populations, # replicate specimens, sample conditioning,dielectric medium (oil), electrode roughness, unequal electrodes. Additional factors (not explored this presentation):maximum current limit, rate of voltage rise, test polarity, ambient test temperature.8
Results of the Interlaboratory Experiment (Continued)h & k analysis of VBD R-R Lab 0 was censored because it approached/exceeded the lower h limit for all materials. Low VBD for lab 0 attributed to fluorinert fluid as dielectric medium ( dielectric specimen). Results lab 4 at boundary for between-lab variability for several materials. Contributing factors: multiple defect populations; small sample size. Results lab 5 exceeded within lab variability for 1 material. Multiple defect populations observed for PET.9
Conclusions From the Interlaboratory Study Intralaboratory repeatability (r) was on the order of 10 kV (or 25%). Interlaboratory reproducibility (R) was on the order of 15 kV (or 30%) . Precision should improve for the final test method because at least 10 replicates will berequired, rather the five replicates as examined in the round-robin. Factors including:-number of replicate specimens (affecting on the order of 3%)-specimen conditioning ( 25 kV out of 55 kV for TPT)-dielectric medium ( 5 kV out of 55 kV for TPT)were found to readily effect test results effect on h. Multiple defect populations were only found to be present in PET materials. 100 vs. 60 kV? Specimen thickness and electrode surface roughness did not significantly affect this study. Some refinement of the published 62788-2 test method resulted from this study, including:-10 replicate specimens shall be used-only transformer oil or mineral oil is allowed as a dielectric medium;-use of oil qualified to ASTM D3487 may be used in addition to IEC 60296-use of unequal diameter electrodes is not allowed.-Miller et. al., Proc IEEE PVSC, 2017.10
About the Artificial Weathering Screen TestBacksheet specimens (5 cm x 5 cm x thickness size).-35 white, black, or transparent products.-Products with layers including: Al, EVA, PA, PET, PPE, PVDF, PVF, PTFE, thin film coating.-Composition of outer layers verified using FTIR.- 10 replicates each of:Unaged and artificially weathered (IEC TS 62788-7-2, A3 for 2000 hours) specimens.-Specimens conditioning per ISO 527 using a saturated Mg(NO3)2 solution.Test performed per IEC TS 62788-2 Annex C.-Mobil Univolt N61B transformer oil (ASTM D3487).Analysis/results: Weibull analysis of 10 replicates per IEC 62539.-90% confidence intervals for and Asses variability of each specimen set.Asses degradation from weathering.-Good guidance on identification & treatment of outliers.Failure analysis: focus on 7 representative results. Correlate with other characteristics.TPE-1, TPE-3, TAPE, PET-1, PA, TPT-1, TPT-311
VBD Results Will Be Compared To:Mechanical (mandrel bend ) test. Does cracking follow from just weathering or weathering mechanical stress? 1.5 cm x 8 cm sheet specimens. Weathered in 250 h increments up to 4000 h cumulative. 6.35 mm stainless steel rod 5% mechanical strain for 300 mm thick BS.Kempe et. al., Proc. IEEE PVSC, 2017. FTIR.-Look for overt change in chemistry.-ZnSe ATR crystal.-Data normalized to maximum intensity from 4000 cm-1 to 600 cm-1. Optical microscopy.-Look for cracks, roughness, delamination.-Air- and sun-surfaces, sides, cross-sections.12
General Results Screen Test StudyUNAGEDCHANGE(FINAL - INITIAL)WEATHERED , , , , , , teristicCharacteristic Characteristic(Shorthand)ModulusModulusModulusV BD{kV}V BD{kV}V BD{kV}V 547-48-50 100 34-50-8551-54-5773-76-78 -21474717-3-118-2-12-6?FAE-2VBD results for materials tested todate. The Weibull scale and shapeparameters are given for 90%confidence interval. 24 materials shown here. 11 remain to be tested. VBD reduced 50% after 2000h IEC TS 62788-7-2 A3 (red backsheets). VBD reduced 25% (orange backsheets).13
TPE-1 & TPE-3: Greatly Reduced Voltage With Cracking of the E-Layer Major ( 10%) new peaks as well as peakbroadening observed in FTIR for sun side (EVA). Cracking of sun side observed from weathering. Cracking may largely follow from the -film onlyspecimen geometry.TPE-1: Failure wasobserved to interactwith cracks on the sunside. Similarinteraction may nothave occurred for TPE3.TPE-3: Overlay of FTIR spectrum for sun side (EVA).Notable changes are identified with an arrow.FTIR-ATR: Spectrum AnalysisA, Absorptance {arbitrary units} VBD both materials exceeds 50%.(Unaged & weathered BS’s statistically distinct).1.0sun, unaged0.8sun, aged0.60.40.20.04000350030002500200015001000w, Wavenumbers {cm-1}TPE-3: Overlay of test results; the90% confidence intervals areshown for the unaged (U) andweathered (W) specimens.14500
TAPE: Different Electrical (VBD) and Mechanical (Bend) Performance VBD 37%, with significant variabilityfor weathered specimens. Major new peaks as well as peakbroadening observed in FTIR forsun side (EVA). Similar to TPE’s. Macroscopic cracking of sun sideobserved, with microscopic cracking of airside both only after bend test.TAPE: Cracking observed for the sun side (EVA) isshown in a microscopy image of the surface.TAPE: Overlay of test results; the 90% confidence intervals areshown for the unaged (U) and weathered (W) specimens.TAPE: Cracking observed for the air side (PVF) isshown in a microscopy image of the surface.15
PET-1: Researched Core Material Minor new peaks in FTIR for monolithic material,air & sun side. Ratio at 3290 cm-1/2970 cm-1 (-OH/C-H) may beused to assess carboxyl end group formation. Cracking observed after weathering. Modest discoloration (YI) fromweathering; enhanced by dielectric oil.PET-1: Overlay of FTIR spectrum for sun side (PET).Key features are identified with an arrow.FTIR-ATR: Spectrum Analysis0.070A, Absorptance {arbitrary units} VBD 30% for weathered specimens.0.065air, unaged0.060air, 03400330032003100300029002800w, Wavenumbers {cm-1}PET-1: Cracking isshown in a microscopyimage of a bend testspecimen.PET-1: Overlay of test results; the90% confidence intervals areshown for the unaged (U) andweathered (W) specimens.162700
PA: Known Problematic Material Major and minor changes observed, bothintensity changes and new peaks. Similar changes on air (PA) and sun (PA) surfaces. Micro-scale cracking of air surfaceobserved only after bend test.PA: Crackingobserved for the airside (PA) is shown ina microscopy imageof the surface.PA: Overlay of FTIR spectrum for air side (PA).Some key features are identified with an arrow.FTIR-ATR: Spectrum AnalysisA, Absorptance {arbitrary units} VBD 13% for weathered specimens.1.0air, unaged0.8air, 00900w, Wavenumbers {cm-1}PA: Overlay of test results; the90% confidence intervals areshown for the unaged (U) andweathered (W) specimens.17800
TPT-1: Different Electrical (VBD) and Mechanical (Bend) PerformanceTPT-1: Overlay of FTIR spectrum for sun side (EVA).Notable changes are identified with an arrow. Changes in peak intensity observed in FTIR forair side (PVF). Cracking of air side observed only after bend test.Macro-damage: transferred to PVF from PET core.Micro-scale cracking: air side.FTIR-ATR: Spectrum Analysis0.40A, Absorptance {arbitrary units} VBD unknown (all values 100 kV forunaged & weathered specimens).0.350.30air, unagedair, aged0.250.200.150.100.050.001800 1700 1600 1500 1400 1300 1200 1100 1000900800w, Wavenumbers {cm-1}TPT-1: Cracking observed for the air side (PVF) is shown in a TPT-1: Cracking observed for the air side (PVF) isside-microscopy image of the surface and edge.shown in a microscopy image of the surface.18700
TPT-3: PV Industry Benchmark Material Changes in peak intensity observed in FTIR forair side (PVF). Cracking of air side (PVF) observed inmicroscope, only after bend test.TPT-3: Overlay of FTIR spectrum for sun side (EVA).Notable changes are identified with an arrow.FTIR-ATR: Spectrum Analysis0.50A, Absorptance {arbitrary units} Minor effect of weathering is suggested.(not outside 90% confidence bounds).0.450.40air, unagedair, aged0.350.300.250.200.150.100.050.001800 1700 1600 1500 1400 1300 1200 1100 1000TPT-3: Crackingobserved for the air side(PVF) is shown in amicroscopy image ofthe surface.900w, Wavenumbers {cm-1}TPT-3: Overlay of test results;the 90% confidence intervalsare shown for the unaged (U)and weathered (W) specimens.19800700
Summary of the Screen Test Large VBD sometimes observed. Specimens examined all exceed VBD of 8 kV for a RUI.-May be possible to reduce BS thickness (and module cost). Cracking did not always correspond to VBD.-Use test sequence: weathering mechanical electrical? Improvement of diagnosis and acceptance “limits” for cracking are warranted. Measureable decrease in VBD observed for some materials warrants additional study:-Degradation & failure mechanisms.-Specimen geometry used for weathering.-Degradation as function of cumulative radiant exposure.-VBD as a function of ambient temperature.-Artificial-weathering and -abrasion ING &CRACKINGMANDREL TEST).(WEATHERINGSCALE:ONLY)SURFACE (MATERIAL)OVERTV BDINTERACTIONAT CRACKS?MAJOR MINOR MAJOR MINORCHANGE CHANGE CHANGE CHANGE( 10%) ( 10%) ( 10%) ( 10%)1TPE-1-76large V BD dropmacro: sun side (EVA)YYNYYY3TPE-3-54large V BD dropYPOSSIBLENYYY-37large V BD dropmacro: sun side (EVA)macro: sun side (EVA)micro: air side Y6Summary of the testresults for the 7representative materials. ,WeibullscaleMATERIAL(Shorthand) parameterV BD{%}FITR, AIR SURFACE FTIR, SUN SURFACE22561640TAPEPET-1PA-30-13large V BD dropknown bad materialTPT-1?TPT-3-3V BD 100 kVcracked in mandrel testliterature benchmarkmacro:bulk (monolithic PET)micro: air side (PA)macro:core air side (PVF)micro: air side (PVF)micro: air side (PVF)20
Acknowledgements Thanks to Dr. Chris Antunes, Dr. Mike Kempe, John Baker,Nathan Mitchell at NREL.This work was supported by the U.S.Department of Energy under ContractNo. DE-AC36-08-GO28308 with theNational Renewable Energy Laboratory. Your questions and feedback aremuch appreciated! Please help meto cover the important details &perspectives.NREL STM campus, Dennis Schroeder21
Breakdown Voltage Test (IEC TS 62788-2, Annex C) A DC breakdown voltage (V BD) test is part of IEC TS 62788-2 (frontsheets & backsheets). V BD test replaces the unpopular AC "Partial Discharge" test. Interlaboratory study was conducted to develop and quantify the precision of the V BD test. IEC 61730 ed. 2 Amendment 1