Transcription
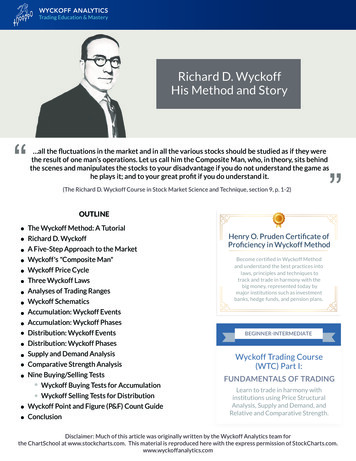
Richard D. WyckoffHis Method and Story““ all the fluctuations in the market and in all the various stocks should be studied as if they werethe result of one man’s operations. Let us call him the Composite Man, who, in theory, sits behindthe scenes and manipulates the stocks to your disadvantage if you do not understand the game ashe plays it; and to your great profit if you do understand it.(The Richard D. Wyckoff Course in Stock Market Science and Technique, section 9, p. 1-2)OUTLINEThe Wyckoff Method: A TutorialRichard D. WyckoffA Five-Step Approach to the MarketWyckoff's "Composite Man"Wyckoff Price CycleThree Wyckoff LawsAnalyses of Trading RangesWyckoff SchematicsAccumulation: Wyckoff EventsAccumulation: Wyckoff PhasesDistribution: Wyckoff EventsDistribution: Wyckoff PhasesSupply and Demand AnalysisComparative Strength AnalysisNine Buying/Selling TestsWyckoff Buying Tests for AccumulationWyckoff Selling Tests for DistributionWyckoff Point and Figure (P&F) Count GuideConclusionHenry O. Pruden Certificate ofProficiency in Wyckoff MethodBecome certified in Wyckoff Methodand understand the best practices intolaws, principles and techniques totrack and trade in harmony with thebig money, represented today bymajor institutions such as investmentbanks, hedge funds, and pension plans.BEGINNER-INTERMEDIATEWyckoff Trading Course(WTC) Part I:FUNDAMENTALS OF TRADINGLearn to trade in harmony withinstitutions using Price StructuralAnalysis, Supply and Demand, andRelative and Comparative Strength.Disclaimer: Much of this article was originally written by the Wyckoff Analytics team forthe ChartSchool at www.stockcharts.com. This material is reproduced here with the express permission of StockCharts.com.www.wyckoffanalytics.com
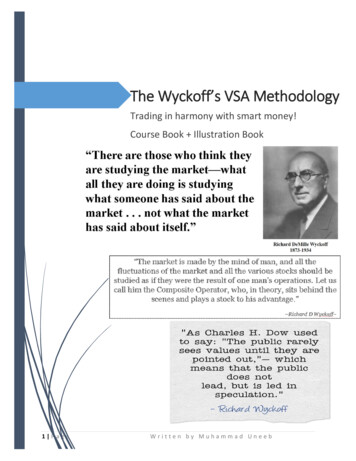
Richard Demille Wyckoff (1873–1934) was an early 20th-century pioneer in the technical approachto studying the stock market. He is considered one of the five “titans” of technical analysis, along with Dow,Gann, Elliott and Merrill. At age 15, he took a job as a stock runner for a New York brokerage.Afterwards, while still in his 20s, he became the head of his own firm. He also founded and, for nearly twodecades wrote, and edited The Magazine of Wall Street, which, at one point, had more than 200,000subscribers. Wyckoff was an avid student of the markets, as well as an active tape reader and trader. Heobserved the market activities and campaigns of the legendary stock operators of his time, including JPMorgan and Jesse Livermore. From his observations and interviews with those big-time traders, Wyckoffcodified the best practices of Livermore and others into laws, principles and techniques of tradingmethodology, money management and mental discipline.From his position, Mr. Wyckoff observed numerous retail investors being repeatedly fleeced.Consequently, he dedicated himself to instructing the public about “the real rules of the game” as played bythe large interests, or “smart money.” In the 1930s, he founded a school which would later become theStock Market Institute. The school's central offering was a course that integrated the concepts thatWyckoff had learned about how to identify large operators' accumulation and distribution of stock withhow to take positions in harmony with these big players. His time-tested insights are as valid today as theywere when first articulated.This article provides an overview of Wyckoff's theoretical and practical approaches to the markets,including guidelines for identifying trade candidates and entering long and short positions, analysis ofaccumulation and distribution trading ranges and an explanation of how to use Point and Figure charts toidentify price targets. Although this article focuses exclusively on stocks, Wyckoff's methods can beapplied to any freely-traded market in which large institutional traders operate, including commodities,bonds and currencies.A Five-Step Approach to the MarketThe Wyckoff Method involves a five-step approach to stock selection and trade entry, which can be summarizedas follows:1Determine the present position and probable future trend of the market.Is the market consolidating or trending? Does your analysis of market structure, supply anddemand indicate the direction that is likely in the near future? This assessment should help youdecide whether to be in the market at all and, if so, whether to take long or short positions. Useboth bar charts and Point and Figure charts of the major market indices for Step 1.2Select stocks in harmony with the trend.In an uptrend, select stocks that are stronger than the market. For instance, look for stocks thatdemonstrate greater percentage increases than the market during rallies and smaller decreasesduring reactions. In a downtrend, do the reverse – choose stocks that are weaker than the market.If you are not sure about a specific issue, drop it and move on to the next one. Use bar charts ofindividual stocks to compare with those of the most relevant market index for Step 2.Disclaimer: Much of this article was originally written by the Wyckoff Analytics team forthe ChartSchool at www.stockcharts.com. This material is reproduced here with the express permission of StockCharts.com.www.wyckoffanalytics.com
3Select stocks with a “cause” that equals or exceeds your minimum objective.A critical component of Wyckoff's trade selection and management was his unique method ofidentifying price targets using Point and Figure (P&F) projections for both long and short trades. InWyckoff's fundamental law of “Cause and Effect,” the horizontal P&F count within a trading rangerepresents the cause, while the subsequent price movement represents the effect. Therefore, if youare planning to take long positions, choose stocks that are under accumulation or re-accumulationand have built a sufficient cause to satisfy your objective. Step 3 relies on the use of Point andFigure charts of individual stocks.4Determine the stocks' readiness to move.Apply the nine tests for buying or for selling (described below). For instance, in a trading range aftera prolonged rally, does the evidence from the nine selling tests suggest that significant supply isentering the market and that a short position may be warranted? Or in an apparent accumulationtrading range, do the nine buying tests indicate that supply has been successfully absorbed, asevidenced further by a low-volume spring and an even lower-volume test of that spring? Use barcharts and Point and Figure charts of individual stocks for Step 4.5Time your commitment with a turn in the stock market index.Three-quarters or more of individual issues move in harmony with the general market, so youimprove the odds of a successful trade by having the power of the overall market behind it. SpecificWyckoff principles help you anticipate potential market turns, including a change of character ofprice action (such as the largest down-bar on the highest volume after a long uptrend), as well asmanifestations of Wyckoff's three laws (see below). Put your stop-loss in place and then trail it, asappropriate, until you close out the position. Use bar and Point and Figure charts for Step 5.Wyckoff's "Composite Man"Wyckoff proposed a heuristic device to help understand price movements in individual stocks and themarket as a whole, which he dubbed the “Composite Man.”““ all the fluctuations in the market and in all the various stocks should be studied as if theywere the result of one man’s operations. Let us call him the Composite Man, who, intheory, sits behind the scenes and manipulates the stocks to your disadvantage if you donot understand the game as he plays it; and to your great profit if you do understand it.(The Richard D. Wyckoff Course in Stock Market Science and Technique, section 9, p. 1-2)Disclaimer: Much of this article was originally written by the Wyckoff Analytics team forthe ChartSchool at www.stockcharts.com. This material is reproduced here with the express permission of StockCharts.com.www.wyckoffanalytics.com
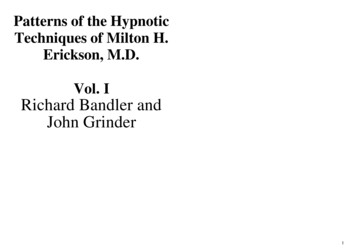
Wyckoff advised retail traders to try to play the market game as the Composite Man played it. In fact, heeven claimed that it doesn't matter if market moves “are real or artificial; that is, the result of actualbuying and selling by the public and bona fide investors or artificial buying and selling by larger operators.”(The Richard D. Wyckoff Method of Trading and Investing in Stocks, section 9M, p. 2)Based on his years of observations of the market activities of large operators, Wyckoff taught that:The Composite Man carefully plans, executes and concludes his campaigns.The Composite Man attracts the public to buy a stock in which he has already accumulated a sizeableline of shares by making many transactions involving a large number of shares, in effect advertising hisstock by creating the appearance of a “broad market.”One must study individual stock charts with the purpose of judging the behavior of the stock and themotives of those large operators who dominate it.With study and practice, one can acquire the ability to interpret the motives behind the action that achart portrays. Wyckoff and his associates believed that if one could understand the market behaviorof the Composite Man, one could identify many trading and investment opportunities early enough toprofit from them.Wyckoff Price CycleAccording to Wyckoff, the market can be understood and anticipated through detailed analysis of supplyand demand, which can be ascertained from studying price action, volume and time. As a broker, he was ina position to observe the activities of highly successful individuals and groups who dominated specificissues; consequently, he was able to decipher, via the use of what he called vertical (bar) and figure (Pointand Figure) charts, the future intentions of those large interests. An idealized schematic of how heconceptualized the large interests' preparation for and execution of bull and bear markets is depicted inthe figure below. The time to enter long orders is towards the end of the preparation for a price markup orbull market (accumulation of large lines of stock), while the time to initiate short positions is at the end ofthe preparation for price markdown.Disclaimer: Much of this article was originally written by the Wyckoff Analytics team forthe ChartSchool at www.stockcharts.com. This material is reproduced here with the express permission of StockCharts.com.www.wyckoffanalytics.com
Three Wyckoff LawsWyckoff's chart-based methodology rests on three fundamental “laws” that affect many aspects of analysis. Theseinclude determining the market's and individual stocks' current and potential future directional bias, selecting thebest stocks to trade long or short, identifying the readiness of a stock to leave a trading range and projecting pricetargets in a trend from a stock’s behavior in a trading range. These laws inform the analysis of every chart and theselection of every stock to trade.Wyckoff Price Cycle312The law of supply anddemand determines theprice directionThe law of causeand effectThe law of effortThis principle is central toWyckoff's method of tradingand investing. When demandis greater than supply, pricesrise, and when supply isgreater than demand, pricesfall. The trader/analyst canstudy the balance betweensupply and demand bycomparing price and volumebars over time. This law isdeceptively simple, butlearning to accuratelyevaluate supply and demandon bar charts, as well asunderstanding theimplications of supply anddemand patterns, takesconsiderable practice.It helps the trader andinvestor set price objectivesby gauging the potentialextent of a trend emergingfrom a trading range.Wyckoff's “cause” can bemeasured by the horizontalpoint count in a Point andFigure chart, while the“effect” is the distance pricemoves corresponding to thepoint count. This law'soperation can be seen as theforce of accumulation ordistribution within a tradingrange, as well as how thisforce works itself out in asubsequent trend ormovement up or down. Pointand Figure chart counts areused to measure a cause andproject the extent of itseffect. (See “Point and FigureCount Guide” below for anillustration of this law.)It helps the trader andinvestor set price objectivesby gauging the potentialextent of a trend emergingfrom a trading range.Wyckoff's “cause” can bemeasured by the horizontalpoint count in a Point andFigure chart, while the“effect” is the distance pricemoves corresponding to thepoint count. This law'soperation can be seen as theforce of accumulation ordistribution within a tradingrange, as well as how thisforce works itself out in asubsequent trend ormovement up or down. Pointand Figure chart counts areused to measure a cause andproject the extent of itseffect. (See “Point andFigure Count Guide” belowfor an illustration of thislaw.)Disclaimer: Much of this article was originally written by the Wyckoff Analytics team forthe ChartSchool at www.stockcharts.com. This material is reproduced here with the express permission of StockCharts.com.www.wyckoffanalytics.com
Analyses of Trading RangesOne objective of the Wyckoff method is to improve market timing when establishing a position inanticipation of a coming move where a favorable reward/risk ratio exists. Trading ranges (TRs) are placeswhere the previous trend (up or down) has been halted and there is relative equilibrium between supplyand demand. Institutions and other large professional interests prepare for their next bull (or bear)campaign as they accumulate (or distribute) shares within the TR. In both accumulation and vdistributionTRs, the Composite Man is actively buying and selling - the difference being that, in accumulation, theshares purchased outnumber those sold while, in distribution, the opposite is true. The extent ofaccumulation or distribution determines the cause that unfolds in the subsequent move out of the TR.Wyckoff SchematicsA successful Wyckoff analyst must be able to anticipate and correctly judge the direction and magni
Wyckoff Trading Course (WTC) Part I: FUNDAMENTALS OF TRADING BEGINNER-INTERMEDIATE Henry O. Pruden Certificate of Proficiency in Wyckoff Method Become certified in Wyckoff Method and understand the best practices into laws, principles and techniques to track and trade in harmony with the big money, represented today by