Transcription
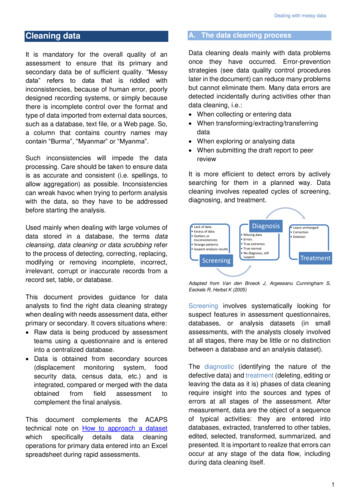
Dealing with messy dataCleaning dataA. The data cleaning processIt is mandatory for the overall quality of anassessment to ensure that its primary andsecondary data be of sufficient quality. “Messydata” refers to data that is riddled withinconsistencies, because of human error, poorlydesigned recording systems, or simply becausethere is incomplete control over the format andtype of data imported from external data sources,such as a database, text file, or a Web page. So,a column that contains country names maycontain “Burma”, “Myanmar” or “Myanma”.Data cleaning deals mainly with data problemsonce they have occurred. Error-preventionstrategies (see data quality control procedureslater in the document) can reduce many problemsbut cannot eliminate them. Many data errors aredetected incidentally during activities other thandata cleaning, i.e.: When collecting or entering data When transforming/extracting/transferringdata When exploring or analysing data When submitting the draft report to peerreviewSuch inconsistencies will impede the dataprocessing. Care should be taken to ensure datais as accurate and consistent (i.e. spellings, toallow aggregation) as possible. Inconsistenciescan wreak havoc when trying to perform analysiswith the data, so they have to be addressedbefore starting the analysis.Used mainly when dealing with large volumes ofdata stored in a database, the terms datacleansing, data cleaning or data scrubbing referto the process of detecting, correcting, replacing,modifying or removing incomplete, incorrect,irrelevant, corrupt or inaccurate records from arecord set, table, or database.This document provides guidance for dataanalysts to find the right data cleaning strategywhen dealing with needs assessment data, eitherprimary or secondary. It covers situations where: Raw data is being produced by assessmentteams using a questionnaire and is enteredinto a centralized database. Data is obtained from secondary sources(displacement monitoring system, foodsecurity data, census data, etc.) and isintegrated, compared or merged with the dataobtainedfromfieldassessmenttocomplement the final analysis.This document complements the ACAPStechnical note on How to approach a datasetwhich specifically details data cleaningoperations for primary data entered into an Excelspreadsheet during rapid assessments.It is more efficient to detect errors by activelysearching for them in a planned way. Datacleaning involves repeated cycles of screening,diagnosing, and treatment. Lack of data Excess of data Outliers orinsconsistencies Strange patterns Suspect analysis resultsScreeningDiagnosis Missing data Errors True extremes True normal No diagnosis, stillsuspect Leave unchanged Correction DeletionTreatmentAdapted from Van den Broeck J, Argeseanu Cunningham S,Eeckels R, Herbst K (2005)Screening involves systematically looking forsuspect features in assessment questionnaires,databases, or analysis datasets (in smallassessments, with the analysts closely involvedat all stages, there may be little or no distinctionbetween a database and an analysis dataset).The diagnostic (identifying the nature of thedefective data) and treatment (deleting, editing orleaving the data as it is) phases of data cleaningrequire insight into the sources and types oferrors at all stages of the assessment. Aftermeasurement, data are the object of a sequenceof typical activities: they are entered intodatabases, extracted, transferred to other tables,edited, selected, transformed, summarized, andpresented. It is important to realize that errors canoccur at any stage of the data flow, includingduring data cleaning itself.1
Dealing with messy dataB. Sources of errorsMany of the sources of error in databases fall intoone or more of the following categories:Measurement errors: Data is generally intendedto measure some physical process, subjects orobjects, i.e. the waiting time at the water point, thesize of a population, the incidence of diseases,etc. In some cases these measurements areundertaken by human processes that can havesystematic or random errors in their design (i.e.,improper sampling strategies) and execution (i.e.,misuse of instruments, bias, etc.). Identifying andsolving such inconsistencies goes beyond thescope of this document. It is recommended torefer to the ACAPS Technical Brief How sure areyou? To get an empirical understanding of how todeal with measurement errors in general.Data entry error: "Data entry" is the process oftransferring information from the medium thatrecords the response (traditionally answerswritten on printed questionnaires) to a computerapplication. Data entry is generally done byhumans, who typically extract information fromspeech (i.e., key informant interviews) or by usingsecondary data from written or printed sources(i.e. health statistics from health centres). Undertime pressure, or for lack of proper supervision,data is often corrupted at entry time. Main errorstype include:Adapted from Kim et Al, 2003; Aldo Benini 2013 An erroneous entry happens if, e.g., age ismistyped as 26 instead of 25. Extraneous entries add correct, but unwantedinformation, e.g. name and title in a name-onlyfield. Incorrectly derived value occurs when afunction was incorrectly calculated for aderived field (i.e. error in the age derived fromthe date of birth). Inconsistencies across tables or files occure.g. when the number of visited sites in theprovince table and the number of visited sitesin the total sample table do not match.Processing errors: In many settings, raw data arepre-processed before they are entered into adatabase. This data processing is done for avariety of reasons: to reduce the complexity ornoise in the raw data, to emphasize aggregateproperties of the raw data (often with someeditorial bias), and in some cases simply toreduce the volume of data being stored. All theseprocesses have the potential to produce errors.Data integration errors: It is actually quite rare fora database of significant size and age to containdata from a single source, collected and enteredin the same way over time. Very often, adatabase contains information collected frommultiple sources via multiple methods over time(i.e. tracking of affected population numbers overthe crisis, where the definition of “affected” isbeing refined or changed over time). Moreover, inpractice, many databases evolve by merging inother pre-existing databases; this merging taskalmost always requires some attempt to resolveinconsistencies across the databases involvingdifferent data units, measurement periods,formats, and so on. Any procedure that integratesdata from multiple sources can lead to errors. Themerging of two or more databases will bothidentify errors (where there are differencesbetween the two databases) and create newerrors (i.e. duplicate records).Table 1 below illustrates some of the possiblesources and types of errors in a largeassessment, at three basic levels: When fillingthe questionnaire, when entering data into thedatabase and when performing the analysis.2
Dealing with messy dataTable 1: Sources of data errorStageC. First things firstSources of problemsLack or excess ofOutliers anddatainconsistenciesQuestionnaire Form missing Form double,collected repeatedly Answering box oroptions left blank More than oneoption selectedwhen not allowed Correct value filled outin the wrong box Not readable Writing error Answer given is out ofexpected (conditional)rangeDatabase Lack or excess ofdata transferred fromthe questionnaire Form of field notentered Value entered inwrong field Inadvertent deletionand duplicationduring databasehandling Outliers andinconsistencies carriedover fromquestionnaire Value incorrectlyentered, misspelling Value incorrectlychanged duringprevious data cleaning Transformation(programming) error Lack or excess ofdata extracted fromthe database Data extraction,coding or transfererror Deletions orduplications byanalyst Outliers andinconsistencies carriedover from thedatabase Data extraction, codingor transfer error Sorting errors(spreadsheets) Data-cleaning errorsAnalysisAdapted from Van den Broeck J, Argeseanu Cunningham S,Eeckels R, Herbst K (2005)Inaccuracy of a single measurement and datapoint may be acceptable, and related to theinherent technical error of the measurementinstrument. Hence, data cleaning should focus onthose errors that are beyond small technicalvariations and that produce a major shift within orbeyond the analysis. Similarly and under timepressure, consider the diminishing marginal utilityof cleaning more and more compared to otherdemanding tasks such as analysis, visual displayand interpretation. Understand when and how errors areproduced during the data flow. Prioritization is essential if the assessment isunder time pressures. Resources for datacleaning are limited. Errors related topopulation number, geo location, affectedgroups and date are particularly importantbecause they contaminate derived variablesand the final analysis. Know when to stop.The following sections of this document offer astep by step approach to data cleaning.The first thing to do is to make a copy of theoriginal data in a separate workbook and namethe sheets appropriately, or save in a new file.ALWAYS keep the source files in a separatefolder and change its attribute to READ-ONLY, toavoid modifying any of those files, even if it isopened for reference.D. Screening dataNo matter how data are collected (in inistered questionnaires, etc.), there will besome level of error, including a number ofinconsistencies. While some of these will belegitimate, reflecting variation in the context,others will likely reflect a data collection error.Examine data for the following possible errors: Spelling and formatting irregularities: are theycategorical variables written incorrectly? Aredate format consistent? Etc. Lack of data: Do some questions have farfewer answers than surrounding questions? Excess of data: Are there duplicate entries?Are there more answers than originallyallowed? Outliers/inconsistencies: Are there values thatare so far beyond the typical distribution thatthey seem potentially erroneous? Strange patterns: Are there patterns thatsuggest cheating rather than honest answers(i.e. several questionnaires with the exactsame answers)? Suspect analysis results: Do the answers tosome questions seem counterintuitive orextremely unlikely?Screening methods are not only statistical: Many outliers are detected by perceived nonconformity with prior expectations, based onthe analyst's experience, results fromsecondary data review, numerical constraintsor common sense (weight can’t be negative,people can’t have more than 2 parents,women can’t bear 35 children, male can’t bepregnant, etc.).3
Dealing with messy data Descriptive tools can be used to predefineexpectations, assumptions or criteria aboutnormal ranges, distribution shapes, andstrength of relationships. Comparison of thedata with the generated assumptions orcriteria can be partly automated (i.e.conditional formatting) and lead to flagging ofdubious data, patterns, or results.A particular problem is that of erroneous inliers,i.e., data points generated by error but fallingwithin the expected range. Erroneous inliers willoften escape detection. Detection approachesinclude: Viewing data in relation to other variables,using multivariate views, such as scatter plotsor heatmap. More advanced and resourceintensive techniques involves regressionanalysis or consistency checks. Examining the history of each data point or byre-measurement, however such examinationis rarely feasible. Instead, one can examineand/or re-measure a sample of inliers toestimate an error rate (i.e. contactingenumerators or key informants to askadditional questions).Useful screening methods are listed hereafter,from simpler to more complex: Browsing of data tables after sorting. Summary statistics. When time allows, validated data entry anddouble data entry. Printouts of variables not passing rangechecks and of records not passing consistencychecks. Frequency distributions and cross-tabulations. Graphical exploration of distributions: boxplots, histograms, and scatter plots usingvisual analysis software such as Tableaudesktop. Plots of repeated measurements on the sameindividual, i.e., growth curves. Checking of questionnaires using fixedalgorithms. Statistical outlier detection. In many if not most instances, data can onlybe cleaned effectively with some humaninvolvement. Know (and/or train datacleaners) common mistakes and what errorsto look for. Understanding properties of a dataset,including the identification and possiblerectification of errors, is closely linked toexploratorydataanalysisanddatavisualization. Choose the right error detection strategiesbased on the type of data screened:quantitative, categorical data, P-Codes, oridentifiers are subject to different errors type(i.e. misspelling for categorical variable) thatcalls for different detection approaches (spellcheck for misspelled categorical variable).E. Diagnosing dataFrom the screening phase, you have highlighteddata that needs investigation. To clarify suspectdata, you often must review all of a respondent’sanswers to determine if the data makes sensetaken in context. Sometimes you must review across-section of different respondents’ answers,to identify issues such as a skip pattern that wasspecified incorrectly.With this research complete, what is the truenature of the data that has been highlighted?Possible diagnoses for each data point are asfollows: Missing data: Answers omitted by therespondent (nonresponse), questions skippedover by the enumerator / the data entryoperator or dropout (when research isundertaken overtime such as schoolattendance). Errors: Typos or answers that indicate thequestion was misunderstood. True extreme: An answer that seems high butcan be justified by other answers (i.e., therespondent working 60 hours a week becausethey work a full-time job and a part-time job) True normal: A valid record. No diagnosis, still suspect: You may need tomake a judgment call on how to treat this dataduring the treatment phase.4
Dealing with messy dataSome data values are clearly logically orbiologically impossible (you cannot be 200 yearsold or -176cm). Hence, one may pre-define cutoffs for immediate diagnosis of error. Sometimesvalues fall in between acceptable ranges and thediagnosis will be less straightforward. In thesecases, it is necessary to apply a combination ofdiagnostic procedures: Go back to previous stages of the data flow tosee whether a value is consistently the same.This requires access to well-archived anddocumented data with justifications for anychanges made at any stage. Look for information that could confirm the trueextreme status of an outlying data point. Forexample, a very low score for weight-for-age(i.e., 6 Z-scores) might be due to errors in themeasurement of age or weight, or the subjectmay be extremely malnourished, in whichcase other nutritional variables should alsohave extremely low values. This type ofprocedure requires insight into the coherenceof variables in a biological or statistical sense.Again, such insight is usually available fromexperience or lessons learnt and can be usedto plan and program data cleaning. Collect additional information, i.e., questionthe enumerator about what may havehappened and, if possible or necessary,repeat the measurement. Such procedurescan only happen if data cleaning starts soonafter data collection, and sometimes remeasuring is only valuable very shortly afterthe initial measurement.The diagnostic phase is labour intensive and thebudgetary, logistical, time and personnelrequirements are typically underestimated oreven neglected at the design stage. Costs maybe lower if the data-cleaning process is plannedand starts early in data collection. Use common sense, experience, triangulationand lessons learnt to diagnose the type oferror. Design your questionnaire form carefully toallow cross checks between questions.F. Treatment of dataAfter identification of errors, missing values, andtrue (extreme or normal) values, analysts mustdecide what to do with problematic observations: Leave it unchanged: The most conservativecourse of action is to accept this data as a validresponse and make no change to it. The largeryour sample size, the less one suspectresponse will affect the analysis; the smalleryour sample size, the more difficult thedecision. Correct the data: If the respondent’s originalintent can be determined, then fix their answer(i.e. after discussing with the enumerator, it isclear that the ratings were reversed bymistake; you can invert each of the answers tocorrect the issue). Delete the data: The data seems illogical andthe value is so far from the norm that it willaffect descriptive or inferential statistics. Whatto do? Delete just this response or delete theentire record? Remember that whenever youbegin to toss out data, it raises the possibilitythat you are “cherry picking” the data to get theanswer you want. Alternatively, you can createa binary variable, 1 suspicious record, 0 notso and use this new variable as a record filterin Pivot tables or in-table filtering tounderstand the impact of potentially erroneousdata in your final results. Re-measure the suspect or erroneous values,if time and resources allows.There are some general rules to support thedecision: If the person doing the data entry has enteredvalues different from the ones in thequestionnaire, the value should be changed towhat was recorded in the questionnaire form.(I.e. the value in the questionnaire was 40,000and the data entry operator keyed in 4,000 – azero was left out). When variable values do not make sense, ifthere is no data entry error, and there are nonotes to help you determine where the errorcomes from, you must leave the data AS IT IS.The case should be listed as an outlier (i.e. byusing conditional formatting for instance), andthere is no justification for changing it. Extremevalues falling into this category must be5
Dealing with messy datahandled by the person who is analysing thedata. If you change the value because youthink you know what is “reasonable”, you arebiasing the data. When blank cases were inserted or the recordtype was required even though key informantsmay not have that type of data or duplicaterecords were entered, then cases must bedeleted from the data file. Impossible values are never left unchanged,but should be corrected if a correct value canbe found, otherwise they should be deleted.For biological continuous variables, somewithin-subject variation or small measurementvariation will always be present. If a remeasurement is done very rapidly after theinitial one and the two values are close enoughto be explained by variation alone, take theaverage of both as the final value.With true extreme values and with values that arestill suspect after the diagnostic phase, theanalyst should examine the influence of suchdata points, individually and as a group, onanalysis results before deciding whether or not toleave the data unchanged.Some authors have recommended that trueextreme values should always stay in theanalysis. In practice, many exceptions are madeto that rule. The investigator may not want toconsider the effect of true extreme values if theyresult from an unanticipated extraneous process.This becomes an “a posteriori” exclusioncriterion. The data points should be reported as“excluded from analysis” in the methodologychapter of the final report.Missing values require particular attention. This isnot a data issue like skewness or outliers that youcan just ignore (whether you are right or not). Thefirst thing is to decide which blank cells need tobe filled with zeros (because they representgenuine negative observations, such as ("no","not present", "option not taken", etc.) and whichto leave blank (if the convention is to use blanksfor missing or not applicable). Some analystsreplace blank cells with some explicit missingvalue code (if we want all missing to be explicitlycoded).What to do with those cells remaining blank?Missing values can be classified as either randomor non-random: Random missing values may occur becausethe subject inadvertently did not answer somequestions. The assessment may be overlycomplex and/or long, or the enumerator maybe tired and/or not paying attention, and missthe question. Random missing values mayalso occur through data entry mistakes. Ifthere are only a small number of missingvalues in your dataset (typically, less than5%), then it is extremely likely to be random. Non-random missing values may occurbecause the key informant purposefully did notanswer some questions (confusing orsensitive question, no appropriate choicessuch as “no opinion” or “not applicable”).The default option for dealing with missing valuesis filtering and excluding from analysis: Listwise / casewise deletion: cases that havemissing values on the variable(s) underanalysis are excluded. If you are onlyanalysing one variable, then listwise deletionis simply analysing the existing data. If you areanalysing multiple variables, then listwisedeletion removes cases if there is a missingvalue on any of the variables. Thedisadvantage is a loss of data because youare removing all data from cases who mayhave answered some of the questions, but notothers (e.g., the missing data). Pairwise deletion: All available data isincluded. Unlike listwise deletion whichremoves cases (subjects) that have missingvalues on any of the variables under analysis,pairwise deletion only removes the specificmissing values from the analysis (not theentire case). In other words, all available datais included. If you are conducting a correlationon multiple variables, this technique allow toconduct the bivariate correlation between allavailable data points, and ignore only thosemissing values if they exist on some variables.In this case, pairwise deletion will result indifferent sample sizes for each correlation.Pairwise deletion is useful when sample sizeis small or missing values are large becausethere are not many values to begin with, sowhy omit even more with listwise deletion.6
Dealing with messy dataTry conducting the same test using both deletionmethods to see how the outcome change. Notethat in these techniques, "deletion" meansexclusion within a statistical procedure, notdeletion (of variables or cases) from the dataset.A second option is to delete all cases with missingvalues. Thus, you are left with complete data forall cases. The disadvantage to this approach isyou reduce the sample size of your data, resultingin a loss of power and increased error inestimation (wider confidence intervals). If youhave a large dataset, then it may not be a bigdisadvantage because you have enough caseseven after the complete deletion. However, witha small dataset, the sample can be decimated,and results may be biased if missingness is nonrandom. Another disadvantage to this approachis that the subjects with missing values may bedifferent than the subjects without missing values(e.g., missing values that are non-random), soyou have a non-representative sample afterremoving the cases with missing values.Another option is to replace the missing values,called imputation (single or multiple). Thistechnique preserves all cases by replacingmissing data with a probable value based onother available information (i.e. the mean ormedian of other similar observed values). Onceall missing values have been imputed, the dataset can then be analysed using standardtechniques for complete data. However thismethod can also bias results and p-values.Recently and under certain conditions, maximumlikelihood approaches have also proven efficientto dealing with missing data.Detailing technicalities, appropriateness andvalidity of each techniques goes beyond thescope of this document. Ultimately, choosing theright technique depends on how much data aremissing (and why), patterns, randomness anddistribution of missing values, the effects of themissing data and how you will use the data inyour analysis. It is strongly recommended to referto a statistician if you face a small dataset withlarge quantities of missing values.Pragmatically, for needs assessment with fewstatistical resources, creating a copy of thevariable and replacing missing values with themean or median may often be enough andpreferable to losing cases in multivariate analysisfrom small samples.Also, answering somehow plausibly why data aremissing ("women could not be interviewed", “thelast questionnaire section could not be filled dueto lack of time”) may be much more informative toend user’s than a plethora of statistical fixes. Lookfor meaning in non-random missingness. Maybethe respondents are telling you somethingimportant by not answering one of the questions.Set up a dummy variable with value 0 for thosewho answered the question and value 1 for thosewho did not. Use this dummy variable as one ofthe predictors of the outcome variable.G. Recoding variablesYou may need to recode variables to create newones that fit your analytic needs. Recodingvariables is useful in multiple scenarios, such as: Formatting: date (day, month, and year), prefixes to create better sorting in tables,rounding (in continuous variables). Syntax: Translation, language style andsimplification. Recoding a categorical variable (e.g. ethnicity,occupation, an “other” category, spellingcorrections, etc.). Recoding a continuous variable (e.g. age) intoa categorical variable (e.g. age group). Combining the values of a variables into fewercategories (e.g. grouping all problems causedby access issues). Combining several variables to create a newvariable (e.g., building an index based on a setof variables). Defining a condition based on certain cut-offvalues (e.g., population “at risk” vs. “at acuterisk”). Changing a level of measurement (e.g. frominterval to ordinal scale).7
Dealing with messy dataConceptually, a distinction is needed between: Activities related to recoding “messy data” (i.e.an open question about interventionspreferred by the population) so they becomestructured or formatted in a way that is usefulfor primary analysis. Activities that include deriving new values outof others, such as creating calculation (i.e.percentage), parsing, merging, etc. Here, theanalyst is re-expressing what the data have tosay in other terms (i.e. re-expressing deviationas a % change, weighted or moving average,etc.). However, the data has (normally)already gone through a cleaning stage beforeto be transformed.Recoding variables or values can serve both thepurpose of cleaning dirty data and/ortransforming clean data. This section focusesprimarily on the cleaning objectives rather thanthe re-expression of values which will be tackledmore extensively in another chapter of thisdocument.Recoding categorical variables starts with a fulllisting of all variants used in a variable, togetherwith their frequencies. The variant list can becopied into a fresh sheet, to create a table ofvariants and their desired replacements.ALWAYS keep a copy of the original values, andtry out different recoding schemes before settlingon a final one.There are three ways to recode categorical data:collapse a categorical variable into fewercategories, break a categorical variable up intoseveral variables with fewer categories orcombine several categorical variables into fewervariables with more categories.Collapsing is done to combine categories thatlogically go together or to eliminate categoriesthat have small numbers of observations.Guidelines for collapsing data are as follows: Ordinal variables need to be collapsed in amethod that preserves the ordering ofcategories. Combine only categories that go together.Don't combine two logically distinct categoriesjust to eliminate categories with small numbers(e.g. lack of access due to lack of income andlack of access due to insecurity) asinterpretation of data becomes difficult ormeaningless. The way in which categories are collapsed caneasily affect the significance level of statisticaltests. Categories should be collapsed a priorito avoid the criticism that the data weremanipulated just to get a certain result. Thisdoes not mean you have to decide this beforeyou collect the data (if you did, you wouldn'tbother to collect separate categories). Do not oversimplify the data. Unnecessaryreduction in the number of categories mayreduce statistical power and obscurerelationships in the data. As a generalguideline, you should keep intact anycategories that include 10% or more of yourdata (or 5 cases, for very small samples).Breaking: There are several reasons for breakinga categorical variable into several smallervariables: Data was collected in a manner easy to collectto ease the burden of data collection on thesubject. For example, it is easier for the keyinformant to provide a list of issues than toreview a long list of problems. A variable may contain more than one"concept." For example, consider the ordinalvariable “severity” below:1.2.3.4.There are no shortagesA few people are facing shortagesMany people are facing shortagesShortages are affecting everyoneThis variable contains two concepts, “shortages”and “number of people affected”. It isstraightforward to code two new variables,shortages (0 no shortages, 1 shortage) andnumber of people (0 no people, I Few people,2 Many people, 4 All of them).Combining is the reverse process of breaking up,such as combining “shortages” and “number ofpeople” back into the variable “severity”.8
Dealing with messy dataMain techniques for transforming quantitativedata into another quantitative variable include: Lineartransformation(i.e.convertingtemperature from degrees Fa
data” refers to data that is riddled with inconsistencies, because of human error, poorly designed recording systems, or simply because there is incomplete control over the format and type of data imported from external data sources, such as a database, text file, or