Transcription
Machine Learning:Decision TreesCS540Jerry ZhuUniversity of Wisconsin-Madison[ Some slides from Andrew Moore http://www.cs.cmu.edu/ awm/tutorials and Chuck Dyer, with permission.]
x The input These names are the same: example, point,instance, item, input Usually represented by a feature vector– These names are the same: attribute, feature– For decision trees, we will especially focus ondiscrete features (though continuous features arepossible, see end of slides)
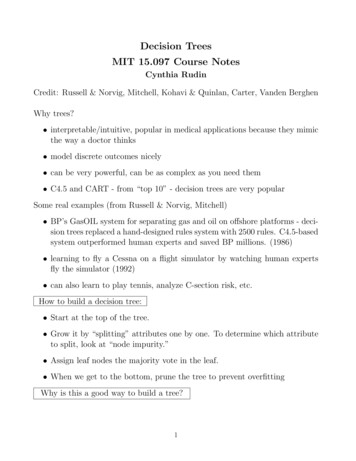
Example: mushroomshttp://www.usask.ca/biology/fungi/
Mushroom features1. cap-shape: bell b,conical c,convex x,flat f,knobbed k,sunken s2. cap-surface: fibrous f,grooves g,scaly y,smooth s3. cap-color: brown n,buff b,cinnamon c,gray g,green r,pink p,purple u,red e,white w,yellow y4. bruises?: bruises t,no f5. odor: almond a,anise l,creosote c,fishy y,foul f,musty m,none n,pungent p,spicy s6. gill-attachment: attached a,descending d,free f,notched n7.
y The output These names are the same: label, target, goal It can be– Continuous, as in our populationprediction Regression– Discrete, e.g., is this mushroom x edible orpoisonous? Classification
Two mushroomsx1 x,s,n,t,p,f,c,n,k,e,e,s,s,w,w,p,w,o,p,k,s,uy1 px2 x,s,y,t,a,f,c,b,k,e,c,s,s,w,w,p,w,o,p,n,n,gy2 e1. cap-shape: bell b,conical c,convex x,flat f,knobbed k,sunken s2. cap-surface: fibrous f,grooves g,scaly y,smooth s3. cap-color:brown n,buff b,cinnamon c,gray g,green r,pink p,purple u,red e,white w,yellow y4.
Supervised Learning Training set: n pairs of example, label:(x1,y1) (xn,yn) A predictor (i.e., hypothesis: classifier,regression function) f: x y Hypothesis space: space of predictors, e.g.,the set of d-th order polynomials. Find the “best” function in the hypothesisspace that generalizes well. Performance measure: MSE for regression,accuracy or error rate for classification
Evaluating classifiers During training– Train a classifier from a training set (x1,y1), (x2,y2), , (xn,yn). During testing– For new test data xn 1 xn m, your classifiergenerates predicted labels y’n 1 y’n m Test set accuracy:– You need to know the true testlabelsy yn 1n mn m1– Test set accuracy: acc 1y y 'm i n 1– Test set error rate 1 – accii
Decision Trees One kind of classifier (supervised learning) Outline:– The tree– Algorithm– Mutual information of questions– Overfitting and Pruning– Extensions: real-valued features, tree rules,pro/con
A Decision Tree A decision tree has 2 kinds of nodes1. Each leaf node has a class label, determined bymajority vote of training examples reaching thatleaf.2. Each internal node is a question on features. Itbranches out according to the answers.
Automobile Miles-per-gallon dgoodbadgoodgoodbadgoodbadcylinders displacement mweightacceleration modelyear americaamericaamericaamericaeuropeeurope
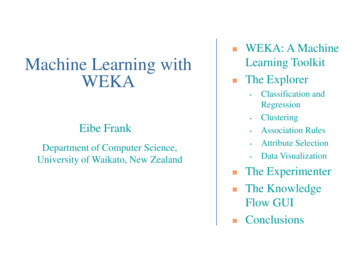
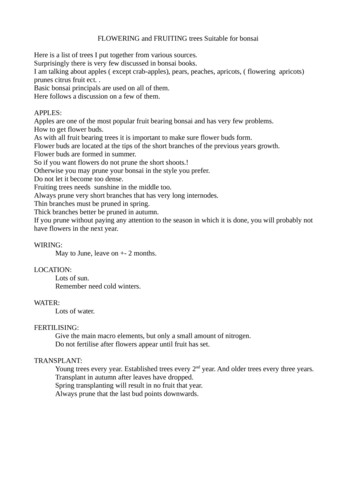
A very small decision treeInternal nodequestion: “what is thenumber ofcylinders”?Leaves: classify bymajority vote
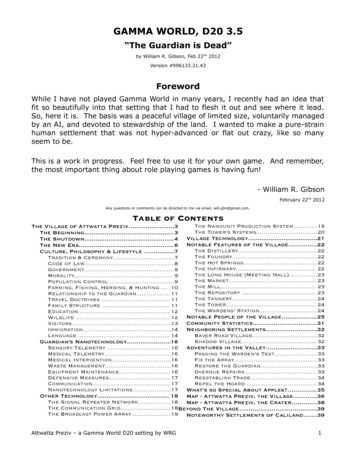
A bigger decision treequestion: “what is thevalue ofhorsepower”?question: “what is thevalue of maker”?
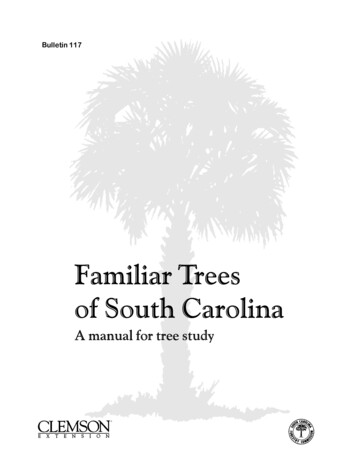
The fulldecision tree1. Do not split when allexamples have the samelabel2. Can not split when we runout of questions
Decision tree algorithmbuildtree(examples, questions, default)/* examples: a list of training examplesquestions: a set of candidate questions, e.g., “what’s the value of feature xi?”default: default label prediction, e.g., over-all majority vote */IF empty(examples) THEN return(default)IF (examples have same label y) THEN return(y)IF empty(questions) THEN return(majority vote in examples)q best question(examples, questions)Let there be n answers to q– Create and return an internal node with n children– The ith child is built by callingbuildtree({example q ith answer}, questions\{q}, default)
The best question What do we want: pure leaf nodes, i.e. all exampleshaving (almost) the same y. A good question a split that results in pure childnodes How do we measure the degree of purity induced bya question? Here’s one possibility (Max-Gain inbook):mutual information(a.k.a. information gain)A quantity from information theory
Entropy At the current node, there are n n1 nk examples––––n1 examples have label y1n2 examples have label y2 nk examples have label yk What’s the impurity of the node? Turn it into a game: if I put these examples in a bag,and grab one at random, what is the probability theexample has label yi?
Entropy Probability estimated from samples: with probability p1 n1/n the example has label y1with probability p2 n2/n the example has label y2 with probability pk nk/n the example has label yk p1 p2 pk 1 The “outcome” of the draw is a random variable y with probability (p1, p2, , pk)What’s the impurity of the node what’s theuncertainty of y in a random drawing?
kEntropyH (Y ) Pr(Y yi ) log 2 Pr(Y yi )i 1k pi log 2 pii 1 Interpretation: The number of yes/no questions(bits) needed on average to pin down the value of yin a random drawingH(y) H(y) H(y)
Entropybiasedcoinp(head) 0.5p(tail) 0.5H 1p(head) 0.51p(tail) 0.49H 0.9997Jerry’s coinp(head) ?p(tail) ?H ?
Conditional entropykH (Y X v) Pr(Y yi X v) log 2 Pr(Y yi X v)i 1H (Y X ) Pr( X v) H (Y X v)v:valuesof X Y: label. X: a question (e.g., a feature). v: ananswer to the question Pr(Y X v): conditional probability
Information gain Information gain, or mutual informationI (Y ; X ) H (Y ) H (Y X ) Choose question (feature) X which maximizesI(Y;X).
Example Features: color, shape, size What’s the best question at root? -
The training setExample ColorShapeSizeClass1RedSquareBig 2BlueSquareBig 3RedCircleBig H(class) H(class color)
Example ColorShapeSizeClass1RedSquareBig 2BlueSquareBig 3RedCircleBig H(class) H(3/6,3/6) 1H(class color) 3/6 * H(2/3,1/3) 1/6 * H(1,0) 2/6 * H(0,1)3 out of 6are red2 of thered are blue is 1 out of 6is blue2 out of 6are greengreen is -
Example ColorShapeSizeClass1RedSquareBig 2BlueSquareBig 3RedCircleBig H(class) H(3/6,3/6) 1H(class color) 3/6 * H(2/3,1/3) 1/6 * H(1,0) 2/6 * H(0,1)I(class; color) H(class) – H(class color) 0.54 bits
Example ColorShapeSizeClass1RedSquareBig 2BlueSquareBig 3RedCircleBig H(class) H(3/6,3/6) 1H(class shape) 4/6 * H(1/2, 1/2) 2/6 * H(1/2,1/2)I(class; shape) H(class) – H(class shape) 0 bitsShape tells usnothing aboutthe class!
Example ColorShapeSizeClass1RedSquareBig 2BlueSquareBig 3RedCircleBig H(class) H(3/6,3/6) 1H(class size) 4/6 * H(3/4, 1/4) 2/6 * H(0,1)I(class; size) H(class) – H(class size) 0.46 bits
Example ColorShapeSizeClass1RedSquareBig 2BlueSquareBig 3RedCircleBig I(class; color) H(class) – H(class color) 0.54 bitsI(class; shape) H(class) – H(class shape) 0 bitsI(class; size) H(class) – H(class size) 0.46 bits We select color as the question at root
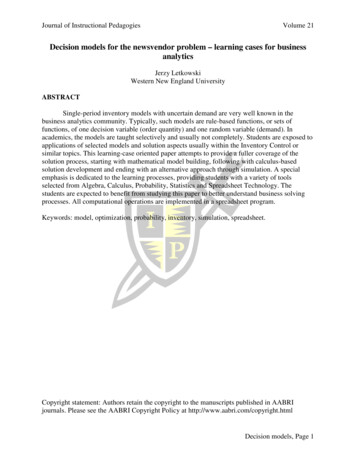
Overfitting Example (regression):Predicting US Populationx Year19001910192019301940195019601970198019902000y .21226.51249.63281.42 We have sometraining data(n 11) What will thepopulation bein 2020?
Regression: Polynomial fit The degree d (complexity of the model) isimportantf ( x) cd x d cd 1 x d 1 c1 x c0 Fit ( learn) coefficients cd, c0 to minimizeMean Squared Error (MSE) on training data1 n2MSE yi f ( xi ) n i 1 Matlab demo: USpopulation.m
Overfitting As d increases, MSE on training data improves,but prediction outside training data worsensdegree 0 MSE 4181.451643degree 1 MSE 79.600506degree 2 MSE 9.346899degree 3 MSE 9.289570degree 4 MSE 7.420147degree 5 MSE 5.310130degree 6 MSE 2.493168degree 7 MSE 2.278311degree 8 MSE 1.257978degree 9 MSE 0.001433degree 10 MSE 0.000000
Overfit a decision treeOutput y copy of e,Except a random 25%of the records have yset to the opposite of e32 recordsFive inputs, all bits, aregenerated in all 32 001001::::::111111
Overfit a decision tree The test set is constructed similarly– y e, but 25% the time we corrupt it by y e– The corruptions in training and test sets areindependent The training and test sets are the same, except– Some y’s are corrupted in training, but not in test– Some y’s are corrupted in test, but not in training
Overfit a decision tree We build a full tree on the training setRoote 0a 0e 1a 1a 0a 1Training set accuracy 100%25% of these training leaf node labels will be corrupted ( e)
Overfit a decision tree And classify the test data with the treeRoote 0a 0e 1a 1a 0a 125% of the test examples are corrupted – independent of training data
Overfit a decision treeOn average: ¾ training data uncorrupted– ¾ of these are uncorrupted in test – correct labels– ¼ of these are corrupted in test – wrong ¼ training data corrupted– ¾ of these are uncorrupted in test – wrong– ¼ of these are also corrupted in test – correct labels Test accuracy ¾ * ¾ ¼ * ¼ 5/8 62.5%
Overfit a decision tree But if we knew a,b,c,d are irrelevant features and don’t use them in thetree Pretend they don’t 111
Overfit a decision tree The tree would beRoote 0In training data, about ¾ y’s are0 here. Majority vote predictsy 0e 1In training data, about ¾ y’s are1 here. Majority vote predictsy 1In test data, ¼ y’s are different from e.test accuracy ?
Overfit a decision tree The tree would beRoote 0In training data, about ¾ y’s are0 here. Majority vote predictsy 0e 1In training data, about ¾ y’s are1 here. Majority vote predictsy 1In test data, ¼ y’s are different from e.test accuracy ¾ 75% (better!)Full tree test accuracy ¾ * ¾ ¼ * ¼ 5/8 62.5%
Overfit a decision tree In the full tree, we overfit by learning non-existent relations (noise)Roote 0a 0e 1a 1a 0a 1
Avoid overfitting: pruningPruning with a tuning set1. Randomly split data into TRAIN and TUNE, say70% and 30%2. Build a full tree using only TRAIN3. Prune the tree down on the TUNE set. On thenext page you’ll see a greedy version.
PruningPrune(tree T, TUNE set)1. Compute T’s accuracy on TUNE, call it A(T)2. For every internal node N in T:a) New tree TN copy of T, but prune (delete) the subtree under N.b) N becomes a leaf node in TN. The label is the majority vote of TRAINexamples reaching N.c) A(TN) TN’s accuracy on TUNE3. Let T* be the tree (among the TN’s and T) with the largestA(). Set T T* /* prune */4. Repeat from step 1 until no more improvement available.Return T.
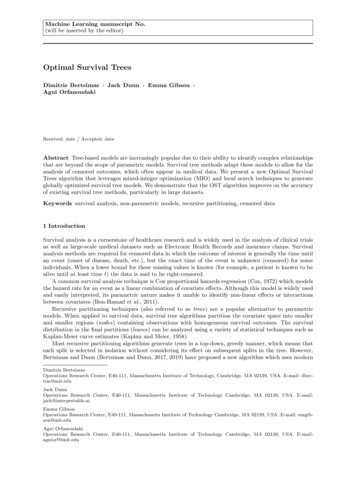
Real-valued features What if some (or all) of the features x1, x2, ,xk are real-valued? Example: x1 height (in inches) Idea 1: branch on each possible numericalvalue.
Real-valued features What if some (or all) of the features x1, x2, , xk are real-valued?Example: x1 height (in inches)Idea 1: branch on each possible numerical value. (fragments thetraining data and prone to overfitting)Idea 2: use questions in the form of (x1 t?), where t is a threshold.There are fast ways to try all(?) t.H ( y xi t ?) p( xi t ) H ( y xi t ) p( xi t ) H ( y xi t )I ( y xi t ?) H ( y) H ( y xi t ?)
What does the feature space look like?Axis-parallel cuts
Tree Rules Each path, from the root to a leaf, corresponds to arule where all of the decisions leading to the leafdefine the antecedent to the rule, and theconsequent is the classification at the leaf node. For example, from the tree in the color/shape/sizeexample, we could generate the rule:if color red and size big then
Conclusions Decision trees are popular tools for data mining––––Easy to understandEasy to implementEasy to useComputationally cheap Overfitting might happen We used decision trees for classification (predicting acategorical output from categorical or real inputs)
What you should know Trees for classificationTop-down tree construction algorithmInformation gainOverfittingPruningReal-valued features
Supervised Learning Training set: n pairs of example, label: (x 1,y 1) (x n,y n) A predictor (i.e., hypothesis: classifier, regression function) f: x y Hypothesis space: space of predictors, e.g., the set