Transcription
IOSR Journal of Business and Management (IOSR-JBM)e-ISSN : 2278-487X, p-ISSN : 2319-7668, PP 39-44www.iosrjournals.orgA Study On Financial Performance Using The Ratio Analysis AtKaleeswarar Mills B Unit Of National Textile Corporation LtdPROF. Mr.S.SABARINATHAN, Ms.V.JENIFERFaculty Department of Management Studies, Erode Sengunthar Engineering College, Erode 638057, TamilNadu, IndiaII-MBA Student, Erode Sengunthar Engineering College, Thudupathi, and Erode.ABSTRACT : The present study of the research entitled “A STUDY ON FINANCIAL PERFORMANCEUSING THE RATIO ANALYSIS AT KALEESWARAR MILLS B UNIT OF NATIONAL TEXTILECORPORATION LTD”. The study was based on secondary data from records, reports and profile of theorganization. The validity of any research is based on the systematic method of data collection analysis. TheRatio analysis is the process of identifying the financial soundness and cost effectiveness of the firm byestablishing relationship between the items of balance sheet and profit and loss a/c. The present study hasthrown major concentration in ratio analysis, from the 5years balance sheet and profit and loss a/c. Anobjective of the study includes the profitability, cost of goods sold and other experience company overallfinancial performance of the company. Short term-long term position of the company. Based on the five yearsbalance sheet and profit and loss a/c suitable suggestion were given by the researcher for a better soundnessand cost effectiveness of the company.I.INTRODUCTIONKaleeswarar mills „B‟ unit, Kalayarkoil is a unit of national Textile corporation(Tamilnadu&Pondichery) Ltd Coimbatore, owned by Government of India. when the condition of the textilemill was worse the Government of India decided to take over the management of this sick textile mills.Accordingly an act was passed which was called “The sick textile undertaken act 1974” The main intention ofthis enactment was:1)To Provide Continuous employment to the employees.2)To fulfill the basic necessities of worker at cheaper rate.3)To protect Government revenue (Tax/Duty)It is one of the best leading mills among NTC mills in India. NTC that is the holding company NewDelhi selected this unit as a model mill and if deputes techniques and higher officials of various subsidiaries tothis unit for field study. “ENTYCE” yarn produced by Kaleeswarar mills “B” unit Kalaiyarkoil are 90% oftheir yarn produced are sold in the Mumbai market and some them are sent to their own depot for sales. Thecapacity of this unit was increased only after 1984. The mill had entered into export marketing during 19871988. The mill already exported to Belgium, west Germany, U.K etc. in internal Products are sold the depot atMadurai, Erode, Tripper, and Bunge.II.REVIEW OF LITERATURERobert W. Smith and Thomas D. LynchRatio is any strategic or tactical advantage, and as a verb, means to exploit such an advantage, just asthe use of a physical lever gives one an advantage in the physical sense.Ratio is a very popular business term .Inthe world of finance, Ratio is the use of borrowed money to make an investment and the return on aninvestment.Ethan CoquetteWhich an investor or business is utilizing borrowed money. Companies that are highly lRatio may be atrisk of bankruptcy if they are unable to make payments on their debt; they may also be unable to findnew lenders in the future. Ratio is not always bad, however; it can increase the shareholders' return ontheir investment and often there is tax advantages associated with borrowing.III.RESEARCH METHODOLOGYNational Conference on “Innovative Business Practices in Technological Era”Erode Sengunthar Engineering College, Thudupathi, Erode39 Page
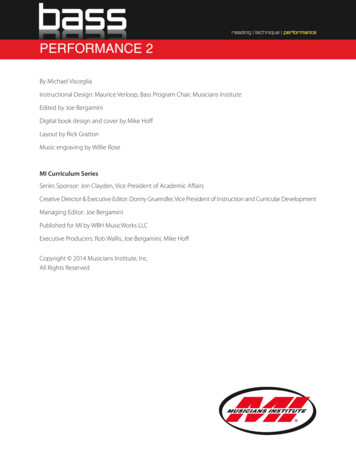
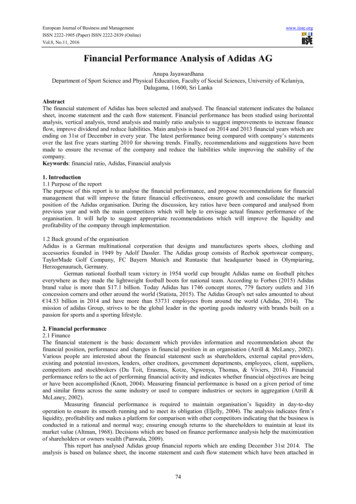
A Study On Financial Performance Using The Ratio Analysis At Kaleeswarar Mills B Unit OfThe researcher adopted the analysis of data in a manner that to combine relevance to purpose witheconomy in procedure.Research design is the basis of defining the research problem. The preparation of thedesign of the project is popularly known as research design. It was used in primary data was collected for thefirst time. The project data has been collected through discussion with accounts manager of the company.Secondary data that are already collected and analyzed by someone else such as annual reports, internal records,journals, magazines and newspapers. The study depends mainly in company‟s report, books and company‟sprofile. The tools are used ratio analysis in five year period of the study2009-2013.IV.OBJECTIVES OF THE STUDYTo analyze the ratio analysis of the KALEESWARAR MILLS „B‟ unit, Kalayarkoil is a unit ofnational Textile Corporation ltd. RATIO ANALYSISCURRENT RATIOYearTABLE SHOWING CURRENT RATIOCurrent assetsCurrent liabilities(Rs in Crore)(Rs in crore)Ratio -2013224360290.10Source: Secondary dataABSOLUTE LIQUID/CASH RATIO68932830.583.25TABLE SHOWING ABSOLUTE LIQUID RATIOYear2008-20092009-20102010-2011Absolute liquidasset(Rs in Crore)49209.72101573.0271663.31Current liabilities(Rs in crore)25209924.4038774695.2360092442.95National Conference on “Innovative Business Practices in Technological Era”Erode Sengunthar Engineering College, Thudupathi, ErodeRatio (%)0.00200.00260.001240 Page
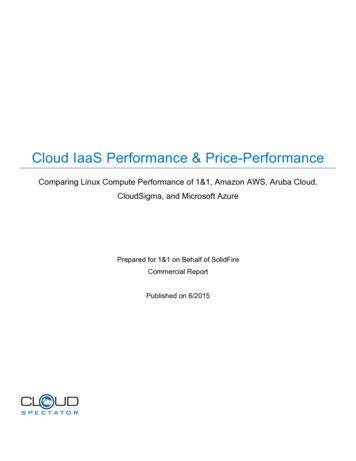
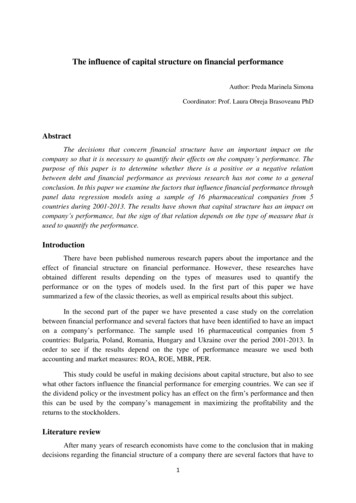
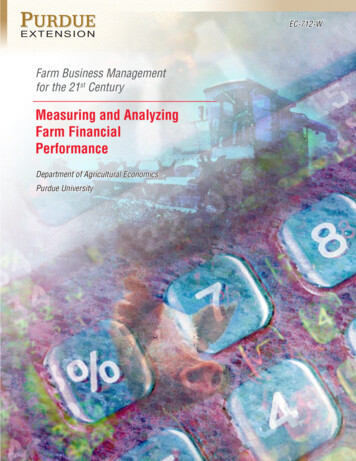
A Study On Financial Performance Using The Ratio Analysis At Kaleeswarar Mills B Unit Of2011-20122012-2013Source: Secondary 3350.2417ACID TEST RATIOYear2008-2009TABLE SHOWING ACID TEST RATIOLiquid AssetsCurrent liabilities(Rs in Crore)(Rs in crore)15047443.9425209924.40Ratio Source: Secondary dataINVENTORY STOCK TURNOVER RATIOTABLE SHOWING INVENTORY TURNOVER 2013Sales(Rs in Crore)Inventories(Rs in tional Conference on “Innovative Business Practices in Technological Era”Erode Sengunthar Engineering College, Thudupathi, Erode41 Page
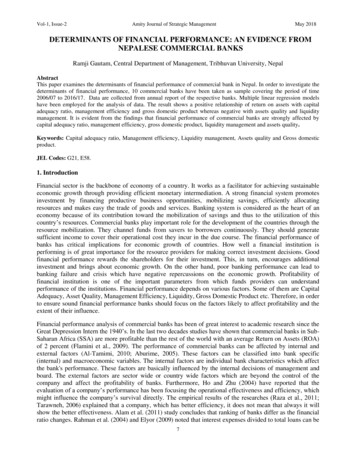
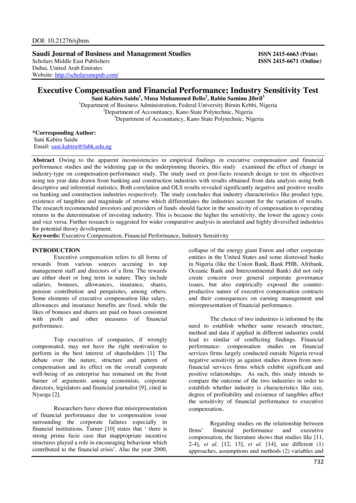
A Study On Financial Performance Using The Ratio Analysis At Kaleeswarar Mills B Unit OfSource: Secondary dataDEBTORS TURNOVER RATIO1.5 TABLE SHOWING DEBTORS TURNOVER RATIOTotal SalesDebtors(Rs in Crore)(Rs in 102010-20112011-20122012-2013Source: Secondary 6218.0025239597.4917.96V.INTERPRETATION The current ratio of the company is higher (4.33%) in 2009-2010 and it is lower (1.60%) in 2008-2009The Absolute liquid ratio of the company is higher (0.2417%) in 2012-2013 and it is lower (0.0012%)in 2010-2011 The Acid test ratio of the company is higher in 2009-2010 (3.33%) and it is lower in 2008-2009(0.60%) The Inventory turnover ratioof the company is higher in 2012-2013 (17.96 %) and it is lower in 20082009 (7.14%). The debtor‟s turnover ratio is higher in 2010-2011 (38.69%) and the ratio is lower in 2011-2012(15.97%).SUGGESTION: The company should concentrate the financial performance of the company. The company should control the ratio to earn more profit. I suggest the company to improve the absolute liquid asset.VI.CONCLUSIONThe study conducted on ratio analysis at “Kaleeswarar mills „B‟, unit of national textile corporationltd” gives a view of analysis evaluation of liquidity position of the company.Based on the tools used analysisand interpretation have been made giving way for useful and constructive suggestions. Thus the ratio analysis ofthe company is satisfactory. The company should enhance its performance for meeting challenges andexploiting opportunities in future.The project will guide to the management to interpret its weakness andproblems this will certainly helpthe management to taking financial decision. However more efforts need to betaken to improve the financial position for the growth of the company.APPENDICESKaleeswarar mills „B‟, unit of national textile corporation ltdBalance Sheet as on 31st March 2008-2009 &2009-2010 & 2010-2011National Conference on “Innovative Business Practices in Technological Era”Erode Sengunthar Engineering College, Thudupathi, Erode42 Page
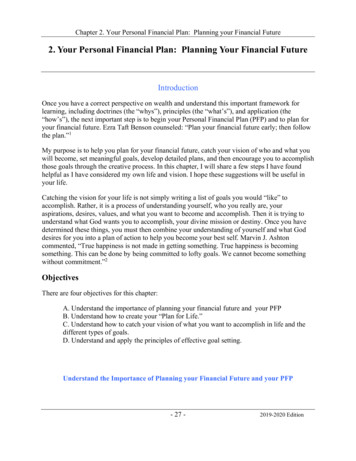
A Study On Financial Performance Using The Ratio Analysis At Kaleeswarar Mills B Unit OfPARTICULARS1.SOURCE OF FUNDS(a)shareholders fundi)share capitalii)Reserve and surplus(b)loan fundi)secured loansii)unsecured loansTOTAL2.APPLICATIONS OF FUNDSa)Fixed Assetsi)Gross Blockii)Less: Depreciation Reserveiii)Net Blockiv)capital WIPTOTALb)Investmentc)Current Assets, Loans &Advancesi)Inventoriesii)sundry debtorsiii)cash and bank balanceiv)other current assetsv)Loans Advancesvi)Inter-sub unit office current a/cvii) Inter- unit office current a/cTOTAL (A)LESSCurrent liabilities Provisioni)Current liabilitiesii)Provisioniii)Inter sub office current a/cTOTAL (B)Net current assets/liabilities (A-B)Miscellaneous expensesInter unit current a/cd)Profit & loss a/c(Balance as per annexed 9041.00330651608.16Kaleeswarar mills „B‟, unit of national textile corporation ltdBalance Sheet as on 31st March 2011-2012 & 2012-2013PARTICULARS2011-20122012-2013I.EQUITY AND LIABILITIES1.Shareholders fundsa)Share capitalb)Reserve & .37SUB TOTAL(1)219286591.74143754543.37National Conference on “Innovative Business Practices in Technological Era”Erode Sengunthar Engineering College, Thudupathi, Erode43 Page
A Study On Financial Performance Using The Ratio Analysis At Kaleeswarar Mills B Unit Of2.Non current liabilitiesa)Long term Borrowingsb)Deferred tax Liabilitiesc)Other Long term liabilitiesd)long term 550.00SUB TOTAL(2)3.Current liabilitiesa)Short term borrowingsb)Trade payablec)Other current liabilitiesd)Short term provisionse) Inter-sub unit office current a/cf) Inter- unit office current a/cSUB TOTAL(3)TOTAL(1 2 3)II.ASSETS1.Non current asseta)Fixed assetsi)Tangible assetsii)Intangible assetsiii)Capital WIPiv)Intangible assets under 235604878.261150321.0068932830.58626554144.73SUB TOTAL(a)b)Non current investmentc)Deferred Tax assete(net)d)Long term loans & advancese)other non current 05.43100.0053480583.20255166.00SUB TOTAL(1)2.current assetsa)Current investmentb)Inventoriesc)sundry debtorsd)cash and bank balancee)Short term Loans Advancesf)other current assetsg)Inter-sub unit office current a/ch) Inter- unit office current 933.92SUB TOTAL(2)TOTAL(1 REFERENCES I.M Pandey .Financial Management, 9thEdition ,Vikas Publishing House Pvt w.westpublishers.comNational Conference on “Innovative Business Practices in Technological Era”Erode Sengunthar Engineering College, Thudupathi, Erode44 Page
Ratio analysis is the process of identifying the financial soundness and cost effectiveness of the firm by establishing relationship between the items of balance sheet and profit and loss a/c. The present study has thrown major