Transcription
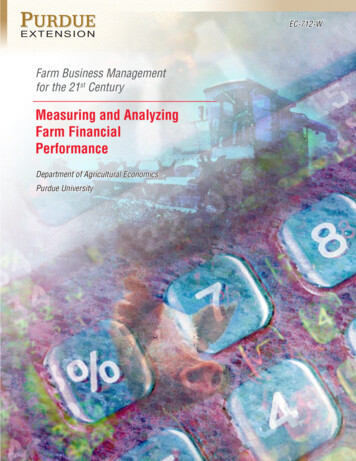
EXTENSIONFarm Business Managementfor the 21st CenturyMeasuring and AnalyzingFarm FinancialPerformanceDepartment of Agricultural EconomicsPurdue UniversityEC-712-W
Measuring & Analyzing Farm Financial Performance2
Purdue Extension Knowledge to GoFarm Business Managementfor the 21st CenturyMeasuring and AnalyzingFarm FinancialPerformanceAlan Miller,Craig Dobbins,Michael Boehlje,Freddie Barnard,and Nicole OlynkDepartment of Agricultural EconomicsPurdue University3
Measuring & Analyzing Farm Financial PerformanceAbout This PublicationThis publication and related materials help you measurethe financial position of your farm business and analyzehow changes may improve performance. We encourageyou to use these materials on an annual basis. While theanalysis for any one year can provide useful insights, thetrends in these ratios year after year provide even morevaluable information. For best results, do your annualanalysis for the same time period each year. For mostcalendar year taxpayers, December 31 each year is anappropriate balance sheet date because revenues andexpenses reported on the Schedule F in the federal incometax return are for the year ending on this date.To aid in doing analyses of your farm, a MicroSoft Excel spreadsheet file containing the five Worksheets that aredescribed in this publication has been linked to thisdocument. The World Wide Web address for this file is http://www.agecon.purdue.edu/files/EC712.xlsx . You canreach the link by left-clicking on the facsimile/thumbnailpicture of any of the five Worksheets in this document,or you can go to it directly by copying this URL into yourWorld Wide Web browser.If you click on any of the five Worksheet facsimiles thatappear in this publication, you will end up accessing adownloadable copy of an Excel spreadsheet that includesall five of the Worksheets discussed in this publication. Thespreadsheet is the same regardless of which picture youclick on, so you don’t need to click on these each time youcome to one.4Use the tabs at the bottom left-hand corner of thespreadsheet to navigate among the five differentWorksheets. The five Worksheets are in order fromWorksheet 1 to Worksheet 5. We recommend you workthrough them in that order. Worksheet 2 will provide abasic financial analysis for your farm based on data youenter on Worksheet 1. Worksheet 3 will help you analyzeyour farm’s repayment capacity in more depth. Worksheets4 and 5 will help you explore your options for improvingyour farm’s performance.The Authors
Purdue Extension Knowledge to GoTable of ContentsIntroduction6Financial Performance: How Do I Measure It?Financial Performance: How Am I Doing?Debt Service Analysis: Can I Repay?71113Cash Flow Budget: What Will It Tell Me?18Responding to Financial Stress: What Works Best?How Do I Improve Financial Performance?The Payoff from Improving PerformanceDetermining Breakeven Volume232630355
Measuring & Analyzing Farm Financial PerformanceMeasuring and AnalyzingFarm Financial PerformanceIntroductionOne of the responsibilities a farm business manager has is evaluating and monitoringfinancial performance. In order to successfully accomplish this task, the manager mustdecide how the evaluation will be conducted, collect data that accurately reflectsthe performance of the business, and develop a set of standards or benchmarks formeasuring performance. If performance is not satisfactory, management must identifyand implement adjustments that will lead to improved performance.This publication first suggests measures that managers can use to evaluate financialperformance. All of the measures are based on the financial measures recommended bythe Farm Financial Standards Council. This publication also provides a general set ofbenchmarks for these measures. Other sources of benchmark data are the following.6 FarmDoc http://www.farmdoc.illinois.edu/finance/index.asp Illinois Farm Business Farm Management Association http://fbfm.ace.uiuc.edu/ FINBIN Farm Financial Database http://www.finbin.umn.edu/ at the Center forFarm Financial Management at the University of Minnesota Iowa Farm Business Association http://www.iowafarmbusiness.org/ Kentucky Farm Business Management Program http://www.uky.edu/Ag/KFBM/pubs.php The worksheets included with this publication allow you to calculate the suggestedmeasures using data from beginning and ending balance sheets and the Schedule Fand Schedule 4797 tax forms. They are designed for use by farmers who file a cashtax basis Schedule F (Part I and Part II completed) or the equivalent rather than anaccrual basis schedule F (Part III completed). These sources of raw data were chosenbecause most farmers are cash basis taxpayers, so this information is available onmost farms. The worksheets guide you through the required computations one stepat a time. The cash tax basis information from a farmer’s Schedule F is converted toan accrual-adjusted basis for financial analysis purposes. Then, standard financialperformance measures and ratios are calculated. Farmers whose recordkeeping systemsor accountants prepare accurate accrual-adjusted financial statements should proceeddirectly to compute financial performance measures and ratios.If the measures show that financial performance is unacceptable, you must developand implement strategies for improvement. This publication suggests several possiblecourses of action and presents a worksheet for estimating the impact of proposedchanges.
Purdue Extension Knowledge to GoFinancial Performance: How Do I Measure It?The large swings in farm commodity prices and incomes that have become apart of agriculture make it important to closely monitor the financial position of your business. Low prices and incomes cause farmers to ask questionsabout how to measure their financial performance: “Do I have the financialcapacity to weather the storm?” During periods of high prices and incomes,farmers may be tempted to be overly optimistic about their future financialprospects. Historically, such periods have been short-lived. The questionsthen become: “Can I weather a decline in prices and incomes or a rise inrents and other input costs?” “Do I have the financial capacity to competefor rental land and other high value resources for production?” Assessingfinancial performance can help you answer these questions.Table 1 lists the key measures used in a financial description of your business. Using these measures, you can develop an assessment of your currentfinancial position. You either already have access to these measures, or theycan be calculated from documents you use to report financial information forincome taxes or to support a loan request.So what should you look for in terms of financial performance? Table 2(p. 10) describes common financial performance measures used by businessowners and managers, indicates what they mean, and provides useful benchTable 1. Descriptive Measures of Financial Position and PerformanceFinancial DescriptionMeasureInterpretationTotal Assets:The market value of all financial and capital resourcesowned by your business as reflected on the year-endbalance sheet.The size/amount of your business’s financial resources.Total Liabilities:The amount of total debt obligations at year-end asreflected on the balance sheet.The financial claims of lenders, input suppliers, and others on your business.Owner Equity:The value of your financial claims on total assets as determined by subtracting total liabilities from total assets. Oftenreferred to as “net worth.”Your financial stake in your business your financial claimto the business.Gross Revenues:The total value of products produced by your businesson an accrual-adjusted basis (i.e., whether sold for cashor held in inventory) as reflected on the accrual-adjustedincome statement.The income from sales and other sources available during an accounting period before deduction of expenses.Operating Expenses:The total of expenses incurred in conducting the on-goingoperations of your business as measured by the accrualadjusted income statement.The total expenses incurred in producing revenue duringan accounting period.Net Farm Income FromOperations:The net income reported on an accrual-adjustedbasis after operating expenses have been deductedfrom revenues. This is the net income beforecertain expenses, such as income taxes, have beendeducted. Typically it does not include capital gainsand losses that are unusual in nature and infrequentin occurrence.A basic measure of business profitability. Theamount by which income from operationsexceeds expenses from operations during anaccounting period.7
Measuring & Analyzing Farm Financial Performancemarks for comparison. In the following section, “Financial Performance:How Am I Doing?” you will find worksheets to calculate these measuresfor your farm. Use these worksheets to develop an assessment of yourfarm business.One way to assess how your business is doing is to compare its performance to the performance of similar businesses. This is commonly referred to as “benchmarking.” Benchmarking is the practice of looking forthose businesses that are the best at doing something and learning howthey do it in order to emulate that performance. Financial benchmarkingoften provides crucial evidence for answering the question, “How shouldmy farm be doing if it is going to be competitive in the farming industry?” Table 2 provides benchmarks that represent the median and highprofit (upper quartile) farms.The average benchmark for a group of comparable farms provides areference point for recognizing better-than-average performance. Morelikely than not, that level of performance may not be good enough tosustain the business in the long term, so producers should benchmarkagainst the top performing, or so-called “high profit” farms, wheneverthey are establishing performance standards or targets for their farms.Benchmarks of this type should at least be in your sights, even if yourown measures indicate that you are currently falling short of the desiredmark. Keep in mind that benchmarking against other comparable businesses is just one way to gain perspective in regard to your business’financial performance.Producers have several alternatives available for setting performancestandards for their businesses. Generally, it is important to assess yourcurrent performance relative to performance in prior years. This canoften lead to valuable insights into trends in business performance.It is also important to try to control financial performance by projecting expected values for the key performance measures for your farm.These projections can then be used to systematically evaluate variationsbetween planned performance and actual performance. However, neitherof these inward-looking approaches to assessing business performancenecessarily tells you much about farm competitiveness. In order to feelcomfortable that your farm is competitive, you need look at how otherfirms in the farming industry are performing.8Financial benchmarks for farms are almost always derived by averaging actual performance data from a large group of farms. The high-profitbenchmarks are typically derived by selecting the one-fourth or onethird of the farms in that large group that are the most profitable andaveraging the financial performance measures from those farms. FarmBusiness Associations in Illinois and Iowa are examples of sources ofsuch data. Often, these associations work with enough farms that theycan sort farms into different groups based on differences in farm sizeand/or type. This allows producers who are looking for appropriate financial benchmarks to choose benchmarks from farms that are very similarto their own farms.You should make an effort to know as much as possible about thesource of the benchmarks against which you plan to measure your farm’sperformance. Some benchmarks are highly variable in terms of what
Purdue Extension Knowledge to Goconstitutes top performance based on factors such as the type of farmcommodities produced. For example, the value of production per manon a high-profit dairy or swine farrow-to-finish operation typically willbe lower than for high-profit cash-grain farms. Further, the total investment in assets required to generate a particular level of revenue willdiffer substantially across swine, dairy, beef, and grain operations. Also,the relationship between owned assets and leased assets will affecthow comparable certain financial performance measures are likely to be.Invest time and effort in ensuring that you understand the characteristics of the benchmark farms to which you are comparing your own farmoperation.Also, other factors, such as the time period over which the performance information was gathered, will influence the values for certainmeasures. The benchmarks reported in Table 2 reflect 3-year or 4-yearaverage performance for grain farms in the Illinois FBFM program from2005 and through 2008. 2007 and 2008 are two of the most profitableyears grain farmers have experienced, and the resulting benchmark measures are correspondingly higher than in previous years as a result. Thetime of year typically can influence certain benchmarks. For example,liquidity ratios typically vary seasonally on a grain farm.Even methods used to summarize income, expenses, assets, andliabilities can have a big impact on the reliability, consistency, andcomparability of the resulting measures. For example, the value of farmproduction is a popular alternative to gross farm income for computingfinancial efficiency measures in some areas of the country. These twoalternative measures of farm revenues can produce significantly different values for financial efficiency measures on a farm with significantfeed and/or feeder livestock purchases. Furthermore, the value of farmproduction tends to be computed in several different ways. It’s essentialto know where the benchmarks come from, how the raw farm data wassummarized, and how the benchmarks were calculated before you relyon them.Ratios are often preferable to absolute measures for benchmarking. Ratios present financial information in the form of a relationshipbetween two absolute measures of performance. You can use ratiosto make different size businesses easier to compare. For example, youcan measure liquidity by working capital (current assets minus current liabilities), but in order to know if the level of working capital isadequate, you must know the size of the farm. It is difficult to makecomparisons among farms because of the differences in size. In Table 2,we suggest measuring liquidity using the current ratio (current assets current liabilities). Because these two measures are now compared inthe form of a ratio, adjustments for size are not necessary, and you canmake meaningful comparisons across farms of different sizes.Another way to make comparisons of performance measures moremeaningful across farms is to divide specific performance measures (forexample specific cost items) by dollars of revenue. Because revenue is ameasure of size, you can then compare the cost per dollar of revenue forparticular types of expenses to the average cost of those same items peraverage dollar of revenue for the benchmark farms.9
Measuring & Analyzing Farm Financial PerformanceTable 2. Key Financial Position and Performance Measures for Grain FarmsMeasureInterpretationProfitabilityOperating ProfitMargin RatioReturn on Assets(ROA)Return on Equity(ROE)LiquidityCurrent RatioWorking Capital/Gross RevenuesRatio10123Calculated as net farm income plusinterest expense minus family livingand income taxes divided by grossrevenues.The proportion of earnings or revenues that isoperating profit and thus available to compensatedebt and equity capital. Indicates the operatingmargins and reflects the ability to generate revenuesand control costs in such a way as to generate aprofit.The net income generated by all assets, after labor has been compensated but before interest payments,divided by total assets.The net income after all labor andinterest charges, that is, the residualreturn to the owner’s investmentdivided by the equity investment.The profitability per dollar of assets. ROA allowscomparisons over different size firms and differenttypes of businesses.8.9%14.9%The return a business owner receives on his/herequity in the business. Can be compared to ratesof return in other investment opportunities, such asstocks, bonds, or savings accounts. Such comparisons should be interpreted carefully in light ofthe different risks associated with each investmentalternative.10.5%21.1%Current assets (inventories, cash,accounts receivable, etc.) dividedby current liabilities (operating loanpayments, accounts payable, unpaidtaxes due, this year’s payments onterm loans, accrued interest, andrent, etc.).Current assets minus current liabilitiesdivided by gross revenues.A basic indicator of ability to meet financial obligations as they come due on a particular date. Itindicates the extent to which current assets, whenliquidated, will cover current liabilities. It does notpredict the timing of cash flows during the year or theadequacy of future inflows in relation to outflows.2.45:15.76:1Measures the relationship between working capital,which is current assets minus current liabilities, andannual gross vencyDebt/Asset RatioTotal liabilities divided by total assets.Debt/Equity RatioTotal liabilities divided by total equity.Financial EfficiencyAsset TurnoverRatioBenchmark1Average ofMedian Upper Quartile26.2%28.1%Gross revenues divided by totalassets.The basic leverage of the business, (i.e., whatproportion of total farm assets is owed to creditors).Measures the ability of the business to repay allfinancial obligations if all assets were sold.Measures the extent to which farm debt capital iscombined with farm equity capital to finance thebusiness entity.Reflects how efficiently farm assets generaterevenues; indicates the volume of businessgenerated by the asset base (i.e., the flow ofrevenue through the asset pipeline). Can show widevariation depending on the proportion of owned landor other assets.Operating ExpenseRatioTotal operating expenses minusdepreciation expense divided bygross revenues.The proportion of gross revenues that is absorbed byoperating expenses.59.2%52.0%DepreciationExpense RatioInterest ExpenseRatioDepreciation expense divided bygross revenue.The proportion of gross revenues that is absorbed bydepreciation expense.5.9%3.8%Total farm interest expense dividedby gross revenue.The proportion of gross revenues that is absorbed by interest expense.3.1%1.3%Net Farm IncomeRatioNet farm income from operationsdivided by gross revenues.The proportion of gross revenue that remains asnet income after all expenses are paid.31.3%39.9%Revenue per FullTime LaborerGross revenues divided by thefull-time equivalent person yearsof labor (both operator and hired)used.The fundamental measure of labor efficiency. Itindicates how productive farm labor is. 597,6603Raab, Dwight, Bradley L. Zwilling, and Jim Locher, Farm Income and Production Costs for 2010: Advance Report, University of Illinois Extension, AE-4566,April, 2011, Financial Characteristics of Grain Farms, 4-year averages for 2007-2010, page 10.These benchmarks were obtained by using the FINBIN Farm Financial Database for Minnesota farms in 2010 to generate whole farm summary reports. Thebenchmark in the median column is the average for all crop farms. The benchmark in the upper quartile column is the average for the 20% of the crop farmswith the highest net farm incomes. This measure of liquidity was higher on average on farms that had lower debt/asset ratios. .aspxRaab, Dwight, Bradley L. Zwilling, and Jim Locher, Farm Income and Production Costs for 2010: Advance Report, University of Illinois Extension, AE-45
analysis for the same time period each year. For most calendar year taxpayers, December 31 each year is an appropriate balance sheet date because revenues and expenses reported on the Schedule F in the federal income tax return are for the year ending on this date. To aid in doing a
