Transcription
Cloud IaaS Performance & Price-PerformanceComparing Linux Compute Performance of 1&1, Amazon AWS, Aruba Cloud,CloudSigma, and Microsoft AzurePrepared for 1&1 on Behalf of SolidFireCommercial ReportPublished on 6/2015
Cloud Spectator Performance ReportContents1. Introduction2Why Performance Matters2. Executive Sum m ary24Findings3. M ethodology46Process6Tests Used7VM Configurations and Pricing8Understanding Performance Results10Understanding The CloudSpecs Score (Price-Performance)10Key Considerations114. Detailed Perform ance Findings12Processor & Memory Bandwidth12Disk IOPS: Sequential and Random Operations14Internal Network175. Detailed Price-Perform ance Findings19Processor & Memory Bandwidth19Disk IOPS: Sequential and Random Operations21Internal Network246. Conclusion267. About261Copyright 2015 Cloud Spectator, Inc. All Rights Reserved. For non-commercial use only; do not distribute without permission from Cloud Spectator.
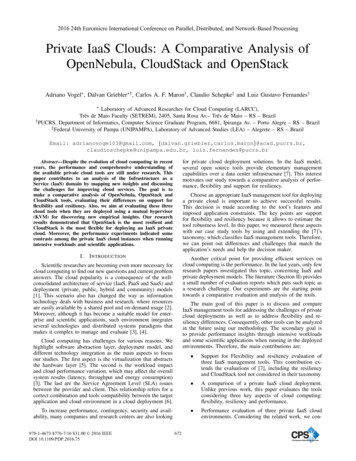
Cloud Spectator Performance ReportIntroductionIn an effort to simulate an end-user experience regarding performance of virtual machines across various cloud providers, Cloud Spectatorran its iterative benchmark suite for 72 hours on each of the following providers: 1&1, AWS, Aruba Cloud, Microsoft Azure, and CloudSigma.SolidFire sponsored this study on behalf of its client, 1&1.In most cases, much of the work was straightforward regarding provisioning and the setup process. Occasionally, vendor-side issuesoccurred during the provisioning process, and the Cloud Spectator team contacted the corresponding vendor’s support team in order to resolveissues such as VM provisioning errors. Three primary VMs of each size were tested on all providers for 24 hours each (72 hours total). This wasdone sequentially; once one VM had run the test suite for 24 hours, that VM was terminated and a new VM was created.This study not only examined the performance of each vendor, but also tracked performance variability for each of the three 24-hourperiods. The methodology allowed Cloud Spectator to capture performance variability both over time on the same VM as well as across differentVMs on multiple physical hosts. Some providers, such as 1&1, show strong processor and memory bandwidth performance stability for all of its VMsthroughout the course of the study. Other providers, such as AWS, exhibited controlled periods of burst followed by throttled performance on networkstorage depending on the size of the storage volume. Others, such as CloudSigma, exhibited unstable performance across all resources throughoutthe study, possibly due to server-side issues at the time of the study, which contributed to provisioning problems as well.Taking performance and stability a step further, price-performance analyses are conducted to help readers understand the value ratiobetween the cost of the VM and the performance output. While the performance output is limited to the data points collected in the study, bycomparing the price-performance ratio, readers can gain better insight into the overall user experience seen on these providers.Why Performance MattersPerformance and pricing are both key considerations in the public cloud industry, together having a substantial impact on a company’s annualoperating costs. Cloud users may need fewer resources on better performing services, which can lower costs. Since many users only consider priceand not price-performance, these users may be paying more because they require additional resources to achieve a desired level of performance.While some providers try to differentiate their offerings by cutting prices, others try to differentiate by focusing on improved performance and userexperience.Differences in performance outputs of VMs across IaaS providerscan greatly impact quality of service as well as annual operatingcosts. The graph on the right illustrates an example of theaverage processor performance from a sample of six CloudService Providers (CSPs) as studied by Cloud Spectator. CSP 1has a processor performance three times as high as CSP 6(names removed), which gives CSP 1 a notable advantage inmany processor-intensive workloads. CSPs 2-5 exhibit a closerresemblance in processor performance, but do not offer nearly asmuch processing power as CSP 1 does.2Copyright 2015 Cloud Spectator, Inc. All Rights Reserved. For non-commercial use only; do not distribute without permission from Cloud Spectator.
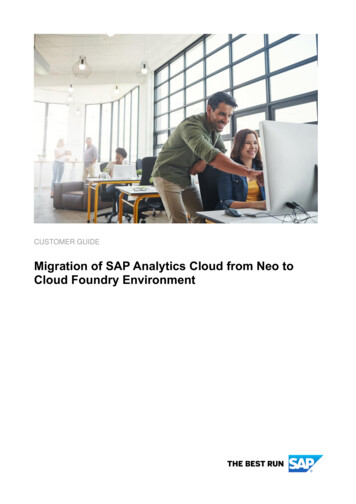
Cloud Spectator Performance ReportThe table below lists the 3 hardware components studied in this project, and each purpose as a function in the server.CPU & MEMORY PERFORMANCESTORAGE PERFORMANCENETWORK PERFORMANCEhighlyBecause most applications and all data resideIn a cloud environment, network performancedependent on the CPU. The CPU is responsible foron the disk, having fast disk performance is ais a critical piece. Scalability, in many cases,the processing and orchestration of all applications.keyis dependent on the availability of additionalThe relationship between CPU performance and RAMperformance in many cases.Theperformanceofallapplicationsisis also observed by examining RAM bandwidth. WhileconsiderationforbestapplicationVMs that must maintain a strong networkbackbone.memory performance is not considered one of the keybottlenecks in performance for many applications, asubset of applications—particularly HPC and inmemory databases—is highly dependent on largesustained memory bandwidth.3Copyright 2015 Cloud Spectator, Inc. All Rights Reserved. For non-commercial use only; do not distribute without permission from Cloud Spectator.
Cloud Spectator Performance ReportExecutive SummaryOn behalf of 1&1, SolidFire commissioned Cloud Spectator to gauge the performance of VMs on five different cloud providers’ European datacenters: 1&1, Amazon AWS, Aruba Cloud, CloudSigma, and Microsoft Azure. Both performance and price-performance were examined to evaluatethe value of each provider’s VMs. The purpose of the study was to understand, from an end-user perspective, the disparity of performance and value(defined as price-performance) among cloud providers with similarly sized VMs. Overall, 1&1 exceled in performance and price-performance for allcomponent resources of the VMs tested. Its high performance rankings, combined with hourly pricing, introduces powerful, scalable cloudinfrastructure at low cost to its users.FindingsvCPU & M em ory Perform ance FindingsFor this study, Cloud Spectator evaluated vCPU and memoryvCPU & Memory Performance Key Findings:bandwidth performance by benchmarking the VMs using Geekench 1&1’s VMs achieved the highest performance across processor3, a suite of benchmark tests that simulate tasks such ascryptographic encoding and image processing. Testing occurred overand memory performance in the study. 1&1’s VMs achieved the highest CloudSpecs ScoreTM in the testthe course of a 72-hour testing period. Pricing was examined ingroup, indicating the strongest price-performance value forconjunction with the performance tests.processor and memory bandwidth. CloudSigma’s processor performance varied the most. Itscoefficients of variation (CV), which is a percentage expressing therelationship between the average and standard deviation (usefulfor determining variability in performance), ranges up to 43.7%. The virtual processors on 1&1, AWS, and Azure exhibited the moststability throughout the study, resulting in less than 3% coefficientsof variation.4Copyright 2015 Cloud Spectator, Inc. All Rights Reserved. For non-commercial use only; do not distribute without permission from Cloud Spectator.
Cloud Spectator Performance ReportStorage Perform ance FindingsStorage was evaluated using the FIO disk benchmark, which testsStorage Performance Key Findings:the sequential read/write and random read/write operations of 1&1 VMs offered the highest disk performance among all includedstorage. In this study an 8KB block size was used. Testing occurredin this study.over a 72-hour test period. Persistent storage (offered as “block Although AWS offers SSD technology on its block storage offering,storage” or “redundant storage”) was used in all storage tests. PricingEBS, the performance of that offering is more dependent on thewas examined in conjunction with the performance tests.size of the block storage volume provisioned. Despite being one of the lower-tier performers in disk IOPS, Azuredisplayed the most stable disk performance throughout the study. Out of all providers examined in the study, only AWS appeared toprovide a period of burst performance for its block storage. On the2vCPU VMs, which have 100GB of block storage, AWS volumesdisplayed a burst behavior. After the period of burst, sequentialread/write operations and random read/write operations dropped tobecome 10% and 20%, respectively, of the initial IOPS achievedduring burst. This burst behavior was not seen on VMs with 400GBand 800GB of block storage, due to the larger number of IOPS. 1&1 displayed the best price-performance value for disk IOPS. Itshigh-performance SAN disk offering is designed with SolidFiretechnology.Internal Network Perform ance FindingsInternal network performance was measured as the throughputInternal Network Performance Key Findings:between VMs within the same data center of the cloud provider CloudSigma VMs achieved the highest internal network(measured using iperf and ping respectively) over the course of a 72-throughput, although the high throughput is unstable andhour test period. Pricing was examined in conjunction with thefluctuates between less than 500Mbits to over 10Gbits.performance tests. CloudSigma displayed the best price-performance value forinternal network. Despite its large fluctuation in internal networkthroughput, its median score range significantly outperformed allother providers. 1&1 achieved the second-highest internal network CloudSpecsScoreTM. Other than CloudSigma, only certain Azure VMs exceeded 1 GB/sthroughput.5Copyright 2015 Cloud Spectator, Inc. All Rights Reserved. For non-commercial use only; do not distribute without permission from Cloud Spectator.
Cloud Spectator Performance ReportMethodologyCloud Spectator strives to create a transparent and detailed methodology to allow readers to understand the testing process and recreate anystudies. If any information is unclear or if you have any questions, please email the team at contact@cloudspectator.com or call 1 (617) 300-0711.Process1.Three iterations of 24-hour test cycles were run for each VM on each provider for a total of 72 hours of testing per VM size. After each 24hour block, VMs were terminated before beginning another cycle of tests on newly provisioned machines.2.Each VM was provisioned with a Linux Ubuntu 14.04 OS by default, available from all providers. For AWS, the HVM image was used.3.Before each 24-hour test period, and after provisioning the VMs, system updates and upgrades were conducted via apt-get.4.The following dependencies were installed for testing:a.Git. Git was used to clone the test repository on the VM.b.MySQL. For automation purposes, mysql-server was installed to automate data uploads.c.Pip. Used to download the appropriate libraries for Python in order to run the testing. SQL Alchemy was downloaded to interactwith MySQL and upload data.d.5.Libmysqlclient-dev. MySQL database’s development files, which are necessary for the SQL Alchemy and MySQL interaction.Each test cycled through in the following sequence: Geekbench 3 (process & memory), fio sequential operations, fio random operations,Iperf internal network throughput (for more information on testing, see Tests Used).a.For fio testing (to measure disk IOPS), sequential operations ran first. Files from the sequential tests were deleted, and fiorecreated files before running random operations. Once random operations completed, the files were also deleted. Thus, beforeeach disk IOPS test, the files associated with the tests were deleted and recreated.6.Internal network testing was conducted in one of the following manners:a.On AWS and Azure, where VMs demonstrated varying internal network throughput depending on size and/or instance type, aclone of that VM was created in the same region/availability zone. The cloned server listened for a TCP connection via Iperf.E.g., two c4.large instances were created in Amazon AWS’s EU West 1 region to test throughput. The cloned VM wasterminated alongside the tested VMs at the conclusion of each 24-hour test cycle.b.On 1&1, Aruba Cloud, and CloudSigma, where VMs did not demonstrate varying internal network throughput depending on sizeand/or instance type, a screen session was created on each VM to listen for a TCP connection. Each category of VMs, whichcontains 2 VMs, connected with each other to perform throughput testing; i.e., 1&1’s 2 vCPU 4GB RAM and 2 vCPU 8GB RAMvirtual machines conducted network throughput tests across one another.7.A total of approximately 1.4 million data points were collected throughout the period of the study.8.At the end of each test iteration, results were uploaded into Cloud Spectator’s database through use of SQL Alchemy (Python—see 4c inProcess).6Copyright 2015 Cloud Spectator, Inc. All Rights Reserved. For non-commercial use only; do not distribute without permission from Cloud Spectator.
Cloud Spectator Performance ReportTests UsedProcessor & Memory Bandwidth: Geekbench 3Geekbench 3, a licensable product created by Primate Labs, is a cross-platform processor benchmark that can measure single-core and multi-coreperformance by simulating real-world workloads. The Geekbench 3 test suite is comprised of 27 individual tasks/workloads: 13 integer workloads, 10floating point workloads, and 4 memory-bandwidth tasks. While processor and memory bandwidth are both performance factors that contribute to thefinal score provided by Geekbench 3, the test suite weighs processing performance much more heavily than memory bandwidth. Also, memorybandwidth is not necessarily affected by the amount of memory available for the VM, so VMs with larger amounts of memory may not exhibit largerbandwidth. For more information on Geekbench 3 and to see its individual workloads, please see http://www.primatelabs.com/geekbench/.Geekbench 3 Tasks (Figure 3.1)TESTTOOLTASKDESCRIPTIONSeparate CPU tests that are all aggregated into a finalAES, Twofish, SHA1, SHA2, BZip2 Compression, BZip2IntegerGeekbench 3score.Decompression, JPEG Compression, JPEG Decompression,SubtestsPNGinclude:Integer Math,PointPNG Compression,Decompression,Sobel,FloatingLua, DijkstraMathFloating PointGeekbench 3Black Scholes, Mandelbrot, Sharpen Filter, Blur Filter,SGEMM, DGEMM, SFFT, DFFT, N-Body, Ray TraceInteger and Floating Point tasks together representvCPU performance. The performance of all applicationsis highly dependent on the vCPU since the vCPU isresponsible for the processing and orchestration of allapplications.While memory performance is not considered one ofMemoryGeekbench 3STREAM Copy, STREAM Scale, STREAM Add, STREAMTriadthe key bottlenecks in performance for many commonapplications, a subset of applications—particularly HPCand in-memory databases—is highly dependent onlarge sustained memory bandwidth.Sequential and Random Disk IOPS: fioFio is an open source I/O generator that spawns a number of threads and processes to conduct a particular type of I/O action specified. For thepurpose of this study, fio was used to measure disk IOPS by tracking direct I/O to the VM’s network storage. 5 x 200mb files were created forsequential operations testing, and 5 x 200 mb files were created for random operations testing. All operations were 50% read and 50% write. Eachtest iteration used an 8kb block size. Each test iteration lasted 60 seconds.Internal Network Throughput: IperfIperf is an open source tool used to measure TCP or UDP network bandwidth performance. In this study, Cloud Spectator used Iperf to measure thenetwork throughput between VMs residing in the same region/availability zone. A screen session was created for Iperf as a server machine on eachappropriate VM (see Process 6). Each Iperf test iteration lasted 60 seconds, and data was transferred in one direction, from the test VM to the Iperfserver VM.7Copyright 2015 Cloud Spectator, Inc. All Rights Reserved. For non-commercial use only; do not distribute without permission from Cloud Spectator.
Cloud Spectator Performance ReportVM Configurations & PricingVM configurations were matched to standardize by virtual processors. 2 vCPUs, 4 vCPUs, and 8 vCPUs machines from each provider were used inthis study that most closely matched in size. While some providers may offer the option for local storage, none was used and all disk testing wasconducted on persistent SAN storage. The storage columns in Figures 3.3 A through C are reflective of the SAN storage provisioned for each VM.Azure uses Blob Storage, which automatically provides the user with as-needed storage. Thus, only the space on the volume that is needed(depending on the OS and installed applications) is given to the user. With Blob Storage, users cannot deploy volumes with a pre-defined amount ofstorage, although the user can specify how large he or she expects the blob to grow. For more information, see this zure/ee691964.aspx.2 vCPU Virtual Machines (Figure 3.3 A)ProviderInstancevCPURAM (GB)Storage (GB)Monthly ( )1&14GB24100 29.991&18GB28100 79.20AWSC4.large23.75100 (EBS Optimized) 95.04AWSM3.large27.5100 (EBS Optimized) 108.72Aruba Cloud4GB24100 64.80Aruba Cloud8GB28100 79.20A223.5Blob Storage 68.10AzureAzureD227Blob Storage 104.60CloudSigma4GB24100 49.33CloudSigma8GB28100 73.738Copyright 2015 Cloud Spectator, Inc. All Rights Reserved. For non-commercial use only; do not distribute without permission from Cloud Spectator.
Cloud Spectator Performance Report4 vCPU Virtual Machines (Figure 3.3 B)ProviderInstancevCPURAM (GB)Storage (GB)Monthly ( )1&18GB48400 93.601&115GB415400 144.00AWSC4.xlarge47.5400 (EBS Optimized) 208.08AWSM3.xlarge415400 (EBS Optimized) 236.16Aruba Cloud8GB48400 158.40Aruba Cloud15GB415400 183.60AzureA347Blob Storage 143.65AzureD3414Blob Storage 216.59CloudSigma8GB48400 135.27CloudSigma15GB415400 177.978 vCPU Virtual Machines (Figure 3.3 C)ProviderInstancevCPURAM (GB)Storage (GB)Monthly ( )1&115GB815800 (2 x 400) 172.801&130GB830800 (2 x 400) 280.80AWSC4.2xlarge815800 (EBS Optimized) 416.88AWSM3.2xlarge830800 (EBS Optimized) 473.76Aruba Cloud15GB815800 313.20Aruba Cloud30GB830800 367.20AzureA4814Blob Storage 287.24AzureD4828Blob Storage 433.11CloudSigma15GB815800 276.63CloudSigma30GB830800 368.15Conversion Rates: 1.00 1.40 1.00 0.899Copyright 2015 Cloud Spectator, Inc. All Rights Reserved. For non-commercial use only; do not distribute without permission from Cloud Spectator.
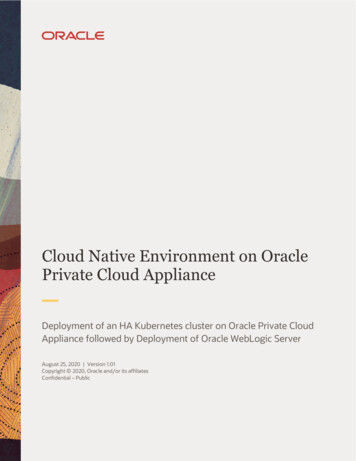
Cloud Spectator Performance ReportUnderstanding Perform ance ResultsThe virtual machines’ performance information was depicted using the minimum, 5th percentile, median, 95th percentile, and maximum scoresretrieved from all data points collected for each of the tests mentioned above during the testing period. The information was integrated into percentilegraphs and value tables designed to visualize performance variation captured while testing over time. An example of a performance percentile graphis displayed below:LegendSample Performance GraphMaximum: highest score achieved on this VM over the duration of the4000testing.Mpixels/sec350095TH Percentile (High-Score Category): 95% of all scores on this VM3000achieved this score or lower.2500Median (Median-Score Category): The number separating the higher halfof the scores of that VM from the lower half. If the median is closer to the200095th percentile, then more high scores were observed than low scores; vice1500versa.10005TH Percentile (Low-Score Category): 5% of all scores on this providerachieved this score
Jul 01, 2015 · Cloud Spectator strives to create a transparent and detailed methodology to allow readers to understand the testing process and recreate any studies. If any information is unclear or if you have any questions, please email the team