Transcription
European Journal of Business and ManagementISSN 2222-1905 (Paper) ISSN 2222-2839 (Online)Vol.8, No.11, 2016www.iiste.orgFinancial Performance Analysis of Adidas AGAnupa JayawardhanaDepartment of Sport Science and Physical Education, Faculty of Social Sciences, University of Kelaniya,Dalugama, 11600, Sri LankaAbstractThe financial statement of Adidas has been selected and analysed. The financial statement indicates the balancesheet, income statement and the cash flow statement. Financial performance has been studied using horizontalanalysis, vertical analysis, trend analysis and mainly ratio analysis to suggest improvements to increase financeflow, improve dividend and reduce liabilities. Main analysis is based on 2014 and 2013 financial years which areending on 31st of December in every year. The latest performance being compared with company’s statementsover the last five years starting 2010 for showing trends. Finally, recommendations and suggestions have beenmade to ensure the revenue of the company and reduce the liabilities while improving the stability of thecompany.Keywords: financial ratio, Adidas, Financial analysis1. Introduction1.1 Purpose of the reportThe purpose of this report is to analyse the financial performance, and propose recommendations for financialmanagement that will improve the future financial effectiveness, ensure growth and consolidate the marketposition of the Adidas organisation. During the discussion, key ratios have been compared and analysed fromprevious year and with the main competitors which will help to envisage actual finance performance of theorganisation. It will help to suggest appropriate recommendations which will improve the liquidity andprofitability of the company through implementation.1.2 Back ground of the organisationAdidas is a German multinational corporation that designs and manufactures sports shoes, clothing andaccessories founded in 1949 by Adolf Dassler. The Adidas group consists of Reebok sportswear company,TaylorMade Golf Company, FC Bayern Munich and Runtastic that headquarter based in Olympiaring,Herzogenaurach, Germany.German national football team victory in 1954 world cup brought Adidas name on football pitcheseverywhere as they made the lightweight football boots for national team. According to Forbes (2015) Adidasbrand value is more than 17.1 billion. Today Adidas has 1746 concept stores, 779 factory outlets and 316concession corners and other around the world (Statista, 2015). The Adidas Group's net sales amounted to about 14.53 billion in 2014 and have more than 53731 employees from around the world (Adidas, 2014). Themission of adidas Group, strives to be the global leader in the sporting goods industry with brands built on apassion for sports and a sporting lifestyle.2. Financial performance2.1 FinanceThe financial statement is the basic document which provides information and recommendation about thefinancial position, performance and changes in financial position in an organisation (Atrill & McLaney, 2002).Various people are interested about the financial statement such as shareholders, external capital providers,existing and potential investors, lenders, other creditors, government departments, employees, client, suppliers,competitors and stockbrokers (Du Toit, Erasmus, Kotze, Ngwenya, Thomas, & Viviers, 2014). Financialperformance refers to the act of performing financial activity and indicates whether financial objectives are beingor have been accomplished (Knott, 2004). Measuring financial performance is based on a given period of timeand similar firms across the same industry or used to compare industries or sectors in aggregation (Atrill &McLaney, 2002).Measuring financial performance is required to maintain organisation’s liquidity in day-to-dayoperation to ensure its smooth running and to meet its obligation (Eljelly, 2004). The analysis indicates firm’sliquidity, profitability and makes a platform for comparison with other competitors indicating that the business isconducted in a rational and normal way; ensuring enough returns to the shareholders to maintain at least itsmarket value (Altman, 1968). Decisions which are based on finance performance analysis help the maximizationof shareholders or owners wealth (Panwala, 2009).This report has analysed Adidas group financial reports which are ending December 31st 2014. Theanalysis is based on balance sheet, the income statement and cash flow statement which have been attached in74
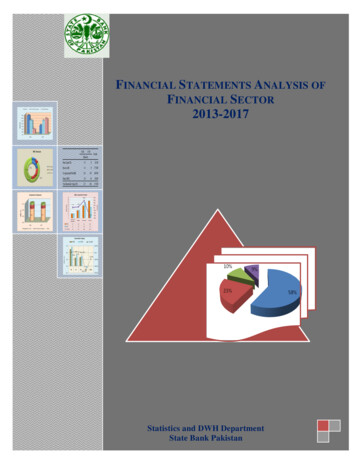
European Journal of Business and ManagementISSN 2222-1905 (Paper) ISSN 2222-2839 (Online)Vol.8, No.11, 2016www.iiste.orgthe Appendices. The income statement set out the summary of the trading events that will affect the capital ofthe business and shows whether the company is selling its product or service, for less or more than its cost ofdeliver them to its customers (McLaney, 2006). Balance sheet is a snapshot of the company’s assets, liabilitiesand equity at the end of the fiscal year (Brigham & Ehrhardt, 2013). The statement of cash flow indicates thesummary of organisation’s ability to generate cash (Du Toit et al.,2014).2.2 Horizontal AnalysisHorizontal analysis is used to identify the changes in the amounts of corresponding financial statement itemsover a period of time (Gibson, 2010). The analysis is based on two periods of accounts and earliest period isusually used as the base period then all later period are compared with items on the statements of the base period(Bernstein & Wild, 1993). The based period amount is calculated as 100% then each following period isexpressed as a percentage of the amount in the based year.The horizontal analysis is useful to see the impact of operational results on a company's financialcondition over the review period. But the common problem is that aggregation of information in the financialstatements could change over time, due to ongoing changes on the accounts (Fridson & Alvarez, 2011).Table; 1. Horizontal AnalysisItem20142013Change( in million)( in million)%Net Sales14,53414,2032.3Cost of Sales7,6107,2025.7Gross Profit6,9247,001-1.1Operating Expenses6,2036,0133.2Operating Profit8831,181-25.2Income before Taxes8351,113-24.9Net Income496790-37.2Finger; 1. Horizontal AnalysisHorizontal analysis has been done for income statement in financial year 2013 and 2014 above.Comparing with 2013, Net income was declined 37.2% even though the net sales were increased by 2.3%. Thesecharts illustrate increasing cost of sales by 5.7% and operating expenses by 3.2% directly affected on decliningnet income. Therefore Adidas should concern about reducing cost of sales and operating expenses to maximisethe net income in next years. Effective and low cost communication medium utilised to reduce the cost of salesand reduction of additional employees would be another option to minimise the operation cost as salaries andwages are the highest part of the operation cost (Eljelly, 2004).2.3 Trend AnalysisThis analysis is similar to horizontal analysis, but evaluates an organization’s financial information more overtwo period of time (Fridson & Alvarez, 2011).Therefore this analysis helps to grasp the changes in the selectedvariables more easily. Evaluating several years’ data will help to forecast future financial trends accurately in an75
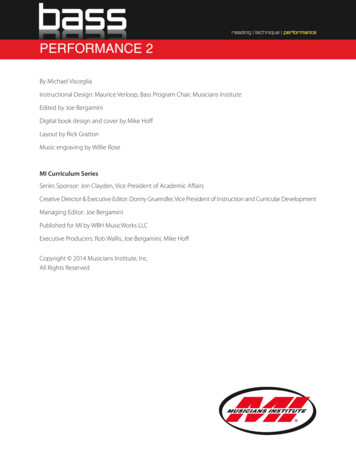
European Journal of Business and ManagementISSN 2222-1905 (Paper) ISSN 2222-2839 (Online)Vol.8, No.11, 2016www.iiste.orgorganisation (Bernstein & Wild, 1993).Table; 2. Trend AnalysisColumn120102011201220132014Net .5598.77567671524790496Gross ProfitOperating ProfitNet Income100118.3492.42139.3387.48This trend of income statement illustrates the analysis on the different period of net sales, gross profitand operating profit assuming 2010 as base. While comparing the value to 2006, the absolute value of net salesand gross profit are in increasing trend. The absolute value of operation profits has changed on year to year andat 2014 value of operating profit is low in compared to 2010. It mean, Adidas had more operating cost in 2012and it affected on reducing the net income. The net income is mainly depending on operating expenses. Whenthe operating cost went down in 2013 net income increased parallel with the operating profit. But whenoperating profit went down (operating expenses increased) by 98.77%, net income also went down by 87.48%.Finger; 2 Trend Analysis2.4 Vertical AnalysisThis is a comparative analysis of a financial statement where each line item on accounts is listed as a percentageof another item (Shaoul, 1998). For example, when analysing the vertical amounts on the balance sheet everyamount on the balance sheet is restated to be a percentage of total assets. One of the main advantages of thisanalysis is that the balance sheet can be easily compared to any size of organisation and it will help to understandrelative annual changes within one business (Fridson & Alvarez, 2011).76
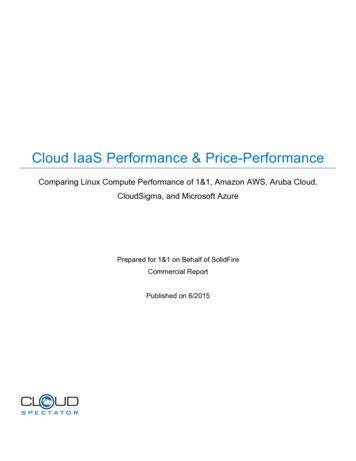
European Journal of Business and ManagementISSN 2222-1905 (Paper) ISSN 2222-2839 (Online)Vol.8, No.11, 2016Table; 3. Vertical AnalysisAssetscash and cash equivalentsShort-term financial assetsAccount receivableOther current finance assetsinventoriesIncome tax receivableother current assetsAssets classified held for saleTotal current assetsProperty, Plant and EquipmentGoodwillTrademarkOther intangible assetsLong term financial assetsOther non curent finance assetsDeferred tax assetsOther non-current assetsTotal non-current assetsTotal assetsLiabilities and EquityShort-term borrowingAccount PayableIncome taxesTotal current liabilitiesTotal non-current liabilitiesReservesShareholder equityTotal equityTotal liabilities and 75.872.0740.7811.952.7747.3247.25100Finger;3. Vertical AnalysisOne of main issues when using vertical analysis for balance sheet is what to use as the benchmark in thepercentage calculation (Atrill & McLaney, 2002). The usual benchmarks are total asset or total liabilities whencalculating assets and liability line item percentages, and the total of all equity accounts when calculating allequity line item percentages.The analysis shows that the total assets of the company increased from 2013 to 2014 and there is aslight increase in total current assets. Adidas has 59.17% higher the proportion of current assets in case to cover77
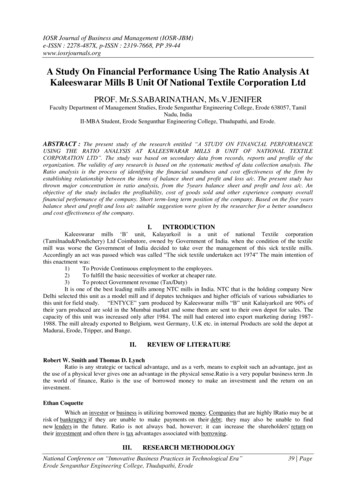
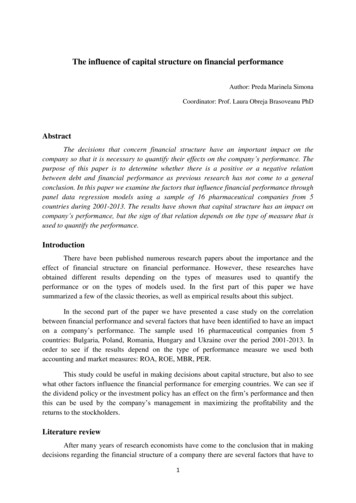
European Journal of Business and ManagementISSN 2222-1905 (Paper) ISSN 2222-2839 (Online)Vol.8, No.11, 2016www.iiste.orgall current and non-current liabilities which is total 54.76%. The company also has 13.55% of cash and cashequivalents which can cover short-term borrowing (2.32%) account payable (2.32%) income taxes (2.37%) totalamount of 7.01%. The analysis shows that, Adidas strong working capital position and its ability to meet itsnear-term obligations.2.5 Financial RatiosA sustainable organisation requires effective planning and financial management (Lewellen, 2004). Ratioanalysis provides key indicators of organisational performance which will help to understand the organisationfinancial results and trends over time (Barnes, 1987). The ratio analysis reveals valuable information aboutorganisation’s financial attributes and it helps to compare organisation’s ratio with prior periods, competitor orindustry average, that will benefit to understand the current business position of the organisation (Schoenebeck& Holtzman, 2013). Whittington (2007) has recognised that two principal uses of financial ratios; normative useratio for organisation’s ratio compared with a standard and positive use in identifying empirical relationshipssuch as predictive purposes.Summarising quite complex accounting details into a relatively small number of key indicators is one ofmain reasons to calculate ratio (McLaney, 2006). However, deferent users have different interests in financialinformation which will determine the ratios they need to use (Atrill & McLaney, 2002). For example, investorsare interested more in profitability ratios, liquidity ratios and solvency ratios. Therefore it is important to identifythe objective of the finance report before calculating the ratios for generates useful data (Walsh, 2008).2.6 Key RatiosThe ratios to be analysed are credit payment period, return capital employed, current ratio, net profit margin andearnings per share. These ratios influence on financial health of the company and important for managers,stakeholders, investors, lenders and suppliers. These ratios are a part of ratios such as liquidity ratios, productiveratios, profitability ratios investment ratios and overall performance ratios (appendix, I).Table; 4 Key Ratios AnalysisItem2014 year2013 yearChange %Creditor payment period79.2 days92.5 days-14.38Return capital employed 0.1 (10%) 0.16 (16%)-37.5Current Ratio1.7 : 11.4 : 121.42Interest cover13.5015.20-11.84Earnings per share 2.43 3.78-35.71Finger; 4 Percentage of Key Ratios Change (based on 2013)Creditor payment period is a liquidity ratio that indicates an organisation’s capacity to pay off itsaccount payable (Bernstein & Wild, 1993). This ratio is a useful calculation to assess the liquidity position of abusiness (Australian shareholders’ association, 2010). It shows how many times an organisation can pay off theiraverage accounts payable balance during the one financial year.In 2013, Adidas took more than 92 days to pay their traders. In general organisations that need tomaximise their cash flow have to take as long as possible to pay its bills (Brigham & Houston, 2004). But 9278
European Journal of Business and ManagementISSN 2222-1905 (Paper) ISSN 2222-2839 (Online)Vol.8, No.11, 2016www.iiste.orgdays is a far long time, it can be seen when compared with Nike which took just 24 days to pay off their bills in2013 financial year (Appendix.2). There is several risk associated with taking more time than their agreementwith the supplier such as loss of supplier goodwill and potential for late-payment charge and threat of legalactions (Bernstein & Wild, 1993 ). However, in 2014 Adidas was able to reduce the payment days for 79 day itwas 14.38% reduction when it compare to 2013. This could be good news for suppliers and lenders of the AdidasCompany.Return on capital employed (ROCE) is a profitability ratio which indicates how efficiently anorganisation can generate profits from its capital employed by comparing profit before interest and tax to capitalemployed (Keown et al., 2008). This ratio calculation illustrates how much profit each Euros of employed capitalgenerate; a higher number of ratio mean more Euros of profits generated by each Euros of capital employed.Adidas generated 0.16 for 1 investment in 2013 and was reduced to 0.10 by 37.5% in 2014. Thesenumbers indicate that company assets’ performance is struggling and the company long term financial problem.In 2013 and 2014 Nike had 0.24 ( .026) and 0.22 ( 0.22) ratio amounts respectively (appendix.2). Accordingto the return on capital employed calculation, Adidas is below in long term financial performance than Nike by33.33% in 2013 and 54.54% in 2014. This mean Adidas’ amounts of assets are hindering them to achieve a highreturn. Adidas Company is declining the money return on every euro invested in the business and burns up morecapital to generate profits. Decline in ROCE could signal the loss of competitive advantage and bad news forstakeholders and investor.The current ratio is a liquidity ratio which shows the proportion of current assets of a company inrelation to its current liabilities (Bernstein & Wild, 1993). The calculation shows a company’s ability to repayshort-term liabilities. The ratio of 2:1 consider as the benchmark, however it could vary across industries (Atrill& McLaney, 2002).In 2013, Adidas 1.4:1 ratio which indicate the sufficient money to meet current liabilities. However,that amount is far below to the benchmark. It indicates the risk of unable to pay off its obligations. End of 2014Adidas came to good financial health which indicates 1.7:1 amount in current ratio. This ratio reflects using thecurrent ratio in different ways as high current ratio may suggest company is not managing its working capitalwell (Keown et al., 2008). But it could not be easily liquidated all current assets in a company as current ratioassumed; this is one of error in using this ratio (Australian shareholders’ association, 2010).The interest cover ratio is calculated as the ability of a company to pay the interest on its outstandingdebt (Bernstein & Wild, 1993). It helps to calculate how many times a company could pay its current interestpayment with its available earnings. A company’s capacity to meet its interest obligations is an aspect of acompany’s solvency as it is an important factor in the return for stakeholders (Brigham & Houston, 2004).Therefore, the ratio is used to determine the risk of lending funds to a company by creditors, lenders, andinvestors (Bernstein & Wild, 1993 ).Adidas had 15.20 and 13.50 interest cover ratios in 2013 and 2014 respectively. In general, interestcover ratio warning sign margin is 2.5, that the company should be careful about their future financial situation(Keown et al., 2008). In this situation, Adidas is in good financial health with confidence to pay their interest forlenders. But they have to consider about 11.84% reduction of their ability in 2014.The earning per share ratio indicates the amount of company’s profit allocated each outstanding shareof common stock (Australian shareholders’ association, 2010). Indicating high amount of earning per share ratiosignals potential of generating a significant dividend for investors (Bernstein & Wild, 1993). Adidas had 3.78earnings per share in 2013 and it reduced to 2.43 in 2014. Reduced net income in 2014 directly effected on thissudden decline. Somehow, Adidas shareholders can satisfy the earning per share in Adidas when compared toNike as they generated 3.09 ( 3.35) per share in 2014.In summary, Adidas had some financial difficulties in 2014 when compared to 2013 financial year.Especially company has trouble on capital efficiency as employed capital is not generating sufficient income.However, identifying a company’s financial situation is more difficult and it is important not to rely on fewfinancial measurements (Brigham & Houston, 2004).3. ConclusionThe company is performing well and it will continue to make profit and revenues for next financial years.However Adidas could be affected with considerable risks according to high operating expenses which hinderthe overall performance and net income. The company had 0.1 ROCE that means less efficiency in capitalemployed in the company. Therefore capital should be invested on a productive manner and unproductivityassets such as vacation properties and personal use vehicles should be sold as soon as possible. Capital shouldinvest on most productive assets which will help to increase the revenue such as equipment for factory, vehiclesfor sales and showrooms. Adidas had 14,534 net sales in 2014 while their main competitor Nike had 25531( 27799). Next financial year, Sale of the products should be increased along with their prices in order to acquiremore working capital which will help to fund further competitors. Increasing operating cost is the main reason of79
European Journal of Business and ManagementISSN 2222-1905 (Paper) ISSN 2222-2839 (Online)Vol.8, No.11, 2016
amount of 7.01%. The analysis shows that, Adidas strong working capital position and its abilit