Transcription
Patient Flow AnalysisPulmonary Clinic University of Michigan Hospitals-Prepared For:Dr. Galen Toews, M.D., DirectorDr. Charles Watts, M.D., Staff PhysicianTatiana Baily, Division AdministratorJ. Elizabeth Othman, R.N., M.S., Project CoordinatorWritten By:Laura Drake, Student EngineerRobert Fry, Student EngineerSara Naylor, Student Engineer 10E481Dr. Richard J. CoffeyApril 25, 1995
Table of ContentsExecutive Summ. 11.0 Introduction and Backod1.1 Approach and Methodology.341.1.1 Interviews with the Staff41.1.2 Time Study41.1.3 Direct Observation of Chin41.2 Limitations2.0 Current Process Flow Description552.1 Taubman52.2 Briarwood73.0 Results and Conclusions93.1 Patient Population93.2 Data Summary103.3 Arrival Times123.4 Wait Times143.5 Service Times183.6 Length of Stay203.7 Percent Time Spent with Patients213.8 Room Utilization22 3.9 Time Statistics by Appointment233.10 Scheduling Templates263.11 Simulation Results284.0 Recommendations315.0 Appendix33
GlossaryEncounter: Any interaction between a staff member and a patient. A separation ofmorethan two minutes is defined as a separate encounter.Initial Wait Time: (Wait for the First Provider) The time from the end of Check-in to thestart ofthe first encounter with a care provider.Length of Stay (LOS): The total time a patient is in the clinic. LOS is measured from thestart of check-in to the end of check-out.Room Utilization: The amount of time a room is in use for service only. This excludesthe time that the patient may spend waiting in the roomTotal M.D. Service Time (1’ST-M.D.): The total time that the patient spends with thephysician during their appointment.Total Service Time (1’ST): The total time spent in encounters with the patient.Wait Time: The amount of time a patient is in the clinic but not receiving service from aprovider. Wait time is measured as the time from the end one service encounter to thestart of the next encounter.
Executive SummaryIn response to increasing complaints from physicians, patients, and staff in the PulmonaiyClinic at the Taubman Center at the University ofMichigan Hospital, a study ofthe patientflow within the clinics of Dr. Charles Watts, M.D., was requested by Dr. Galen Toews,M.D., Director of Internal Medicine. Because both physicians felt that the PulmonaryClinics within the Briarwood facility were more efficient, the clinics at the Briarwoodfacility were also studied in an effort to contrast the two clinics and to determine the bestmethods of operation at both. It was hypothesized that the problems within the TaubmanClinic were related to the scheduling practices of the clinic, the physical setup of the clinicand the interaction ofthe clinic with other departments such as Radiology.The objectives of the study were to provide recommendations to minimize patient waittimes in the clinic and to increase the percentage ofpatient service time verses thepercentage ofpatient wait time within the clinics. In an effort to evaluate these issues,time studies at both clinics were performedto determine wait times, service times, arrivaltimes and length of stay. Other issues involved physician utilization, room utilization andtime statistics related to the patients’ arrival times.From the data obtained through patient flow analysis, it was determined that the length ofstay at Taubman was on average longer than the length of stay at Briarwood. This wasattributed to the longer wait times, the need to visit other clinics for testing procedures,and a smaller availability of exam rooms. With regards to the total service times, the M.D.service times and the wait times, results were varied between new and return visitpopulations and between clinics. The patient scheduling templates at both clinics werefound to be ineffective as many of the patients were often seen on a first come first servedbasis. This method not only caused a bottleneck of examination rooms, but contributed toincreased waiting oflater patients. It was found that the percentage of service time atboth clinics was higher than that of wait times, however, this value was lower at Taubmanthan at Briarwood.In order to minimize patient wait time in the clinic and increase the percentage of servicetime verses the percentage of wait time within each clinic, several opportunities forimprovement were identified. These are as follows:In order to correctly schedule patients according to the time required for theirvisit, return visit patients should be defined as those who have been seen by Dr.Watts before, not just as patients who have been seen within the clinic before. When pre-appointment testing is required, inform patients of the necessity toanive early for their test procedures. The practice of seeing patients on a first come first served basis should beeliminated and the current scheduling template should be followed moreclosely, or a new scheduling template should be evaluated for use. Extra time should be allotted in the middle of the afternoon to allow thephysician to make up for any time lost in the first half of the clinic. 1
Return visits should be scheduled into the first clinic appointment time slot, asmost return visits were found to arrive early and have a smaller probability ofneeding testing (a bottleneck within the clinic at Taubman).2
1.0 Introduction and BackgroundDue to increasing complaints from physicians, staff and patients within the PulmonaryClinic at the University of Michigan Medical Center, Dr. Galen Toews, M.D., DivisionHead of Pulmonary Medicine, requested that a study be performed within the clinic in aneffort to minimize patient wait times and increase the percentage of service time versespercentage of wait time within the clinics. The clinics under the supervision of Dr. CharlesWatts were chosen to be studied at the Taubnian Center and at the Briarwood Clinic. Dr.Wafts’ clinics were chosen for the study as a result ofhis prior experience in both thehospital and private practice settings.The goals and objectives of this project were as follows: Minimize the patient wait times within the clinic.Increase the percentage of service time verses the percentage wait time withinthe clinics.Compare the two clinics to suggest a more efficient system of operation forboth.This study was aimed toward improving the operations at the Taubman and Briarwoodclinics and analyzed the activities and methods used by the physician, nurses, clerks andother providers working in the clinics.Key issues that were identified for this project included: .Current patient flow problems related to scheduling methods.Pre-appointment tests and scheduling.Current room utilization.1.1 Approach and MethodologyThe focus of this project involved performing the following tasks: Meeting with clients and coordinator to determine the focus of the project andthe expected outcomes.Observing both clinics to determine patient flow and develop flow charts ofboth clinics.Developing a data collection sheet completed by the provider during thepatient’s visit. This sheet was used to calculate the mean service and wait timesand to identif’ bottlenecks within the clinic. (Note that a visit was defined asthe time from check-in to check-out.)Completing a data analysis to determine service and wait times, physician andclinic utilization, appropriate scheduling templates, and distributions ofpatientarrival times.Interviewing clients and clinic staff to determine their views of the clinic and3
its operations. In addition, the interviews were used to determine some of thesuggestions for improvement within the clinic.Determining the impact of other clinics on the efficiency ofthe PulmonaryClinic (Radiology, Pulmonary Function Lab).Summarizing data for presentation, including suggestions for improvementwithin the clinics.1.1.1 Interviews with the StaffClerks, nurses, technicians and the physician were interviewed to obtain an understandingofthe inner workings of the Pulmonary Clinics at both facilities. In addition, all staffmembers’ suggestions were taken into account during data collection in an effort toimprove the data collection sheet and reduce the burden on the staff It was essential thatall staff members be updated weekly to carry out the project successfully and maintaincooperation on the project.1.1.2 Time StudyThe data collection sheet was used to collect wait and service times during a patient’s visitto the clinics. Service times collected included total clinic staff service times and M.D.service times. Wait times included time spent in waiting rooms prior to appointment, timespent waiting for tests, tithe spent waiting for the physician in the exam room and timespent waiting to check out. Each data sheet followed the patient through theirapp ointment at the Pulmonary Clinic from the time Of check-in to check-out. A copy ofthe data collection sheet is located in the Appendix.Data was collected for five weeks at the Briarwood Clinic and for four weeks at theTaubman Clinic. Data was gathered at the physician’s Tuesday clinic at Taubman (Feb.28, March 7, 21 and 28) and at his Wednesday and Thursday afternoon clinics atBriarwood (February 8, 15, 16, 22, 23 and March 1, 2, 8 and 9).It is important to note that the resulting data that was analyzed consisted of sample sizes,n ll(NP 4,RV 7)atTaubmanandn 45(NP 7,RV 38)atBriarwood. Dueto the variation in sample sizes between the two clinics, some error in assuming a directcomparison could have resulted. In addition, the sample size of n 11 at Taubman couldhave lead to a misrepresentation in the data analysis ofthe clinic operations.1.1.3 Direct Observation of ClinicIn addition to data collected on the data sheets, time was spent in each clinic to determinethe flow of patients through the clinic and the different environments within each clinic.Flowcharts showing patient flow through the clinics are located in Section 3.0.4
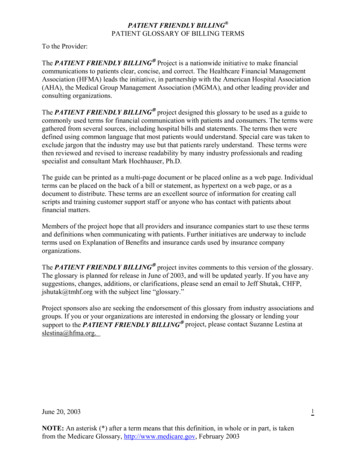
1.2 LimitationsBecause the analysis ofthe Briarwood and Taubman Clinics was restrained by time andmethodology factors, several limitations should be defined. Client Generated Data: Although data collection by the providers of care is apractical way to obtain data, there are possible concerns regarding accuracy,completeness, and reliability of data. In addition, it was assumed that data wascollected in an unbiased manner. Incomplete Data: Incomplete data was eliminated from the analysis. Problemswith this occurred at the beginning of the data collection period and at bothclinics when patients left to have testing performed. Sample Size: The discrepancy between the sample sizes of 11 at the Taubmanclinic and 45 at the Briarwood clinic may have caused errors in the resultsobtained. This gap between sample sizes was unavoidable in this study as therewere two clinics per week at Briarwood and only one per week at Taubman.2.0 Current Process Flow Description2.1 TaubmanCurrently at Taubman, the patients arrive at the Pulmonaiy Clinic first to register. Fromthere they are sent to the appropriate clinic ifthey are scheduled to have tests done priorto their appointment. Upon the patient’s return to the Pulmonary Clinic, they typicallywait in the waiting area to be taken back to an examination room by a medical assistant.Once called back, the medical assistant weighs the patient and checks their blood pressureprior to taking them to an examination rooni Once in the examination room, the patientwaits to be seen by the physician. Upon completion of the examination, the physician willdetermine if the patient needs further testing or, in some cases, if the patient needs to havea first set of tests performed. If the patient needs testing at this point, they will either beasked to make a test appointment for a later date or they will be sent immediately fortesting and asked to return to the clinic following their test for another consultation withthe physician. When the patient has completed their appointment, they proceed to thecashier to check-out and schedule a possible return visit. The above is illustrated on thefollowing page.5
Taubman FlowchartNPp-P—-N/A-20 ab.N/A (NP).14 (R)NP WANV -20 nfl.p .75 (NP)NV-6.2 nfl6Figure 1. Taubman Flowchart
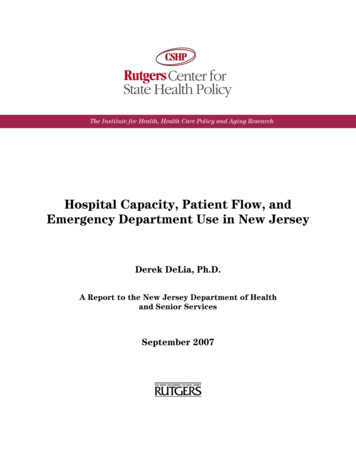
2.2 BriarwoodCurrently at Briarwood the patients arrive to the clinic, check-in and then wait for amedical assistant to call them back for either testing or their appointment. Typically atBriarwood if a patient needs to have an x-ray performed, they arrive early, have the x-raytaken and bring the results with them to the appointment. When the patient is called backby the medical assistant, they have their blood pressure and weight taken. If the patientneeds to have a spirometry or pulmonary function test done, a technician can perform thisin the same clinic and quickly obtain their results. If tests such as these are needed, theyare typically done thirty minutes before the patient is scheduled to see the physician. Thescheduling practice takes this into account. Following their test, the patient is placed in anexamination room and waits to be seen by the physician. Upon completion of theexamination the physician determines if the patient needs further testing or, in some cases,if the patient needs to have a first set of tests performed. If the patient needs testing at thispoint, they will be sent immediately for testing and will be seen again by the physicianfollowing their tests. In some cases if an x-ray is required and cannot be doneimmediately, the patient will be asked to schedule an appointment for a later date. Whenthe patient has completed their appointment, they proceed to the cashier to check-out andschedule a possible return visit.7
BriarwoodflowchartNP - 60 mlii.RV — 9.3 mlii.P—.57 (NP)NP — 9.5 mlii.SW - 7.8 wIn.p—.29 (NP)NPRY—La M.7.8 mlii.NP 4.0 mlii.RV - 5.0 mlii.p—.99 (SW)NP IS mlii.RY — 12.3 mlii6Figure 2. Briarwood Flowchart
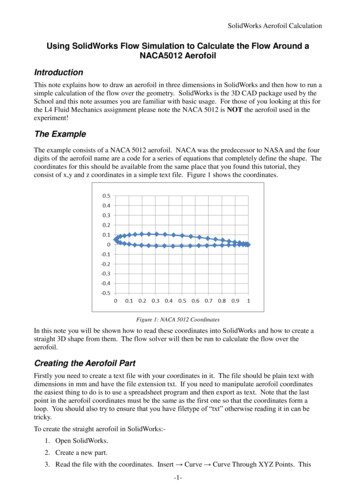
3.0 Results and Conclusions3.1 Patient PopulationThere is a significant difference between the patient populations at the two clinics. Manyof the patients at the Briarwood facility are long-time patients of the physician and theirmedical history has been monitored accordingly. The patients in the Taubman clinic areusually in need of more lengthy visits, and although most are classified as return visitsbecause they have been seen in the clinic before, these are often patients who have neverbeen seen by the physician (Dr. Watts) and require the same type of examination as a newpatient.The following table shows the break down of the types of schedule characteristics andalterations within the clinics. This chart shows that there was a higher percentage ofnoshows and cancellations at Taubman.Table 1. Schedule CharacteristicsNo-ShowAdd-OnCancellationRegularly ScheduledBriarwood4%15%17%65%Taubman5%13%24%58%3.2 Data SummaryThe table on the following page summarizes the data collected during the study at both theBnarwood and Taubman Clinics.9
0C,)C—.r)CCCci,
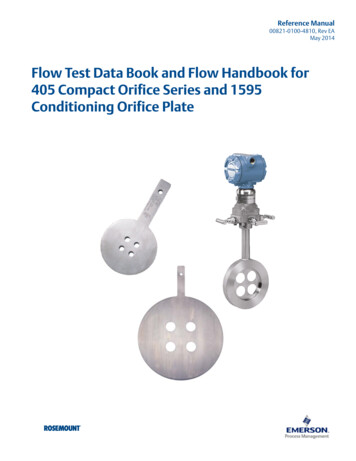
The summary statistics in the table were compiled from the data collection sheets usedduring the analysis and were separated into overall, new patient and return visit summariesfor each clinic. Further analysis of this data is provided in the figures on the followingpages.As can be seen in the following pie charts, the percentage of service time is greater thanthe percentage of wait time, however, this percentage should be increased at both clinics.% Service vs. %WaitBriarwood-% Wait37%% Service63%Figure 3. Percent Service vs. Percent Wait at Briarwood ClinicAlthough the results were better for the Briarwood Clinic than for the Taubman Clinic,improvements could be made to increase the percentage of service times further.% Service vs. % Wait% Wait44%-Taubman% Service56%Figure 4. Percent Service vs. Percent Wait at TaubmanNote that the patient spends almost an equal time waiting to be seen in the clinic as theydo actually being seen. These results are the reasons for both staff and patientdissatisfaction within the clinic.11
3.3 Arrival TimesThe following graphs show the results of the patients’ arrival times to both clinics.Surprisingly, the results for the two clinics showed that typically patients arrived early totheir appointments. The results were different at Taubman, however, following a patient’stest appointment.Minutes Early to Clinic-S(I,D Briarood TaubmanEa,EOverallNew PatientReturn VisitFigure 5. Minutes Early To AppointmentAs shown in Figure 5. above, patients arrive earlier for their scheduled appointments atBriarwood than at Taubman. Note that these are arrival times to the clinic prior to a testprocedure. This can be attributed to the fact that patients have found that they are able tobe seen and finish their appointment earlier at Briarwood if they arrive to the clinic prior totheir appointment time. Typically, ifthe physician is available when a patient arrives, he orshe will be taken back and examined ifpossible. Another reason for the difference in theamount oftime early for an appointment is that it is much easier to find parking atBriarwood than at Taubman. It is possible that a patient may arrive early for anappointment at Taubman, but have trouble parking and arrive late to the reception area.12
The following figure shows the significant difference in patient arrival times following atest procedure at the Taubman Clinic. As testing was not determined to affect patientarrival times at Briarwood, the data is not included in the graph.Minutes Early!Late After Test15(I, Taubman10E5EI-0II-5OverallNew PatientFReturn VisitFigure 6. Minutes Early or Late to Pulmonary Clinic Following TestingFigure 6. shows that patints at Taubman arrived to the clinic approximately 2.5 minuteslate overall following a test procedure. It is interesting to note that the new patientsarrived to the clinic approximately 17 minutes late following a test procedure, while thereturn visit patients arrived early to the clinic following testing. The complexity of newpatient’s testing and evaluation could be one reason for the significant difference in arrivaltimes between new and return visit patients. Briarwood data is not represented in thisfigure because data was not collected for this aspect of the study.13
3.4 Wait TimesThe following graphs show the different wait time characteristics at both clinics. It isimportant to note that a wait times was defined as any time that a patient was not with acare provider or other staff member.Wait Time in Waiting Room from Time of Appointment30co25.co(I,Snarwod Taubman2O.1 5.ODa)EI-io.co5.co1Overall2New Patient3Return VisitFigure 7. Wait Time inWaiting Room from Time of AppointmentFigure 7. shows that patients are required to wait longer in waiting rooms from the time oftheir appointment at Taubman than at Briarwood. Generally, the physician has morerooms available for use at Briarwood than at Taubman. During data collection, thephysician used 5 rooms at Briarwood and 4 rooms at Taubman. The availability of examrooms makes it possible for staff to take patients to an examination room more quickly. Inaddition, it is also possible for patients to miss hearing their name called by a staff memberwhen it is time for their appointment. This is a particular problem at Taubman due to thefact that several clinics operate out of the same reception area. As such, it is very difficultfor the staff to keep track of the patients that have missed their name being called.14
Wait Time in Waiting Room from Time of Arrival25.a)D BriarwoodTaubmanEEI-321OveraNNew PatientReturn VisitFigure 8. Wait Time in Waiting Room From Arrival TimeDue to the number of patients arriving before their scheduled appointment time it wasdeemed necessary to also analyze the amount of waiting time from the patient’s arrivaltime. As in the previous figure, waiting times are also shorter at Briarwood than atTaubnian. This can also be attributed to the number of available exam rooms and the firstcome first served system cvhich is currently being used in
Executive Summary In response to increasing complaints from physicians, patients, and staff in the Pulmonaiy Clinic at theTaubman Center at University of Michigan Hospital, a study of the patient flow within the clinics of Dr. Charles Watts,