Transcription
MotiveWave Volume and Order Flow AnalysisVersion: 1.4 2019 MotiveWave Software
MotiveWave Volume and Order Flow Analysis GuideTable of Contents123456789Introduction1.1 Terms and Definitions1.2 Tick Data1.2.1 Historical Bid/Ask Prices1.2.2 Generated Ticks1.3 Depth of Market (DOM) Data1.4 Summary of Volume Studies/ToolsTime Price Opportunity (TPO) Study2.1 General Settings2.2 Display Settings2.3 Initial Balance Range (IBR) Settings2.4 TPO Value Area Settings2.5 Volume Profile2.6 Session ColorsVolume Imprint3.1 General Settings3.2 Display Settings3.3 Imbalance Settings3.4 Profile Settings3.4.1 Display Section3.4.2 Value Area Section3.5 Ladder Settings3.6 Summary Profile Settings3.7 Candle Totals Settings3.8 Totals SettingsDelta VolumeCumulative DeltaBid/Ask VolumeSpeed Of TapeDOM Power8.1 DOM History8.2 Speed GaugesComponents9.1 Volume Profile Component9.2 TPO ComponentVersion 1.4 2019 MotiveWave 333436383940444447Page 2 of 48
MotiveWave Volume and Order Flow Analysis Guide1 IntroductionWelcome to the MotiveWave Volume and Order Flow Analysis Guide! If you are reading thisdocument then you have already installed MotiveWave on your computer and you are ready to startusing the application.If you have not yet installed MotiveWave or registered for a trial on our website, please read theInstallation Guide before continuing on with this document.The purpose of this document is to highlight and explain some of the recent features added toMotiveWave for analyzing volume and order flow.1.1 Terms and DefinitionsThe following are common terms and their definitions that explain some of the concepts in Volume andOrder Flow analysis:AbsorptionAbsorption occurs when a buying/selling trend is “absorbed” by a large order (or large number oforders) and the trend reverses. Absorption is defined by a Bid or Ask Imbalance that is followed by areversal in price of X ticks.Ask VolumeAsk Volume is the volume that occurred (traded) at the ask price. This volume typically representsbuying activity and is sometimes known as Buy Volume or Up Volume.Bid VolumeBid Volume is the volume that occurred (traded) at the bid price. This volume typically represents sellingactivity and is sometimes known as Sell Volume or Down Volume.Delta DOMDelta DOM is the difference between the sum of bid sizes and the sum of the ask sizes that are in theDOM ladder. Positive values indicate support and negative values indicate resistance.Delta SpreadDelta Spread is the difference between the best bid size and the best ask size. This is similar to the DeltaDOM but only considers the best bid/ask.Delta VolumeDelta volume is the difference between the Ask Volume and the Bid Volume (ie Delta Vol Ask Vol – BidVol). Positive delta values indicate buying pressure and negative delta values indicate selling pressure.Extended Trading Hours (ETH)Defines the time of the day outside of the regular trading session where after hours trading occurs.Volume is typically lower during these hours.Imbalance (diagonal)Version 1.4 2019 MotiveWave SoftwarePage 3 of 48
MotiveWave Volume and Order Flow Analysis GuideA buy imbalance occurs when ask volume at a given price is higher (by a given percentage) than the bidvolume at one price level below (sometimes known as diagonal imbalance). Sell imbalance occurs whenthe bid volume is higher by a given percentage than the ask volume at one price level higher.Initial Balance Range (IBR)Conventionally, this is the range (high/low prices) that the instrument reached during the first hour (60minutes) of trading.InstrumentAn instrument is the security that is being traded. All instruments trade on an exchange and areuniquely identified by a symbol/exchange. There are several types of instruments (such as stocks,futures contracts, contract for difference (CFD) or FOREX).Naked POC (NPOC)This is a Point of Control (POC) that does not overlap (touch) in future sessions (sometimes referred toas Virgin POC).Open RangeOpen range is similar to Initial Balance Range but with a shorter period. Typically this is the range(high/low) that occurred during the first 5-30 minutes of the regular trading day, but will vary dependingon the market.Point of Control (POC)Represents the price (or price range) where the highest amount of trading activity occurred. This maybe based on volume (for a Volume Profile) or time (for a TPO chart).Price Range/IntervalVolume/Market (TPO) profiles can optionally be depicted using price ranges instead of individual prices.This is typically useful for highly volatile instruments (large price ranges) or instruments with very smalltick sizes (such as FOREX).Regular Trading Hours (RTH)Defines the time of day where regular trading occurs for an instrument.Resistance LineThis line visually indicates where a possible over supply of ask volume may exist to provide priceresistance to keep the market below the line.Support LineThis line visually indicates where a possible over supply of bid volume may exist to provide price supportto keep the market above the line.Tick Size (Min Tick)Version 1.4 2019 MotiveWave SoftwarePage 4 of 48
MotiveWave Volume and Order Flow Analysis GuideThe Tick Size represents the smallest movement in price for an instrument. For stocks this is typicallyone cent (0.01). Values for other instrument types (such as Futures Contracts or FOREX) vary widely.These values are typically set correctly in MotiveWave but you may need to adjust manuallydepending on the broker or data service that you are using.TPO (Market Profile)TPO stands for “Time and Price Opportunity” (sometimes referred to as Market Profile). Similar to aVolume Profile, it graphically illustrates the amount of time spent at each price (or price range) over agiven period of time (typically daily, in 30-minute sub intervals).Trade VolumeTrade volume represents the number of trades that occurred over a given period of time. This is similarto volume, but only considers each trade and not the number of units that were exchanged. Tradevolume will always be less than or equal to ( ) volume.Trading HoursTrading hours define the times of the day when an instrument is available for trading. Someinstruments (such as Stocks or Futures) have regular trading sessions and extended (after hours) tradingsessions.Value AreaThe Value Area is the price range (centered around the Point of Control) that encompasses X% of thetrading activity (typically 70%). The value area may be computed using volume or time.VolumeVolume represents the number of units (stocks, contracts etc) that were traded (exchanged hands) overa given period of time.Volume ProfileA volume profile graphically depicts the volume traded at each price (or price range) for a given periodof time. This identifies how trading activity is distributed by volume (exchanged units).1.2 Tick DataThe Volume and Order Flow analysis tools described in this document rely on tick data to presentaccurate results.Tick data is a record of the trades that occurred for an instrument. Tick data is not available from allBrokers and Data Services and in some cases only partial information is available. It is very important tounderstand these limitations as they will affect the accuracy of the information that is presented fromthe Volume/Order Flow Analysis tools.There are two types of tick data:1. Live Ticks – These ticks are generated from a Level 1 feed (live price updates) and are stored inmemory. By default, MotiveWave will keep up to the latest 2000 ticks, but this is configurablein the Preferences Dialog (Configure - Preferences from the Console menu bar, see “General”tab). These live ticks are merged with the historical ticks where appropriate.Version 1.4 2019 MotiveWave SoftwarePage 5 of 48
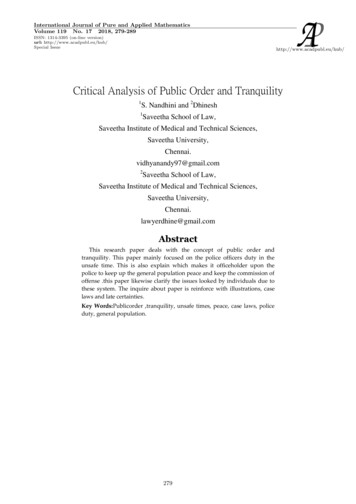
MotiveWave Volume and Order Flow Analysis Guide2. Historical Ticks – These are ticks that have occurred in the past and are downloaded from theBroker/Data Service or from the MotiveWave back fill server. The amount of data available willdepend on instrument and the source.Each tick may contain the following information:1.2.3.4.5.6.7.Trade Time – this is the time at which a trade occurred (in millisecond precision).Price – This is the price that the trade occurred at.Volume – Number of units that traded hands in this tradeAsk Price – The best ask price at the time of the trade (used to determine Ask Volume)Ask Size – number of units available at the best ask price at the time of the tradeBid Price – The best bid price at the time of the trade (used to determine Bid Volume)Bid Size – number of units available at the best bid price at the time of the tradeBid/Ask sizes are not currently used by the volume analysis tools in MotiveWave but are available inthe Time/Sales panel and the Java SDK (see Tick interface).The following table explains tick data availability. Brokers/Data services not listed (and that don’tconnect via a gateway such as CQG, Rithmic or GAIN Futures) do not provide historical tick data.Broker/Data ServiceCQG1GAIN 2Time/Price/VolYYYYBid/Ask PriceYYYYBid/Ask SizeYNYYYYNYTime/Price OnlyNNNNHistorical Limit Back Fill10 DaysY3?Y3?Y38 Days (60NDays AfterHours)?N?N?Y3?Y31CQG/Rithmic/GAIN Futures are gateways to many different brokers. Check your broker connection to see if theyconnect through one of these gateways.2FXCM Tick Data does not include volume information and can be extremely slow to load.3Loaded from MotiveWave Back Fill server. Back Fill may not be available for all symbols.1.2.1 Historical Bid/Ask PricesHistorical bid/ask prices are used to determine if the trade occurred at the “Bid Price” or the “Ask Price”.This is used to separate Bid Volume from Ask volume.As illustrated in the table from the previous section, historical bid/ask prices are not available from somebrokers/data services. In cases where this information is not available, the price from the previous tickwill be used to determine if the trade should be used to tally Bid/Ask volume. When the price increases,it is considered an “Ask Tick” and when it decreases it is considered a “Bid Tick”. If the price remains thesame, the Bid/Ask Tick is inherited from the previous tick.1.2.2 Generated TicksFor many of our supported Brokers and Data Services historical tick data is not available. In these casesMotiveWave will generate ticks using minute bars (and in some cases second based bars). Each barwill generate 4 ticks, each with one quarter of the bar’s reported volume:Version 1.4 2019 MotiveWave SoftwarePage 6 of 48
MotiveWave Volume and Order Flow Analysis Guide1. Open – Open price of the bar with ¼ of the bar’s volume2. High/Low – If the close is greater than the open the high is used first, then the low otherwise lowthen high. Each of these ticks has ¼ of the bar’s volume3. Close – Closing price of the bar with the remaining volume in the barBid/Ask volume is determined using the rules from the previous section where bid/ask prices are notavailable (ie: previous price determines bid/ask volume).1.3 Depth of Market (DOM) DataDepth of Market (DOM) data shows the cumulative sizes (at each price step) of active limit orders thatexist above and below the current price. The number of available rows above and below the currentprice depend on the exchange and the source of the data. For most futures (especially from the CME),this is limited to 10 rows above and below.All depth of market data is live data only (no historical values are available from the exchange).MotiveWave will accumulate historical Depth of Market data at 1 second intervals in memory the firsttime a DOM panel (or study that uses DOM data). This historical record of DOM data can be useful tosee where the hidden market demand exists and help to predict the short-term movement of themarket.1.4 Summary of Volume Studies/ToolsMotiveWave has many different volume-based studies and two components. The complete list ofthese studies can be found under the Study - Volume Based sub menu (see top menu bar). In thisdocument we will be focusing on the following studies/components:1. Time Price Opportunity (TPO) – Provides a graphical illustration of how much time is spent ateach price.2. Volume Imprint – Provides several different views of how the trading activity of a price bar(candle) breaks down with Bid/Ask volume.3. Delta Volume – Plots the difference between the Bid/Ask volume4. Cumulative Delta – Plots the difference between the Bid/Ask volume as it accumulates throughthe trading day.5. Bid/Ask Volume – Plots the Bid Volume and the Ask volume together so that you can identifychanges from buying pressure to selling pressure.6. Speed of Tape – Displays the current and historical speed pace of the market for a given statistic.7. DOM Power – Displays current/historical order demand at the bid and ask.8. DOM History – Historical display of cumulative limit order sizes above and below the marketprice.9. Speed Gauges – Displays active statistical values graphically on the price graph.10. Volume Profile Component – Allows you to dynamically draw a Volume Profile by dragging thecomponent from the “General” panel (or using the Mouse Tool). The range for the volumeprofile may be adjusted using the resize points).11. TPO Component – Component version of the TPO study. The component allows you todynamically select the time frame for the TPO/Volume Profile by using the resize points. Thiscomponent is available in the “General” panel or as a mouse tool.Version 1.4 2019 MotiveWave SoftwarePage 7 of 48
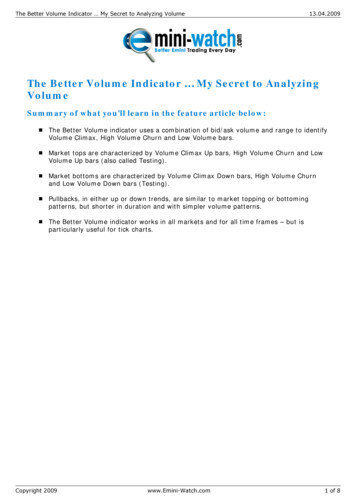
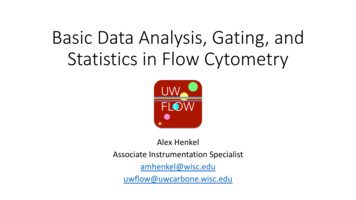
MotiveWave Volume and Order Flow Analysis Guide2 Time Price Opportunity (TPO) StudyThe Time Price Opportunity (TPO) study displays market activity using time and price (sometimes knownas Market Profile). This study can be found under the Study - Volume Based menu (see top menu bar).The following screen shot of the S&P mini futures contract illustrates some of the features of the TPOstudy.
TPO (Market Profile) TPO stands for Time and Price Opportunity (sometimes referred to as Market Profile). Similar to a Volume Profile, it graphically illustrates the amount of time spent at each price (or price range) over a given period of time (typically daily, in 30-minute sub intervals). Trade Volume Trade volume represents the number of trades that occurred over a given period of time .